Stock Market: All Eyes on Greece
While we here in the USA look forward to Memorial Day tomorrow, the rest of the World will have all eyes on Greece and the potential skids of the impact of exiting the Euro fast coming to a head.
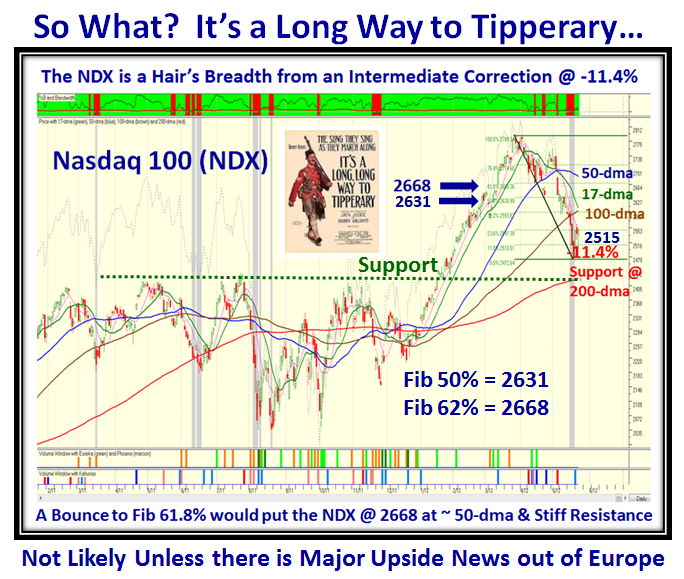
Although the Major Market Indexes have grudgingly given up ground to the point where they are essentially at or close to their 200-dma, there are underlying signs of hope that with the majority of the Quarterly Earnings Reports behind us there is a fresh set of leaders rising as a result. Let’s first look at the Gloom and Doom Scenario. This time I have chosen the Nasdaq 100 (NDX) since these are the Big Cap Leaders we usually focus on to show us which way the wind is blowing for the overall market:
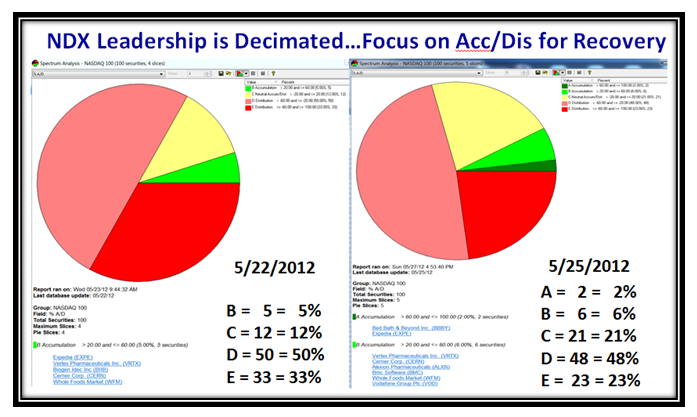
As the Chart above shows we are already within striking distance of the 200-dma and into an Intermediate Correction of 12% to 16%, if there is no recovery from here. Even an 8% Bounce Play would only get us back to around 2668, where the NDX will encounter stiff resistance at the 50-dma. To fully understand how weak this Group of 100 stocks is at this stage, I chose to look at the Accumulation/Distribution picture of learning your ABCDEs as I have addressed many times previously. Note that on 5/22/2012 there were ZERO stocks with “A” Accumulation and only 5 with “B”…hence the Market is essentially Leaderless if we focus only on these Big Cap Stocks:
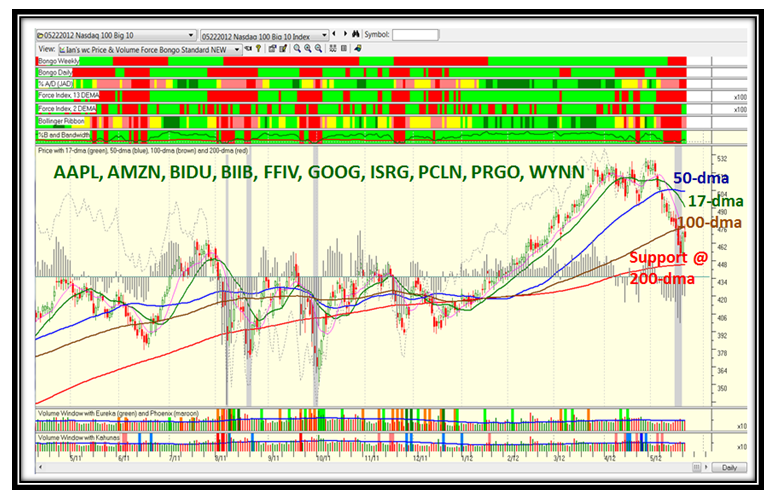
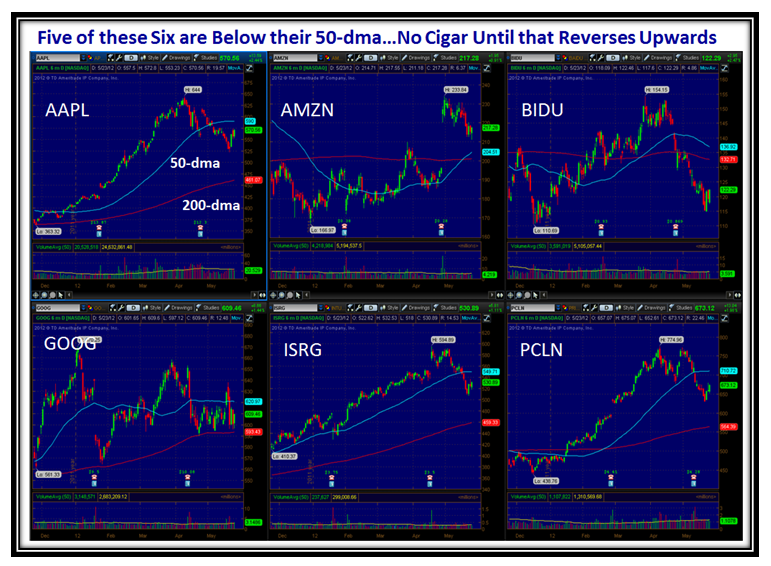
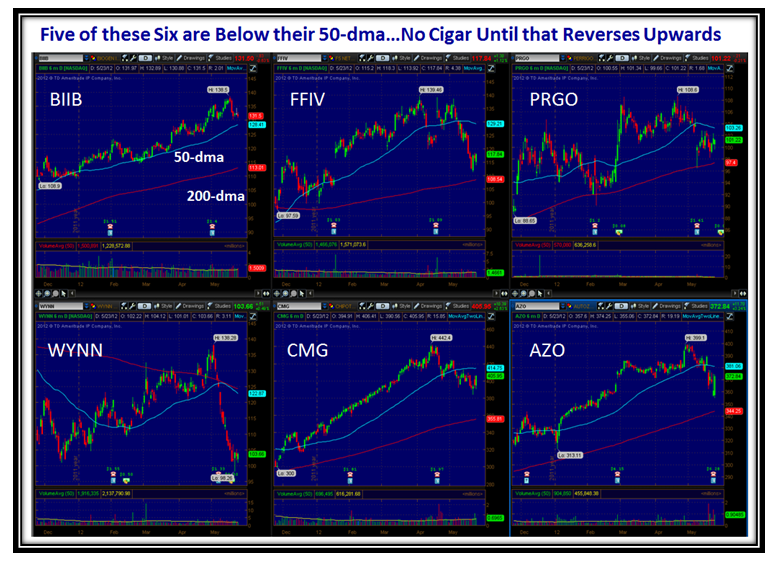
Big Cap Stocks that are representative of this group are the usual suspects which are shown below, and as the Index shows for these ten stocks the picture is essentially identical to the one above. Only two stocks…AMZN and BIIB are above their 50-dma, and the Blood Red on the extreme Right Hand Side of the Chart together with the three days of a grey bar line (Bingo) suggests utter weakness. As you well know by now, we need a couple of Eureka (green) and Kahuna (blue) lines within a week for us to have any confidence that we at least can enjoy a Bounce Play.
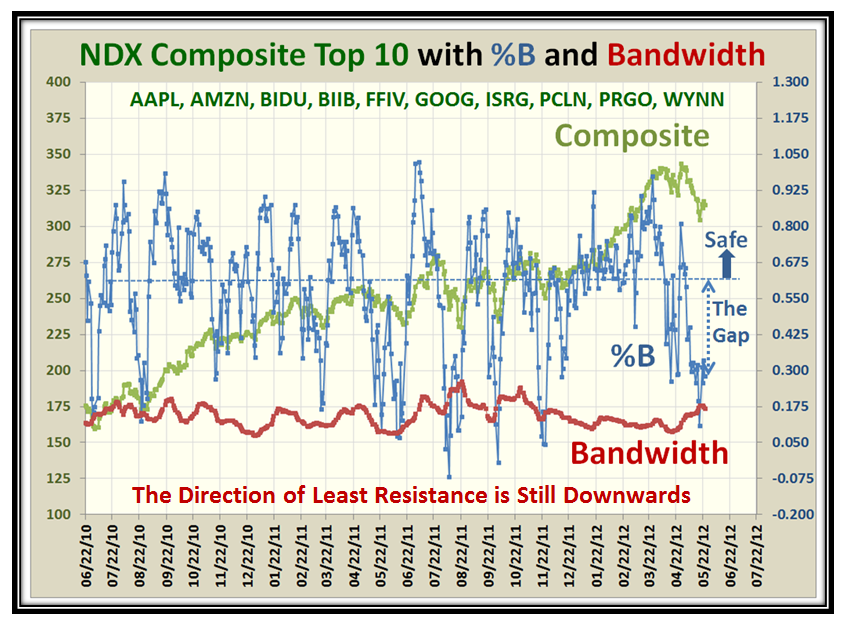
To give us a measure of how far away we are from a decent bounce play, leave alone a Rally, the next chart shows the Gap to the “Safe” zone for %B of the Composite Average of these ten stocks.
As I mentioned only two stocks…AMZN and BIIB are above their 50-dma and here are the pictures for the ten plus two more stocks which are all greater than $100 in price. That has to change quickly if there is to be a Summer Rally. We are fighting the “Go Away in May” syndrome where most are occupied with Graduations, Weddings and Vacations:
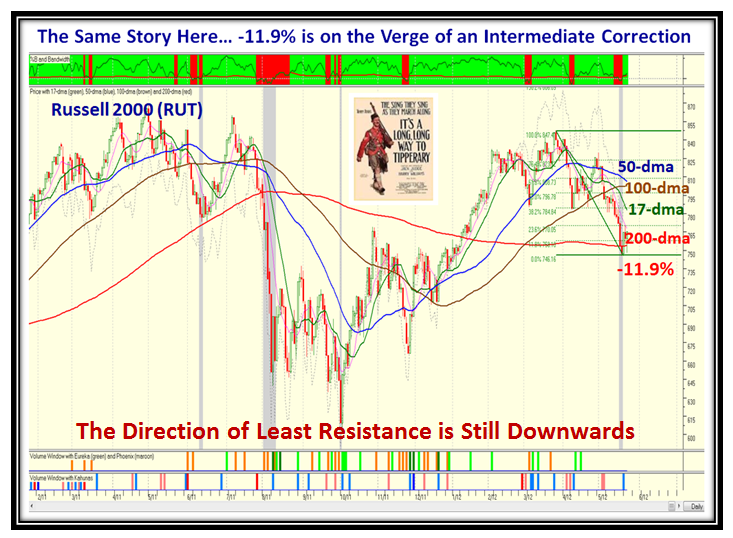
If that is not enough to convince you that we are on the edge of a Major Correction here is the picture for the Small Cap Russell 2000 Index. The picture is even a shade worse, and so “It’s a Long Way to Tipperary” to recover:
Well enough of all this Gloom and Doom Picture…now for “Hope Springs Eternal”. As I mentioned above, we are essentially at the end of the Quarterly Earnings Season, and this is the time to sharpen your pencils and make note of those Companies that have come through with stellar earnings. This provides Gas in the Tank for the next leg up and is invariably shown by a few important points to note from the recent chart action:
1. There will invariably be a recent Gap Up in price
2. That will usually be accompanied by at least a Small Kahuna (light Blue line) and more often a Dark Blue one
3. The Quarterly Earnings will be higher and sometimes as much as 100% for the quarter.
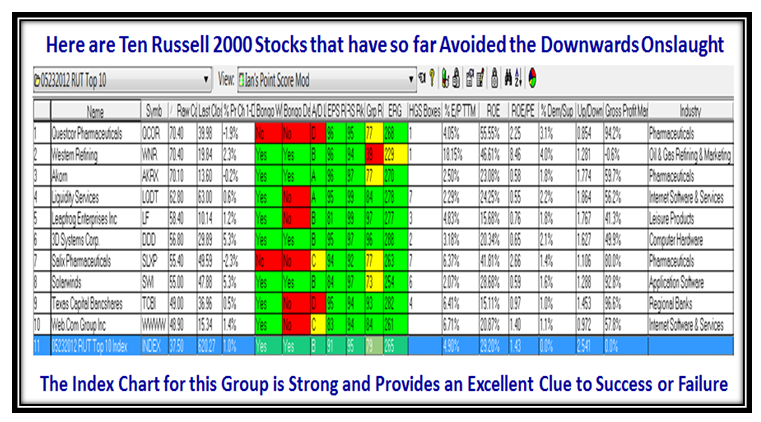
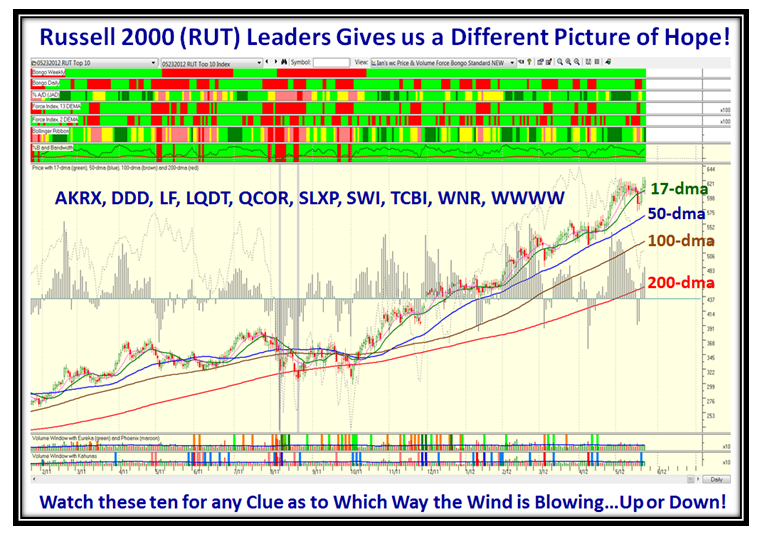
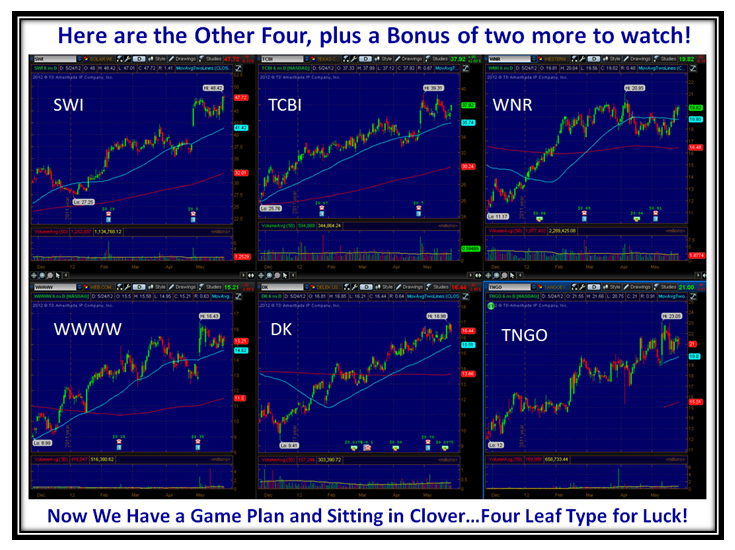
Having shown you an ugly Russell 2000 Chart, now let’s look at these 10 which are Leading Stocks from that lot:
…And here is the resulting Composite Chart pattern for these ten stocks. By the way, the HGSI software is the only one that I know of which can provide this feature of showing the Index for any group of stocks your heart desires:
…And in this case, unlike the other, they are all at or above their 50-dma!
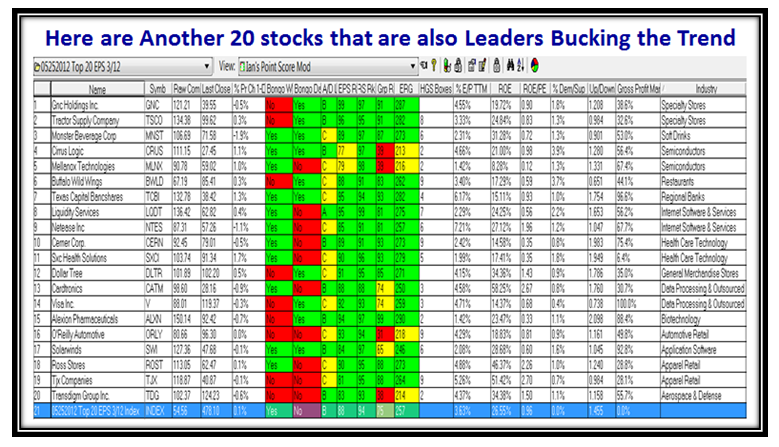
Here for good measure are another list of twenty stocks that are also Leaders bucking the trend:
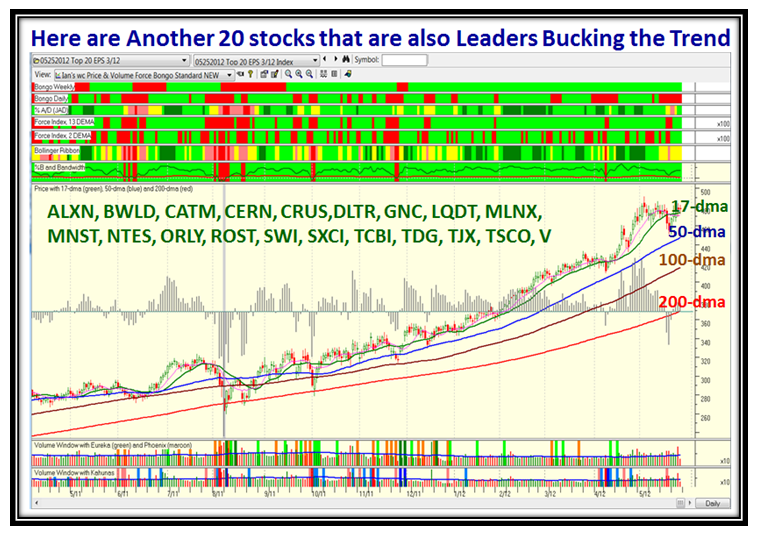
…And here is the corresponding chart with the symbols on it for you to see more clearly:
So What’s the Message? We have a Game Plan with two different scenarios to guide us; on the one hand the laggard big and small cap stocks and on the other the stocks already showing amazing strength in a rotten market. We can use these two sets to get a sense of whether we just head on down further or the laggards get new life to pull the whole Market up with the ones already on their way going higher.
I am delighted to see that my Worldwide clientele is growing with leaps and bounds as a percentage of the total following on this blog. I trust these messages are of value to you on the pulse of the market and that you have a sense of direction of what to watch for to keep you on the right side of the market. I don’t recommend stocks but show you where the fish pond is from time to time. Please send us a comment or tell a friend if you like what you see. That goes for my regular clients on this side of the pond. I need your encouragement and feedback. Just write a comment below this note.
Best Regards,
Ian
 Ian Woodward's Investing Blog
