Stock Market: What Goes Around Comes Around!
On this quiet Sunday as we mourn the loss of all those innocent people in Newtown, I turn to happier times when my friends around me over the years have given me a helping hand to help you help yourselves. My Global Supporters are a trifle starved for new information, and so this Blog Note contains concepts and charts they have probably not seen before, and is my way of thanking my friends for the gems they have given me which include work by McClellan and of course, Bollinger.
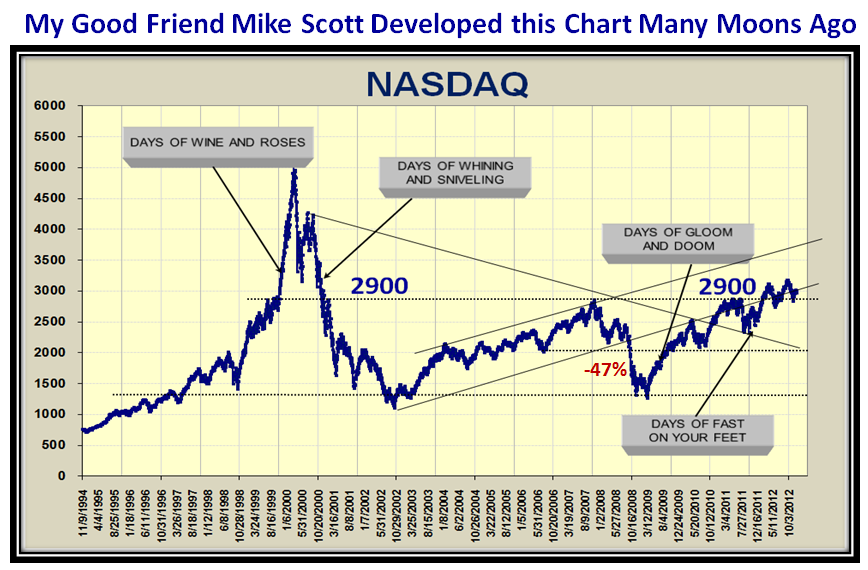
Thank heavens we have come down to the last two weeks before this Fiscal Cliff mumbo jumbo is resolved for better or worse, and so I am reminded of the Days of Wine and Roses and also those of Whining and Sniveling:
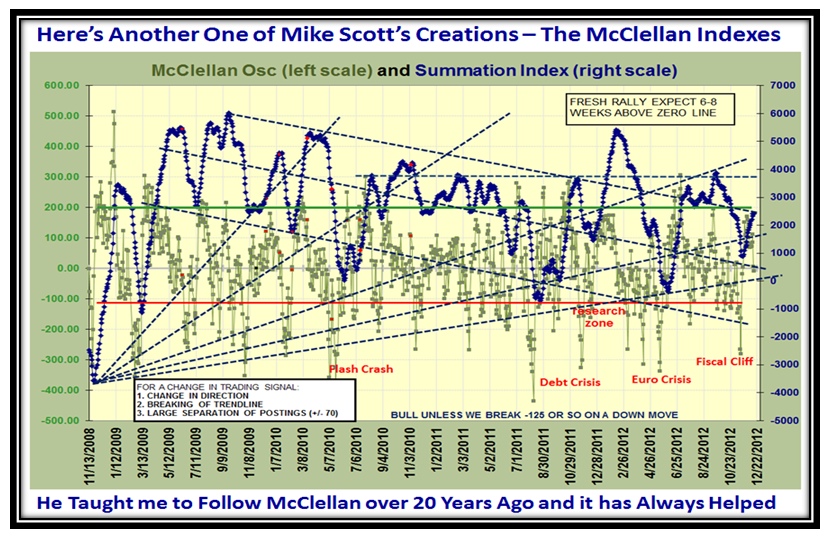
So, let me pluck two charts which my good friend Mike Scott (Aloha) conjured up many moons ago, one of which tips our hat to Sherman McClellan and his son:
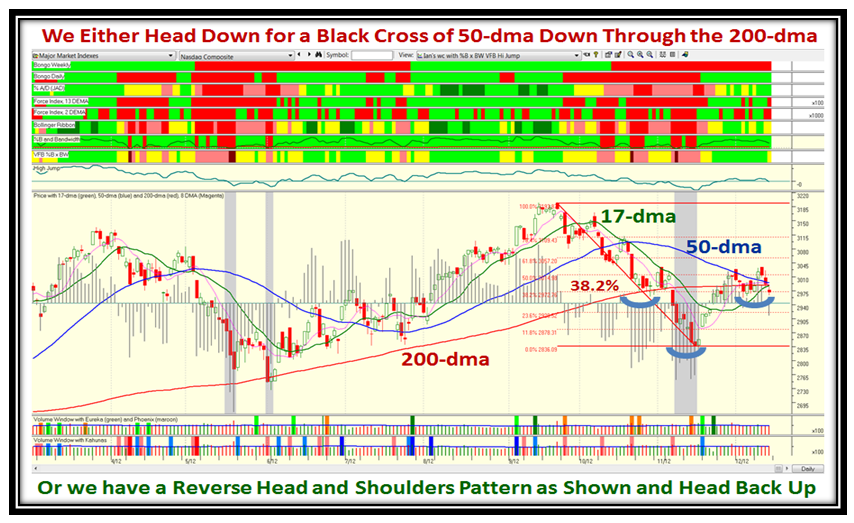
It goes without saying that RIGHT NOW we are Marking Time at the Pivot Point of Bouncing Back or Trotting Down once again as this next chart shows using the NASDAQ Market Index:
The above chart is dedicated to all the friends I have made who are supporters of the HGSI Team over the past 14 Years and to those who were with me at Telescan for the previous six years…time flies when you are having fun and meeting sincere people who help each other.
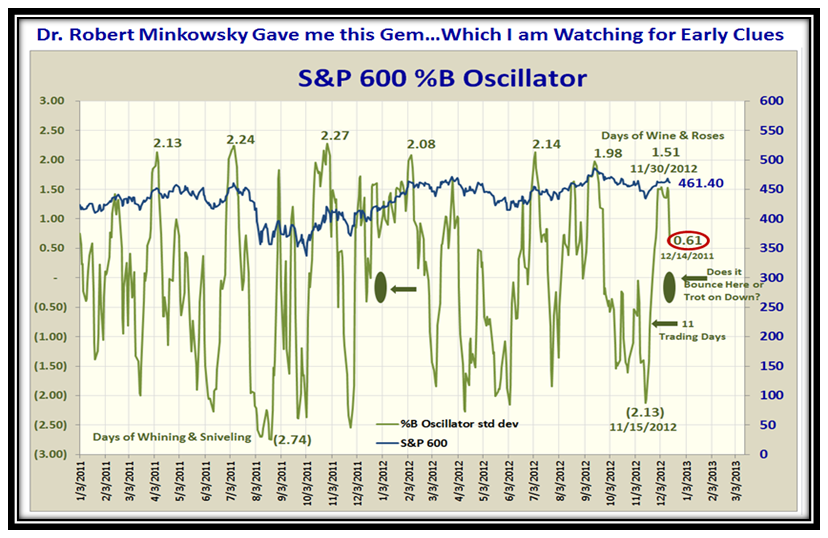
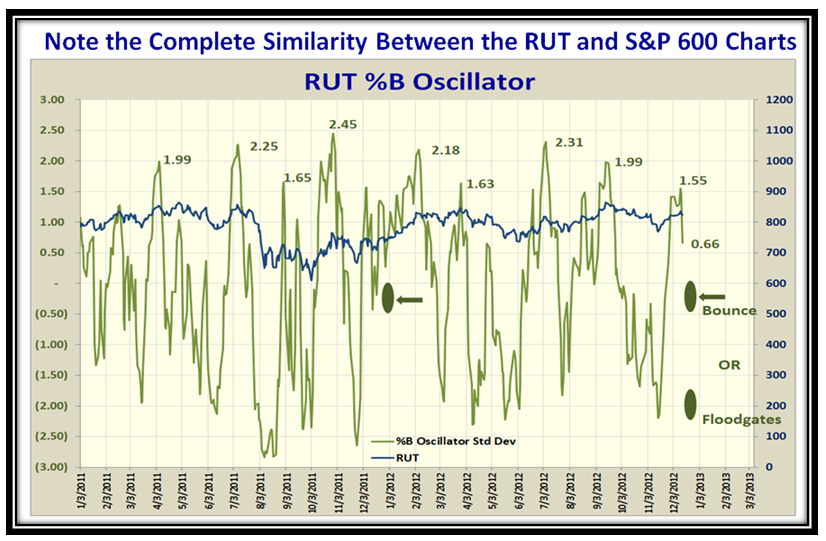
…And here is the latest Gem from Dr. Robert Minkowsky who has added icing on the cake of John Bollinger and my work with the two examples I show below for the first time hot off the press. We are almost into the start of the January Effect when the Small Caps like the S&P 600 and the Russell 2000 (RUT) bloom through the first week in January and so I chose these two examples to showcase his work:
I will be discussing the fruits of these charts at the Roundtable on Tuesday afternoon, but suffice it to say that we are at a critical juncture where we either stop the skids and rebound or trot on down into the abyss which would imply that the Market did not react favorably to the Fiscal Cliff News eagerly awaited.
Although this is new work, it has great promise on several scores:
1. The charts show that we have normalized the %B Readings to swing using Standard Deviations
2. Options Traders will get excited as they use Std. Devs. in their work
3. The Movement is magnified and rapid between Tops and Bottoms with hesitations in the 0.5 to -0.5 area
4. Short Term Traders should love this stuff as Tops > 1.5 Std. Dev signals time to look for a move down
5. Likewise, look at the sharpness of the bottoms to identify when the Market is about to go up
It won’t take long to wait to see the results based on the two conditions I have given you to look out for.
Remember, that’s what friends are for…what goes around comes around!
My Deep Appreciation to you all in the Autumn of my Years,
Ian.
 Ian Woodward's Investing Blog
