Ian Woodward's Investing Blog

Archive for February, 2013

Sequestration Bounce and Slide

Sunday, February 24th, 2013

The Stock Market is totally “News Driven” and we have another week if not more of this to tolerate.  We got the Bounce Play on Friday which was satisfactory but not startling, so the Slide and Bounce Yo-Yo continues:

Bounce Picture

Having taken you Tip-Toeing Through the Tulips these past several weeks, the Ball Game is simple and can be summarized now in one slide.  We got the Bounce Play so it now continues or we slip-slide away.  So, I won’t prolong the agony:

Bounce Pat

The Bounce Play had better continue early this week or we head back down for a bigger correction.  Good luck for this coming week.

Best Regards,

Ian.

Stock Market: It’s the Real Thing!

Thursday, February 21st, 2013

We had a follow through day to the downside, and the odds favor “The Real Thing” over a “Knee Jerk” as I suggested as the alternatives in last night’s Blog Note.  I will treat this as an update to yesterday, so I will show you the charts with very little verbiage:

Real Picture

Ten Days Gains were lost in just two days on most Market Indexes:

Real Indexes

There is an inviting Gap between 3021 and 3076 that is below here and needs to be filled on the Nasdaq:

Real Nasdaq

The Russell 2000 (RUT) took a big hit these last two days with 7 Buckets down:

Real RUT

…While the VIX is inching up as you would expect.  It needs to get above the 200-dma at 17 to cause fireworks:

Real VIX

Since the two big days at the turn of the Year we have been waiting for the Big Guns to produce heavy selling and now we see it:

Real 8

The Leaders are getting Trounced:

Real Acc

7.2 Buckets in two days is hard to recover from, but don’t count out a Bounce Play.  The quality of that Bounce will tell us a lot:

Real Pat2

As we would expect, there is a big shift to the downside on the % of Stocks in the Lower Buckets:

Real Pat1

The majority of the evidence points to the downside, but sometimes the Market will fool you.  Stay alert, and Keep your Powder Dry.

Best regards,

Ian.

Stock Market: Knee Jerk or the Real Thing?

Wednesday, February 20th, 2013

After a strong move yesterday which took the Market Indexes into New Highs, would you believe that wonder lasted just one day as we had a Five Bucket Down day on average for the Market Indexes?  The $64 question is whether it is a knee jerk or the real thing by way of the much anticipated correction?  The Bad news was there was consternation in the FED Minutes on their Monetary Policy:

Jerk Picture

If I may say so, it seems that the Market is on the Three Road Scenario I had postulated…the first one was a complete surprise with the Miracle Bounce Up, and now we see if this 5 Bucket Down Day produces a Knee Jerk Fakey or we head on down for a Correction of the Rally which has gone all of four months, and certainly with the big breakout right out of the barrel at News Year’s time.

Jerk Indexes

You will recall that we had the first shot across the bow on 02/04/13, and two weeks later we had the big Knee Jerk down:

Jerk 5 Buckets

We have followed the Russell 2000 (RUT) as it has been one of the leaders, but today we got the dreaded hit of 5 Buckets Down:

Jerk RUT

The VIX had a Field Day today shooting up 8 Buckets after being dormant and now we wait to see if it spikes up further or falls back:

Jerk VIX

The Leaders took a big hit today with A+B losing over 300 stocks from that group and the lot continues down:

Jerk Acc

I have updated this next chart to show the High Road Bounce Play is behind us and we are now on the way down between ending  with a Knee Jerk which could turn out to be a Fakey or it is the real thing in a further correction which has long been expected:

Jerk Pat2

…And here is the twin picture which shows the deterioration today in the %B and the percentages in the Buckets:

Jerk Pat1

I feel the next two days are critical, so watch carefully and make your call of Bull or Bear depending on how they play out.  If there is no let up tomorrow to the downside with heavy volume then it would seem the call is to the downside, but understand that the Game Playing has begun and you call it as you see it.

Best regards,

Ian

Stock Market: High Road to Climax Run

Tuesday, February 19th, 2013

I have been very busy this past week, but felt I must raise a Flag after all the Blog Notes that got us to this point. We are at a critical juncture and this is probably the start of a Climax Run:

Sherlock Picture

You folks know the go to charts at a time like this.  So, let’s not waste any time and you judge for yourself:

Sherlock Pat2

Notice that when %B hits the top bucket, i.e., >1.0, it doesn’t stay up there for more than a few days.  The next chart shows we have had a long run above 0.5 for nearly a month, and that the Index is now Overbought:

Sherlock Pat1

Do Not anticipate the potential correction, but time is running out after today’s strong move up.

Best Regards,

Ian

Stock Market: Sectors Starting to Droop

Sunday, February 10th, 2013

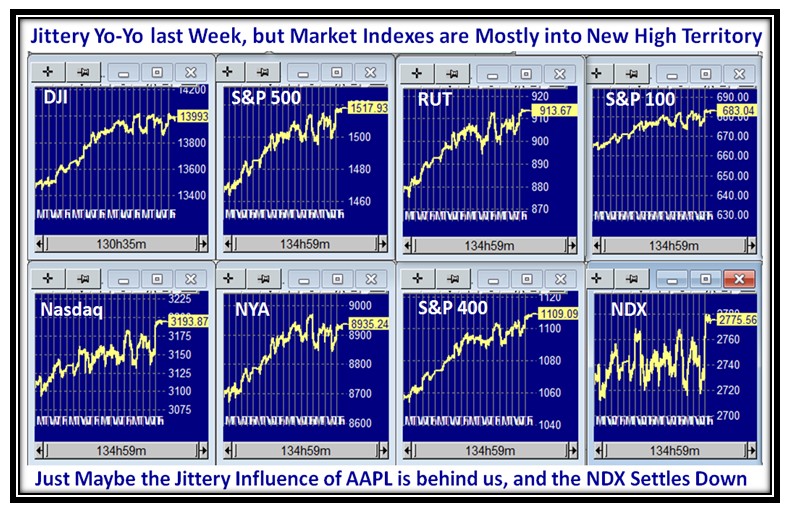
It goes without saying that all of us are on our toes watching with our favorite methods of reading the tea leafs for any major sign of a rollover in the Market, but except for a wiggle here and a waggle there, the Market Indexes continue to make new highs albiet at a snail’s pace as I will show you.  We need a pogo stick big jump to the upside…hopeful thinking!

Pogo Picture

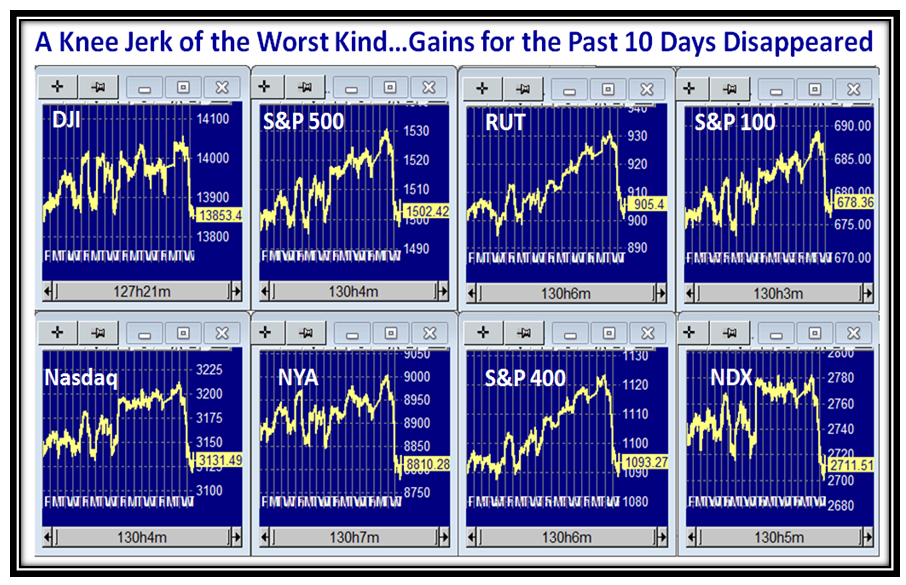
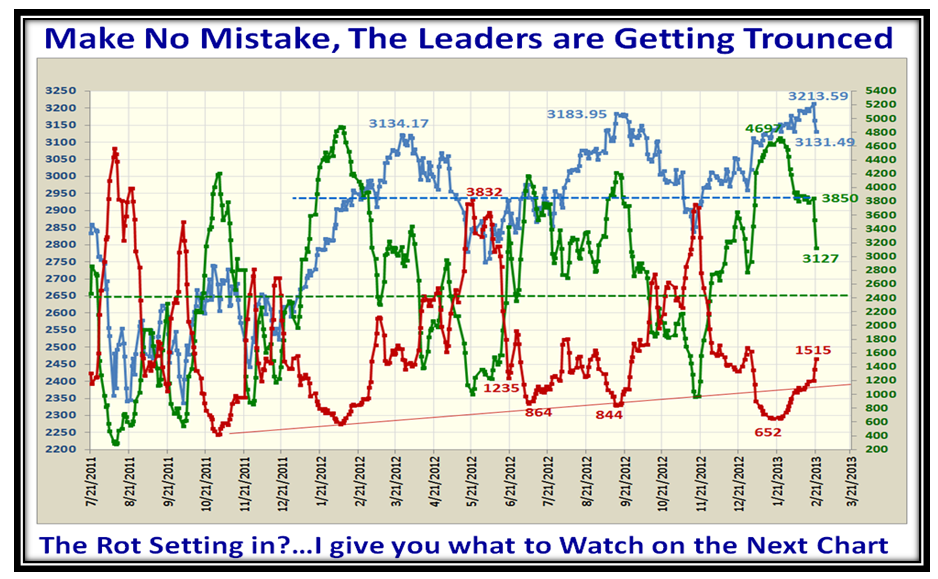
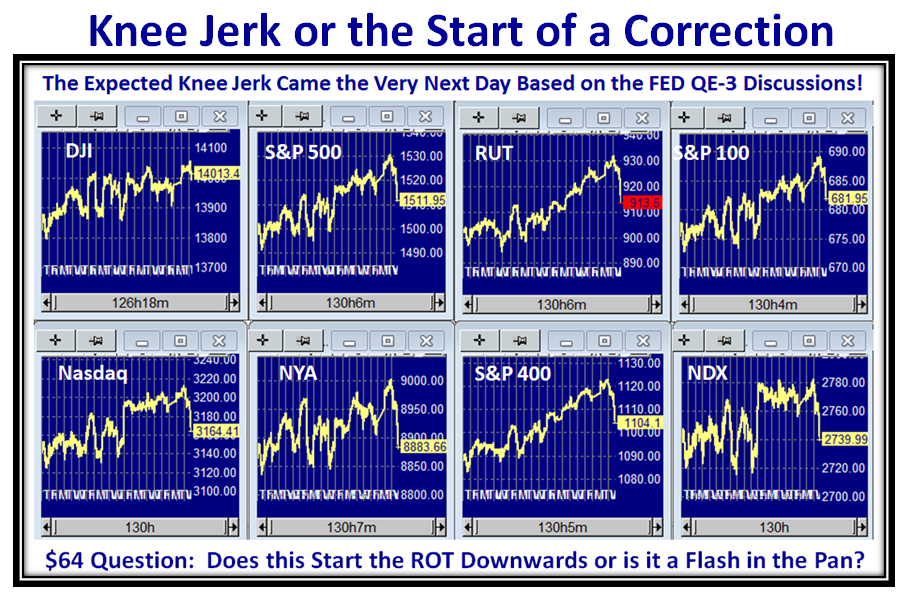
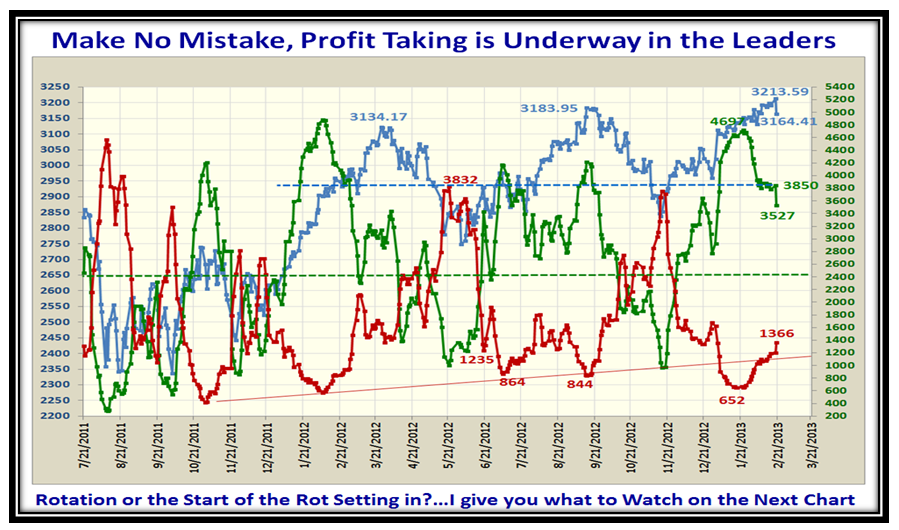
Still, the beat goes on and although the next slide of the Market Indexes shows the Yo-Yo we tolerated this past week , many of these Indexes finished into New High Territory over the past ten days (say).  With a glimmer of sunshine on the AAPL front, maybe the worst is behind on the NDX Big Caps Index which stands out as hopping around on a pogo stick:

Pogo Indexes

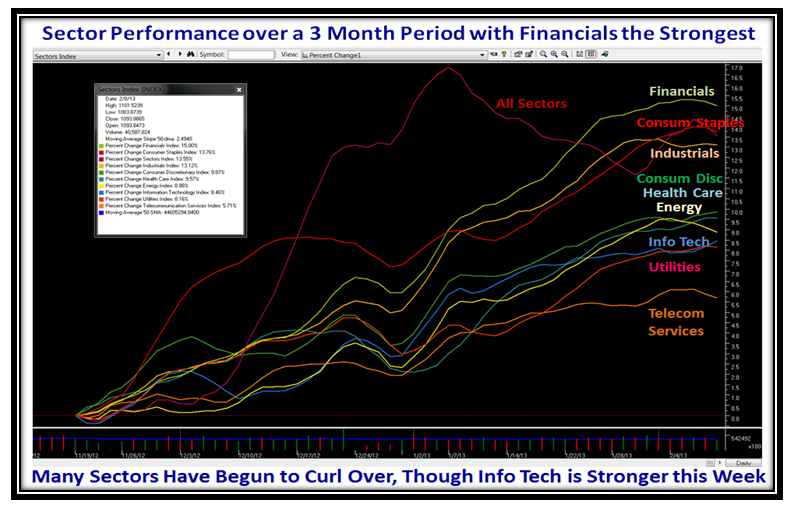
Earl reminded me a couple of weeks ago that the Financial Sector was moving very well, so I felt it was time to show off another powerful feature of the HGSI Software, which shows the % Price Change for the various Sectors below.  The picture shows the performance in the last three months, and true to form the Financials are the best.  If we want to be real picky, there are the first signs of turning down this past week, but that is not enough to call the top, especially as at least three of the Sectors are still turning upwards,  Information Technology, Health Care and Consumer Discretionary.

Pogo Sectors

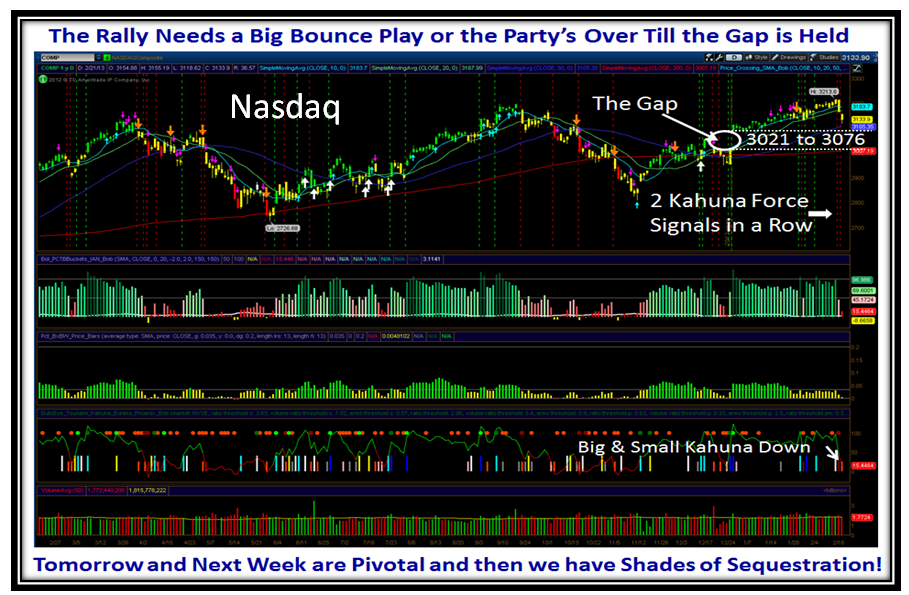
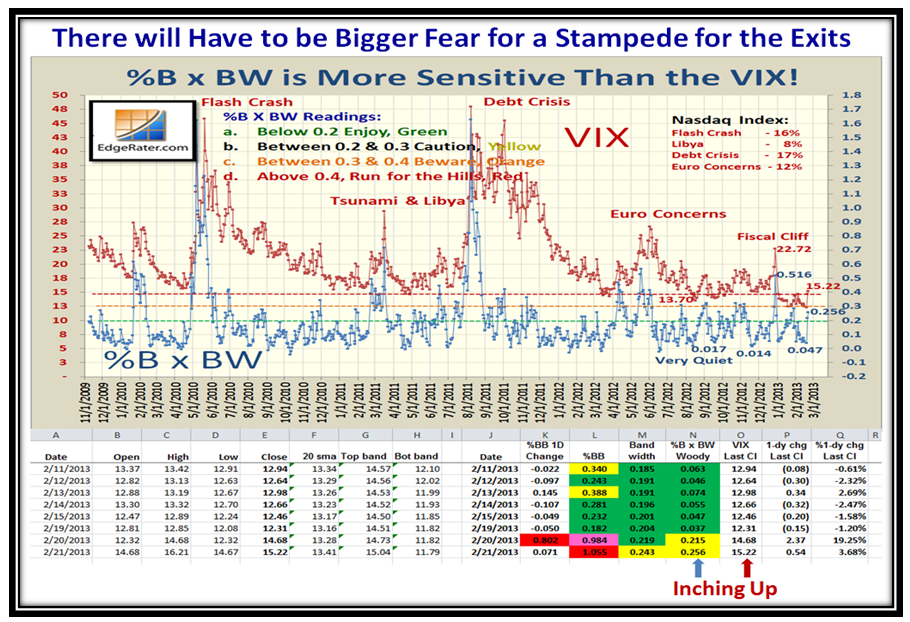
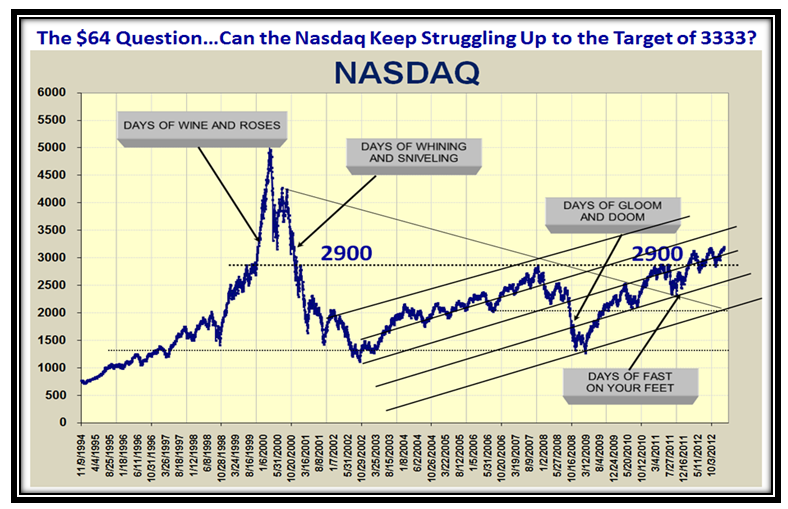
I am still rooting for a move on the Nasdaq to 3333 as I featured in the last two blog notes, and update this information again for your perusal a couple of slides later.  Meanwhile the NASDAQ inches up slowly as shown below thanks to my good friend Mike Scott, who has faitfully kept me up to date on his findings for the past 20 Years:

Pogo Nasdaq

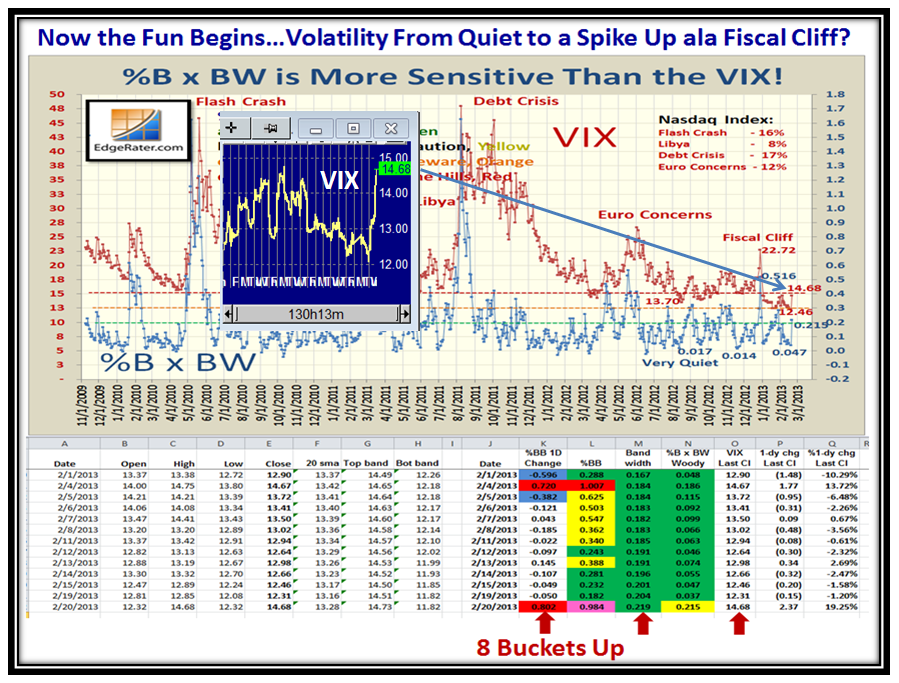
We avidly follow Tom McClellan’s good work, and recently he had a snippet that caught my eye…”Before late 2007, the “9-month cycle had an average period of about 185 trading days.  Since then, it has been between 156 and 168 trading days (8 months).”  By the way, 185 Trading Days (9 months) equates to Feb 27, and that is mightly close to the next Big Cliff we are headed for relating to Sequestration on March 1, so if the Big Guns decide to prop this Market up until then, that is something to bear in mind.

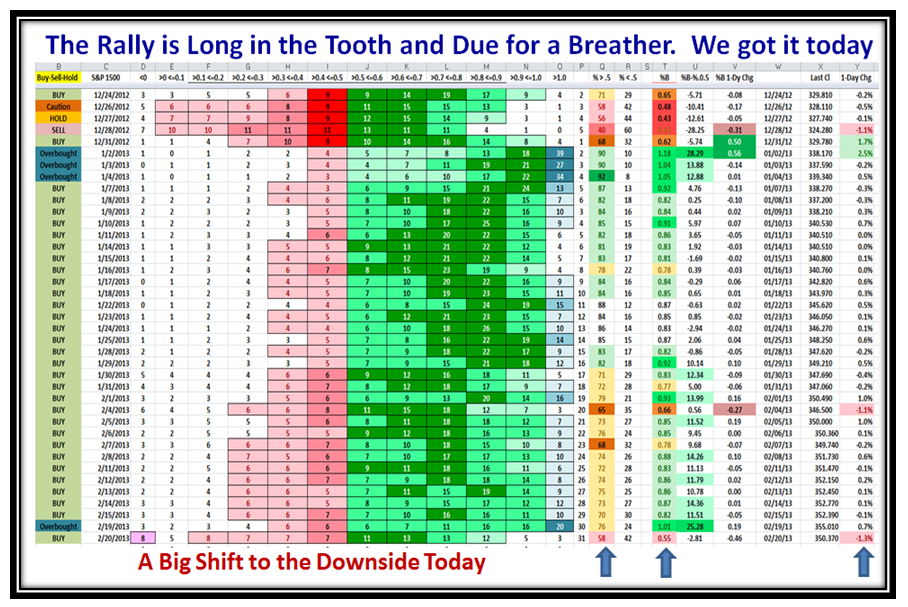
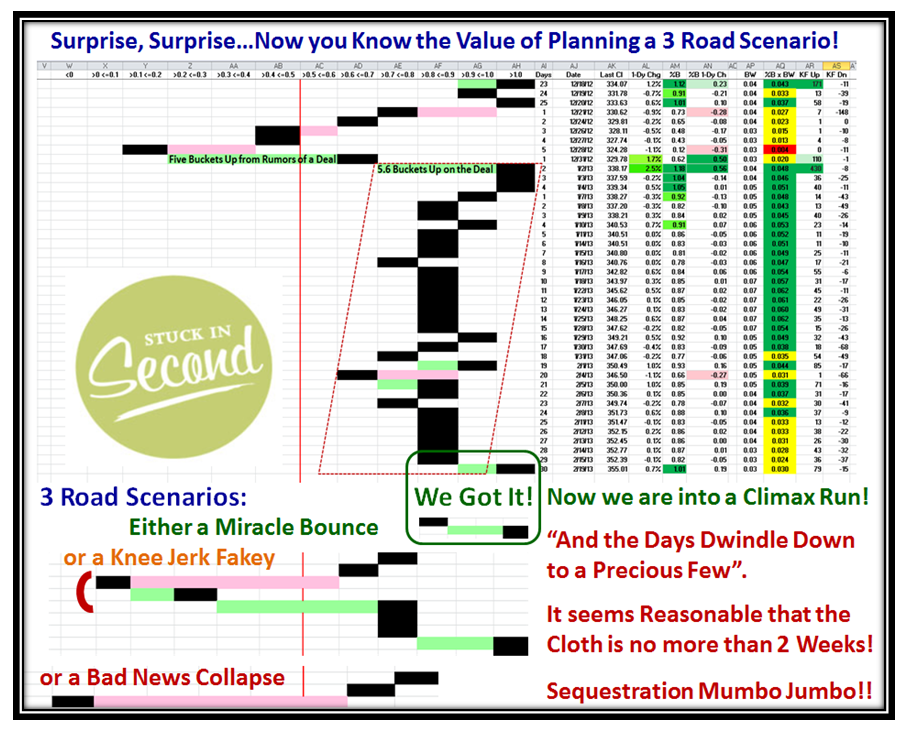
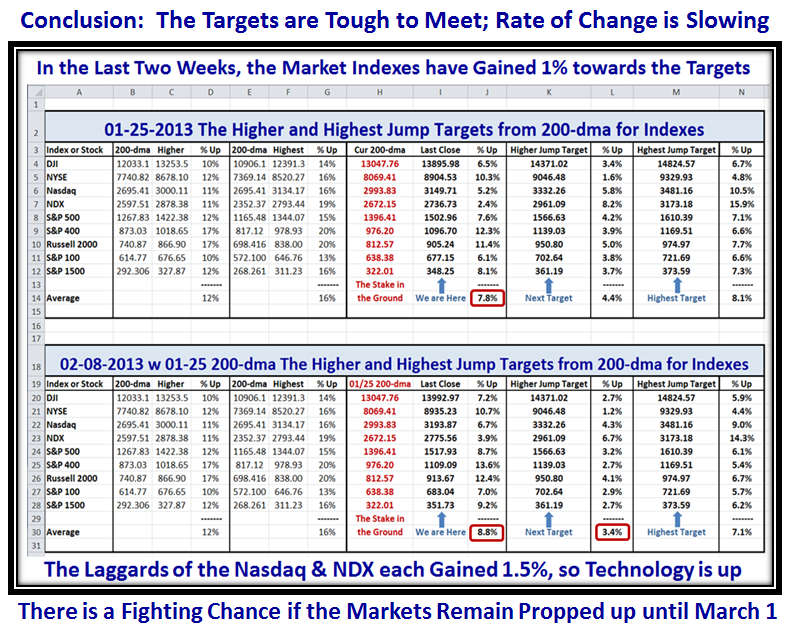
Now we come to the Targets I set on 1/25/2013, and the updated results since then.  We have inched up on the Targets to the tune of 1% over two weeks, with 0.8% up the previous week and only 0.2% this past week.   We are now only 3.4% away from the Targets for the Higher Jump, but we will need a pogo stick jump up in the Markets if we are to make them within the next three weeks.  I call this the High Road Scenario, and sometimes wonders never cease in these tricky times:

Pogo Targets

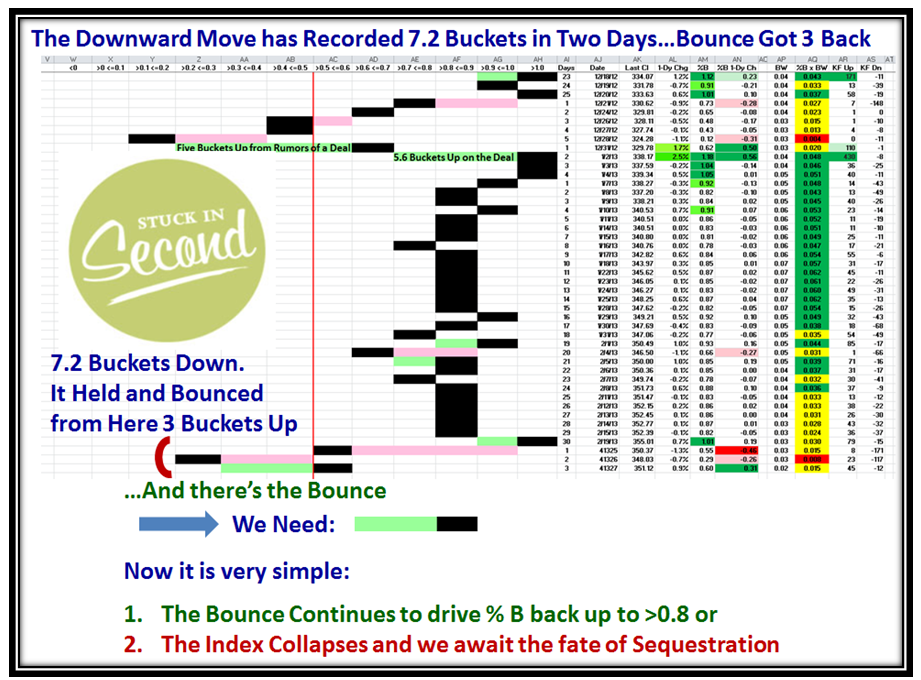
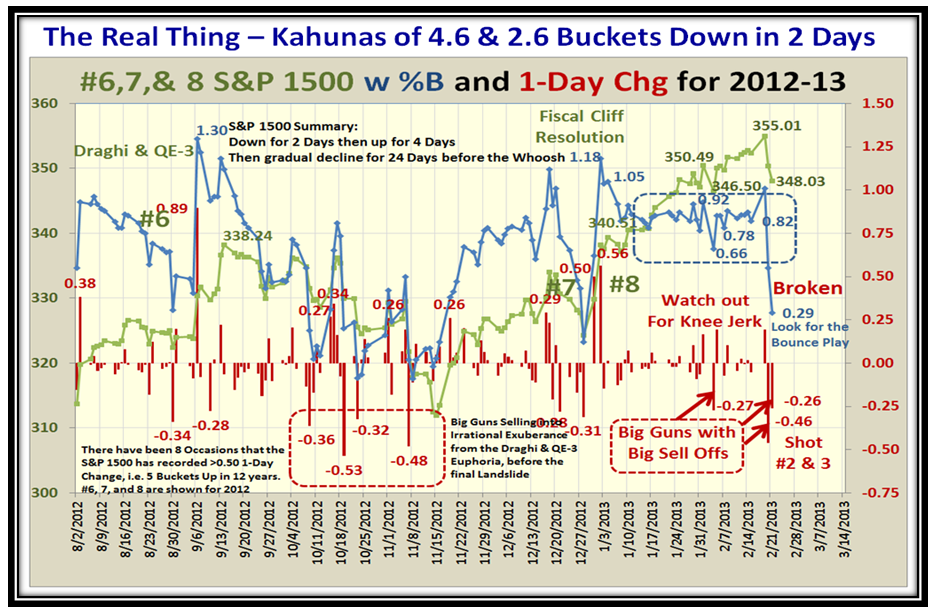
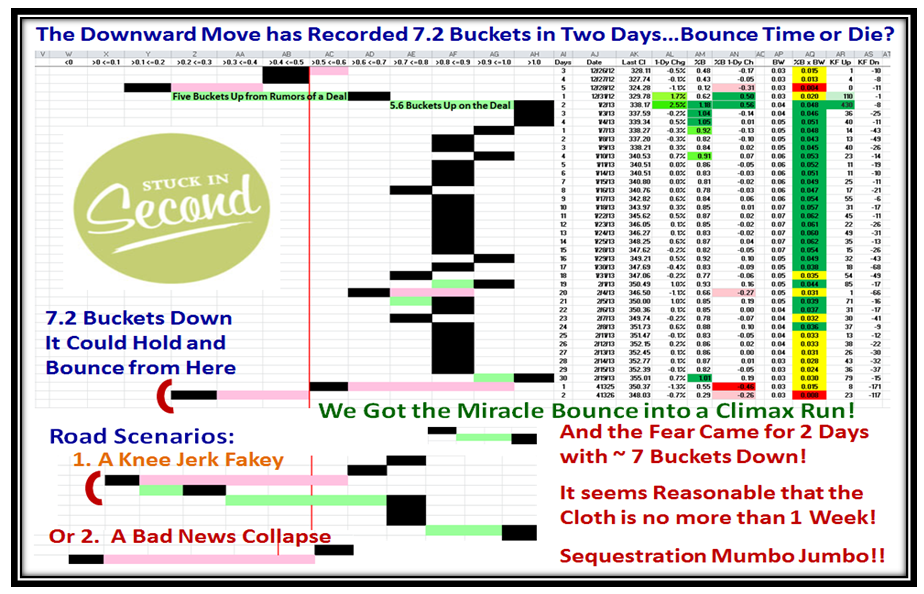
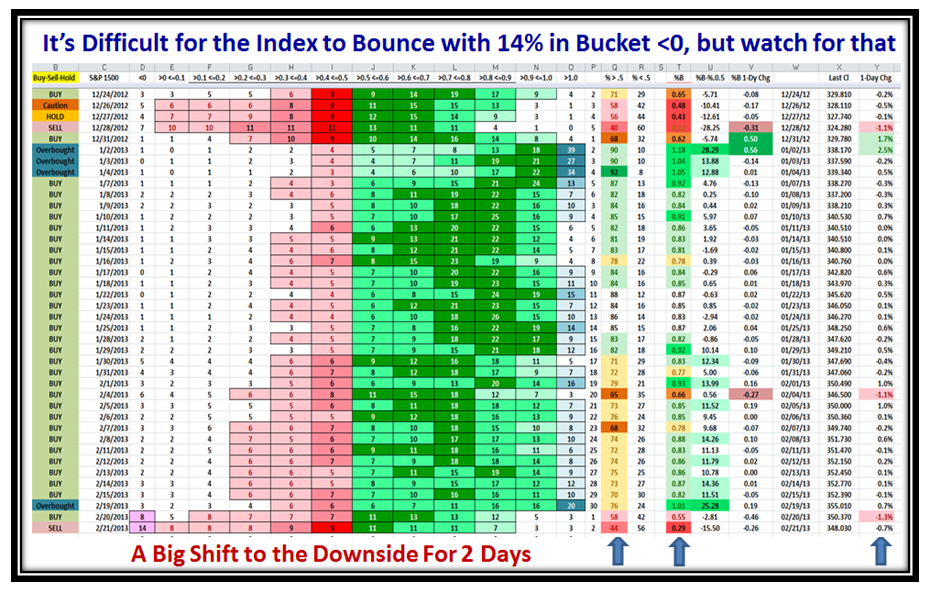
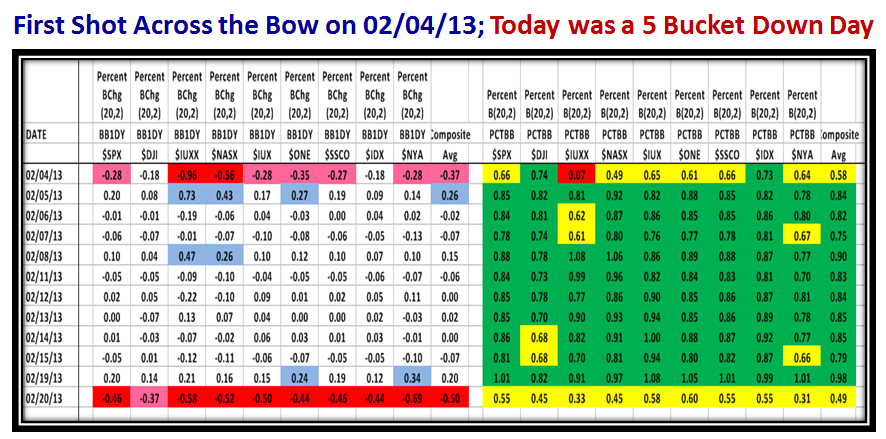
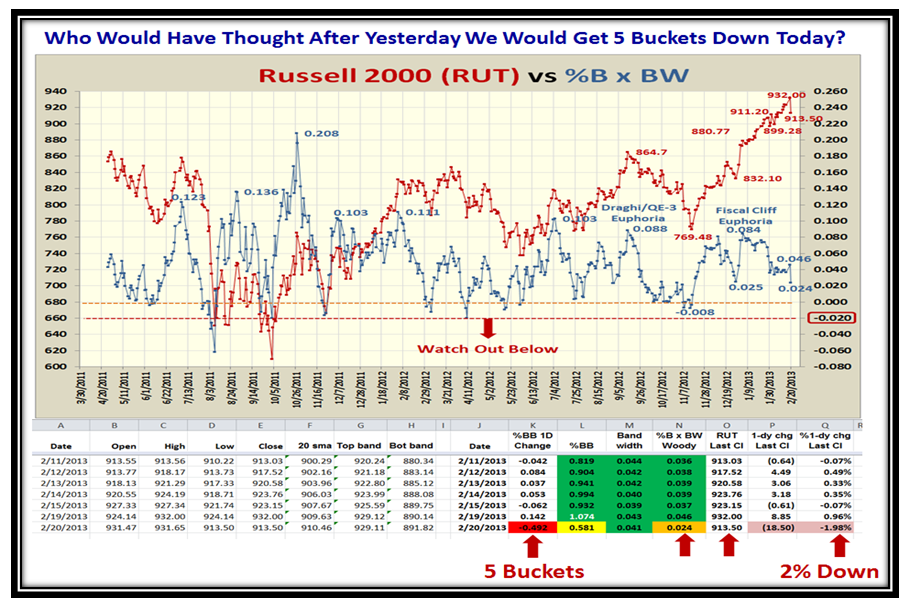
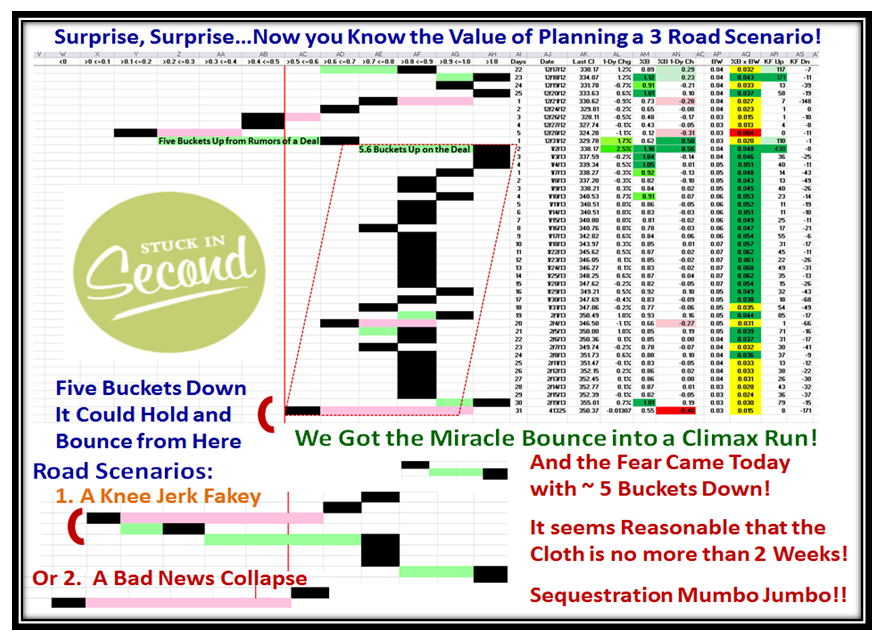
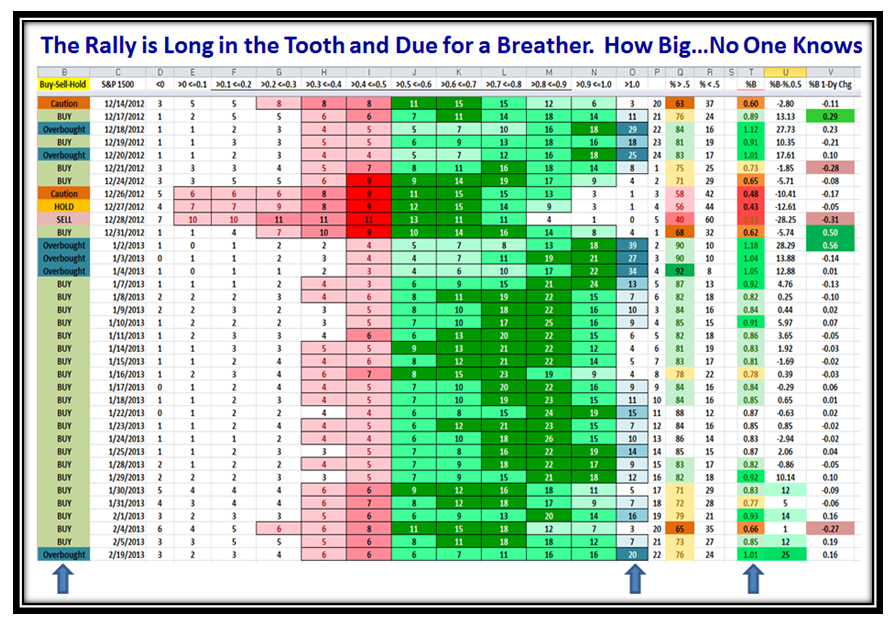
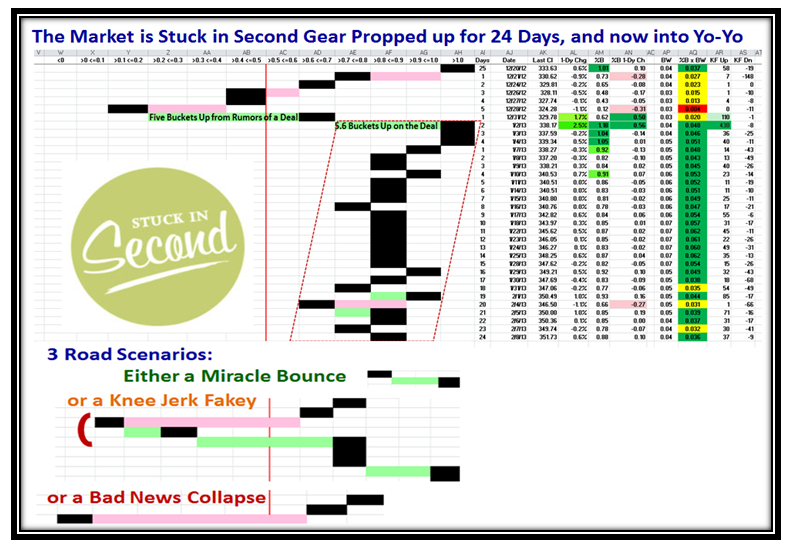
Let’s take a look at the Buckets and as we would expect, the Market is stuck in second gear and has been well propped up for the past 24 trading days which is now getting long in the tooth compared with previous big jumps as posted back at the start of this year as shown on the chart below.  So we wait patiently for one of the three main scenarios to evolve in the fullness of time as I show in this next chart:

Pogo Pat2

I hope that refines the basic concepts I have given you this past month to watch carefully for any signs of a disaster, which is not evident as yet, so keep playing and let the Market tell you which Road it is on!

Best Regards…only 6 weeks to the March Seminar so get cracking and sign up.

Ian.

Copyright © 2007-2010 Ian Woodward
Disclaimer: Commentaries on this Blog are not to be construed as recommendations to buy or sell the market and/or specific securites. The consumer of the information is responsible for their own investment decisions.