Stock Market: Sectors Starting to Droop
It goes without saying that all of us are on our toes watching with our favorite methods of reading the tea leafs for any major sign of a rollover in the Market, but except for a wiggle here and a waggle there, the Market Indexes continue to make new highs albiet at a snail’s pace as I will show you. We need a pogo stick big jump to the upside…hopeful thinking!
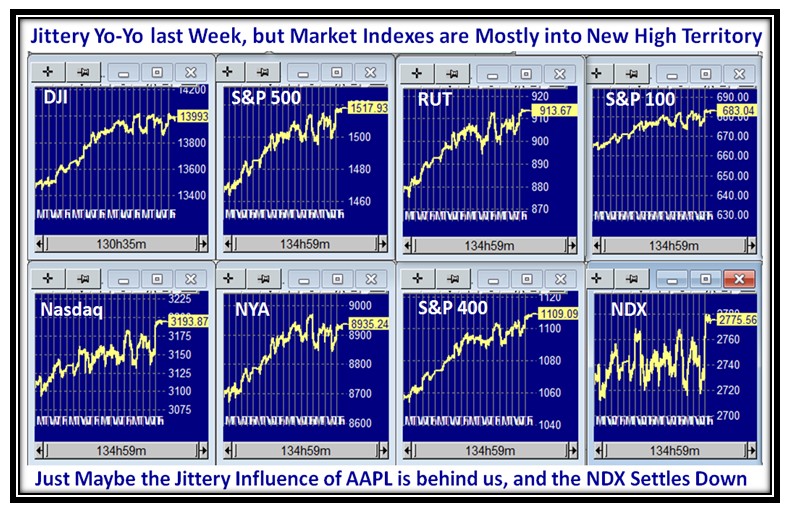
Still, the beat goes on and although the next slide of the Market Indexes shows the Yo-Yo we tolerated this past week , many of these Indexes finished into New High Territory over the past ten days (say). With a glimmer of sunshine on the AAPL front, maybe the worst is behind on the NDX Big Caps Index which stands out as hopping around on a pogo stick:
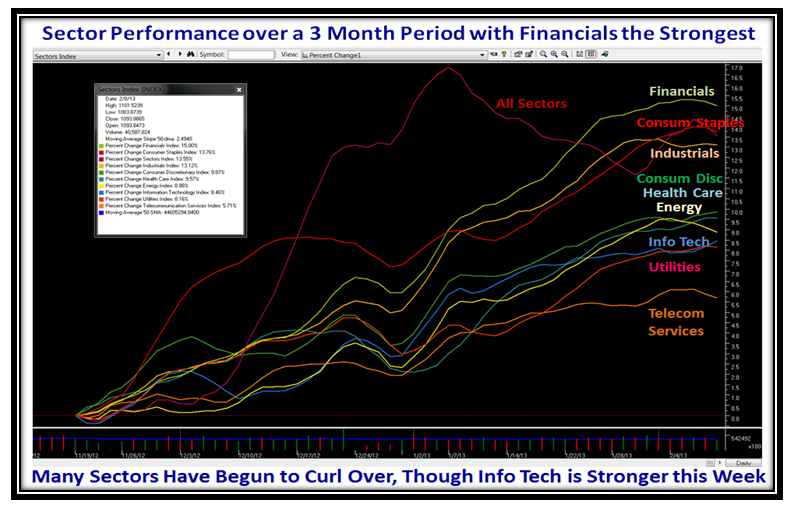
Earl reminded me a couple of weeks ago that the Financial Sector was moving very well, so I felt it was time to show off another powerful feature of the HGSI Software, which shows the % Price Change for the various Sectors below. The picture shows the performance in the last three months, and true to form the Financials are the best. If we want to be real picky, there are the first signs of turning down this past week, but that is not enough to call the top, especially as at least three of the Sectors are still turning upwards, Information Technology, Health Care and Consumer Discretionary.
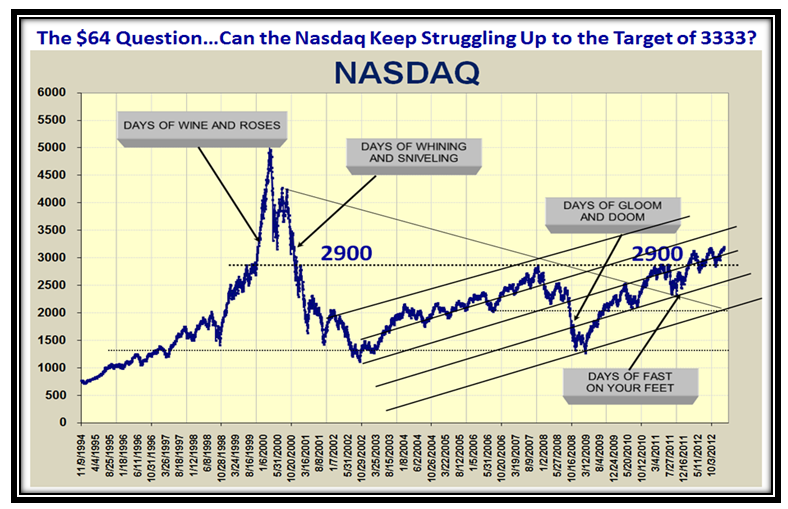
I am still rooting for a move on the Nasdaq to 3333 as I featured in the last two blog notes, and update this information again for your perusal a couple of slides later. Meanwhile the NASDAQ inches up slowly as shown below thanks to my good friend Mike Scott, who has faitfully kept me up to date on his findings for the past 20 Years:
We avidly follow Tom McClellan’s good work, and recently he had a snippet that caught my eye…”Before late 2007, the “9-month cycle had an average period of about 185 trading days. Since then, it has been between 156 and 168 trading days (8 months).” By the way, 185 Trading Days (9 months) equates to Feb 27, and that is mightly close to the next Big Cliff we are headed for relating to Sequestration on March 1, so if the Big Guns decide to prop this Market up until then, that is something to bear in mind.
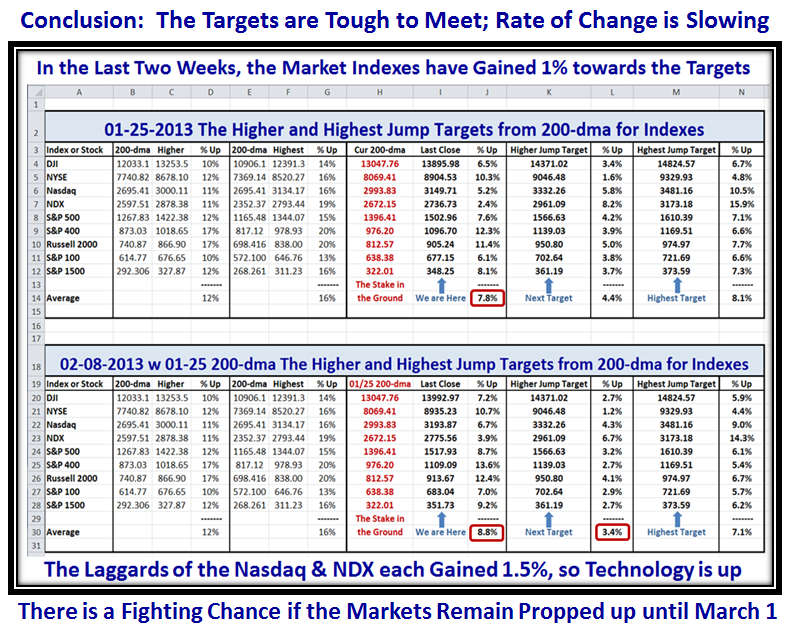
Now we come to the Targets I set on 1/25/2013, and the updated results since then. We have inched up on the Targets to the tune of 1% over two weeks, with 0.8% up the previous week and only 0.2% this past week. We are now only 3.4% away from the Targets for the Higher Jump, but we will need a pogo stick jump up in the Markets if we are to make them within the next three weeks. I call this the High Road Scenario, and sometimes wonders never cease in these tricky times:
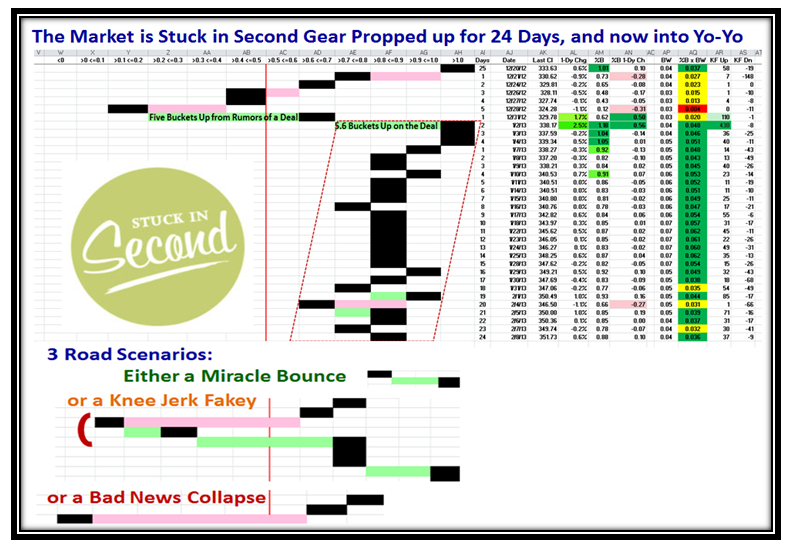
Let’s take a look at the Buckets and as we would expect, the Market is stuck in second gear and has been well propped up for the past 24 trading days which is now getting long in the tooth compared with previous big jumps as posted back at the start of this year as shown on the chart below. So we wait patiently for one of the three main scenarios to evolve in the fullness of time as I show in this next chart:
I hope that refines the basic concepts I have given you this past month to watch carefully for any signs of a disaster, which is not evident as yet, so keep playing and let the Market tell you which Road it is on!
Best Regards…only 6 weeks to the March Seminar so get cracking and sign up.
Ian.
 Ian Woodward's Investing Blog