 Ian Woodward's Investing Blog
Stock Market: Hindenburg Omen or Not?!
My blog is buzzing with hits looking for fresh news of a supposed sighting of the Hindenburg Omen on May 29th, and I will have more to say on that at the end of this note. However, for those who wish to see what I had to say on the last Blog note on this subject please try my August 12th, 2010 Blog Note together with the 5 responses at the bottom, where it turned out I was right when I headed it “The Hindenburg Omen did not Volley and Thunder”. Select the Date from the Archives on the Right of the Opening page and scroll down to the item. Also, if you are interested more deeply in the subject, please see:
1. The Hindenburg Omen Signals between 2005 and 2007, written on November 6, 2007, which is also featured in Wikipedia and is the first item under “External Links” at the bottom of their write up.
2. The Hindenburg Omen, written on September 30th, 2007 and
3. The Hindenburg Omen Triggered Tonight written on Monday, October 15th, 2007
Sad to say we are back to “Wibbly Wobbly” times which you are now familiar with:

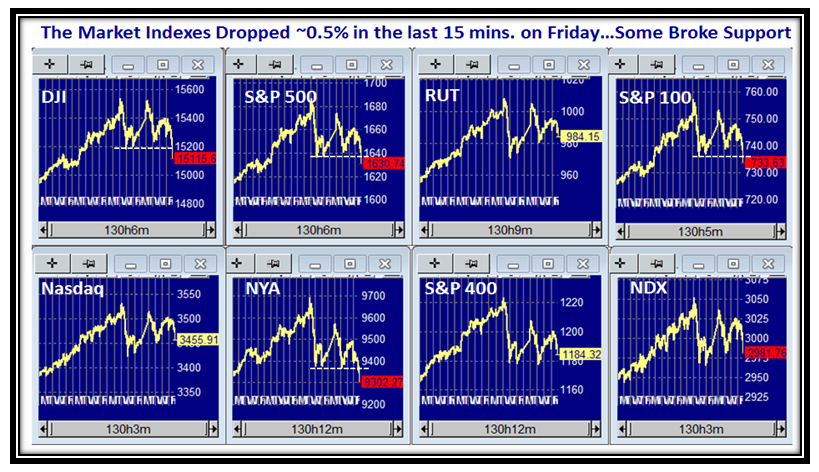
Here is the evidence where the Market Indexes have yo-yoed up and down these past seven trading days with four of them breaking below support as shown. Worse yet, the last 15 minutes saw a major run for the exits:
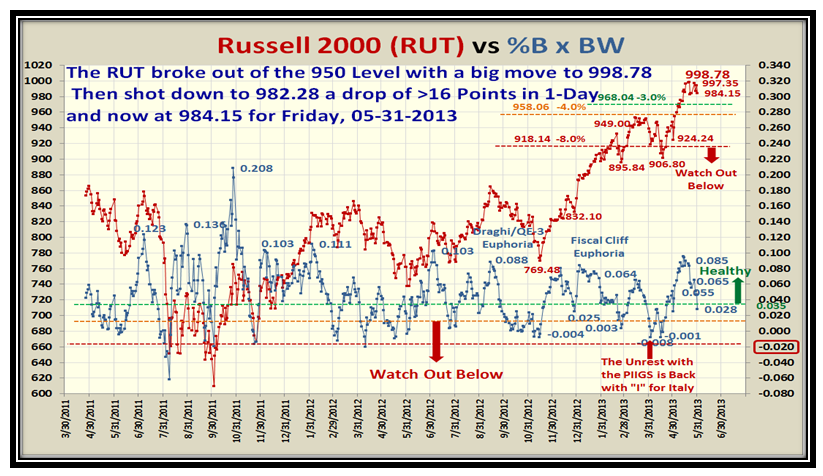
The Russell 2000 is also showing weakness, but let’s put this in perspective as it is only down -2.4% from the high:
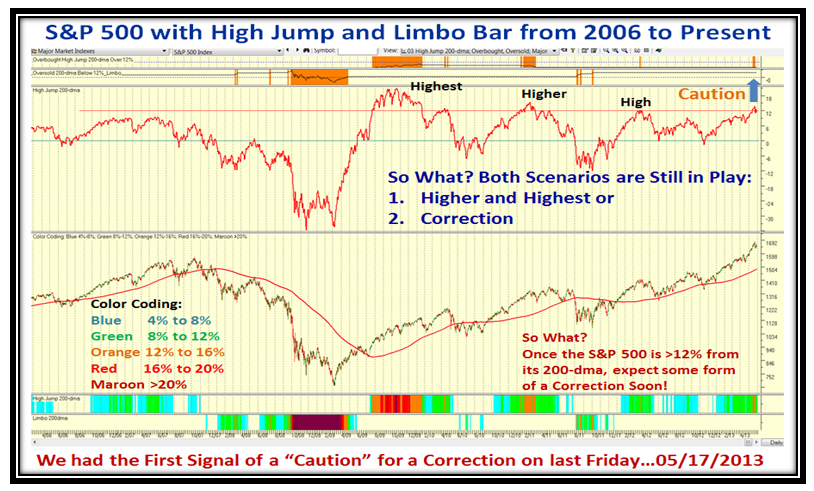
The High Jump for the S&P 500 signaled a “Caution” two weeks ago when it reached 12% up from the 200-dma, which suggests a Correction of some form was due soon. However, Both Bull and Bear Scenarios are still in play at this stage since the S&P is only down -3.3% from its high posted on that blow off day on 5/22/2013:
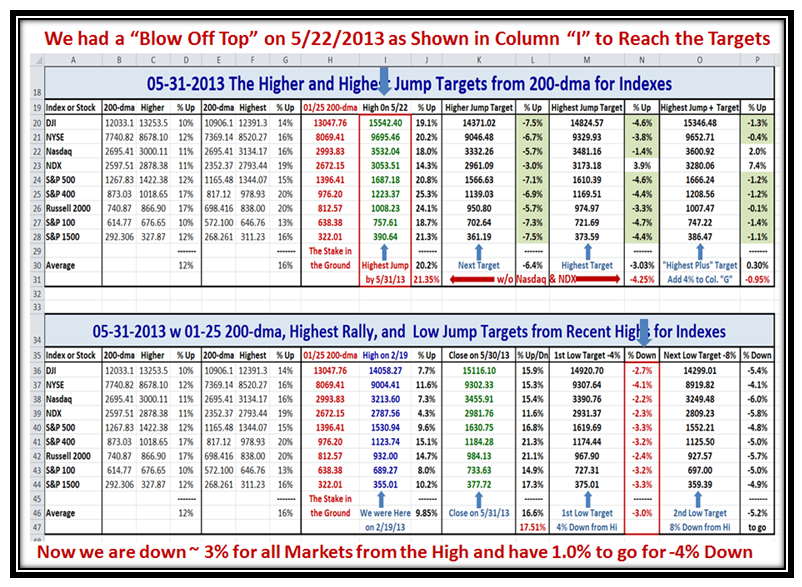
Here is our favorite spreadsheet which after featuring it for four months has shown that the RIGHT strategy is to increase the High Jump Targets for Market Indexes in 4% increments to keep us on the right side of the Market. Please note the two blue arrows which show the Highest reached for the Indexes and the % Down since then:
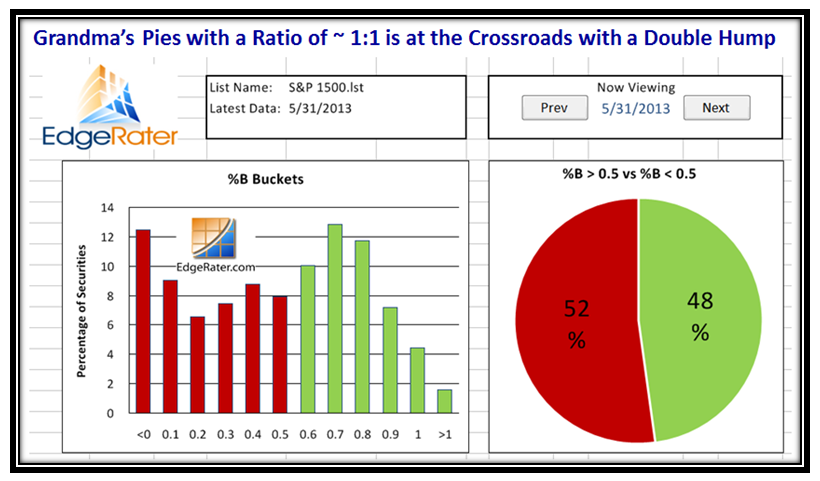
Turning our attention to the underlying texture of the S&P 1500 Market Index, here is Grandma’s Pies which now at worst is “soggy” with a double humped camel look:
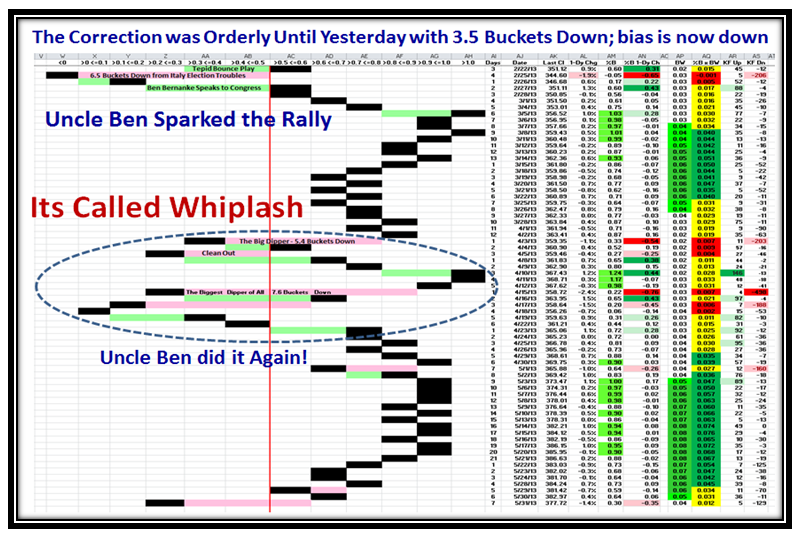
…And now for our favorite view which shows that infamous 3&1/2 buckets down which immediately says the bias is downwards no matter what the Bulls say and one had better take good note of the action early next week:
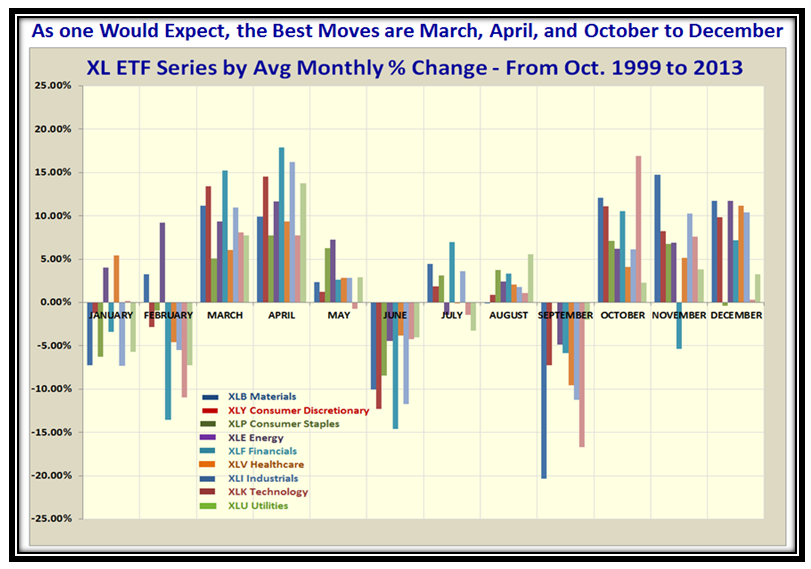
Here is something new for you to stare at…it’s the XL Series Sector ETFs month by month over the past 14 years, which Bob Meagher has helped me pull together.
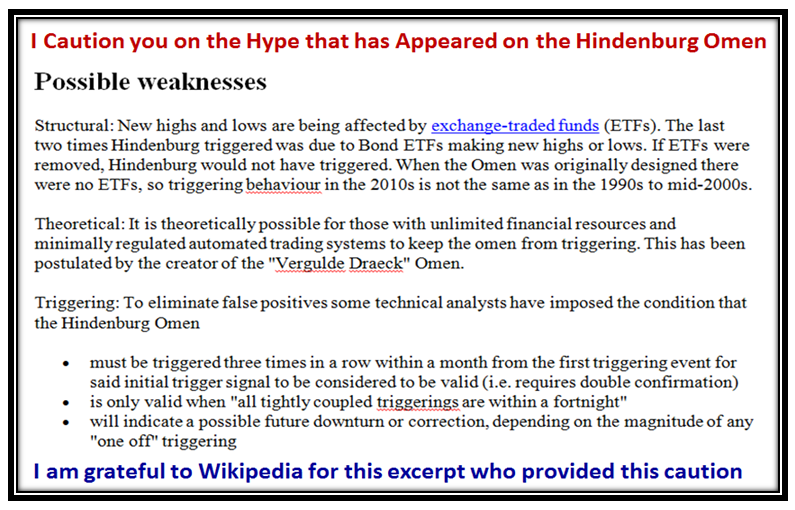
Now as promised let me turn my attention to the latest hub-bub on the Hindenburg Omen (HO). As we know these occur very infrequently, but when they do in succession it has always indicated a correction to come and certainly when it appeared with such frequency as I showed back in 2007 they are invariably big. Unfortunately, times have changed as the years have passed and the biggest change which throws the HO into a tizzy of not being as dependable is the advent of the ETFs since that great analyst Jim Miekka devised the criteria to ensure it was a very infrequent and reliable occasion. The database used these days is so different, and certainly there have been changes suggested that hopefully keep things in balance, but its reliability is suspect. So much so, that I offer you an excerpt that Wikepedia has included to put this in perspective:
As always, there are two schools of thought…Bulls and Bears. There is no question that this move since November 19, 2012 has been remarkable and is my Stake in the Ground for the Base Low for this 6&1/2 month period we are in, which is long in the tooth. Of course the high jump work that Bob Meagher and I have recently done also points to a “Caution” of us being on a correction signal. The problem we face is twofold:
1. Overbought can get more overbought and go higher ala 1995 with minor corrections as I have said before and
2. Gloom and Doom sets in and the nay-sayers are quick to talk in terms of “Crash” rather than a Correction. This is particularly true when the “Shorts” are frustrated and are repeatedly having to cover and try again.
With this dilemma in mind, and in recent work with Bob, I have confirmed my original strategy to work the problem in steps of 4% at a time. By that I mean each High Jump and Low Jump (Limbo Bar Target) must be 4% higher or lower at a time, with worse than 12% either up or down for Danger Signals either way.
That is why you see my spreadsheet that I put on the blog is in 4% steps for High, Higher and Highest Targets. Likewise, now that we are in “ozone territory” I am now emphasizing the Low and Lower targets of -4% and then -8% from the Recent High. This way I let the Market tell me what it is doing rather than anticipate the moves too soon. By all means set targets as you know I always do for High, Higher and Highest, but then let the evidence unfold to confirm the direction and your stomach guide you as to when to pull the trigger. This is nothing new as you have been with me for over 20 years and recall the 4% steps I always use:
Minor Correction…8 to 12%
Intermediate Correction…12 to 16%
Major Correction…16% to 20%
Bear Market…>20%
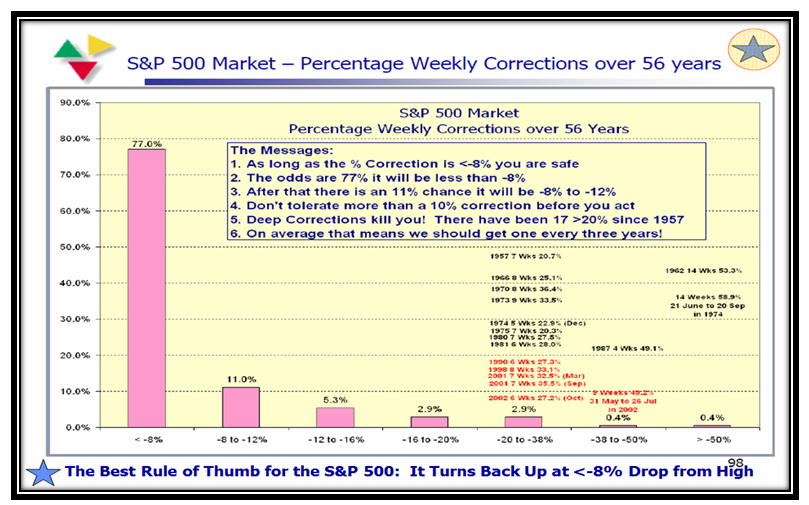
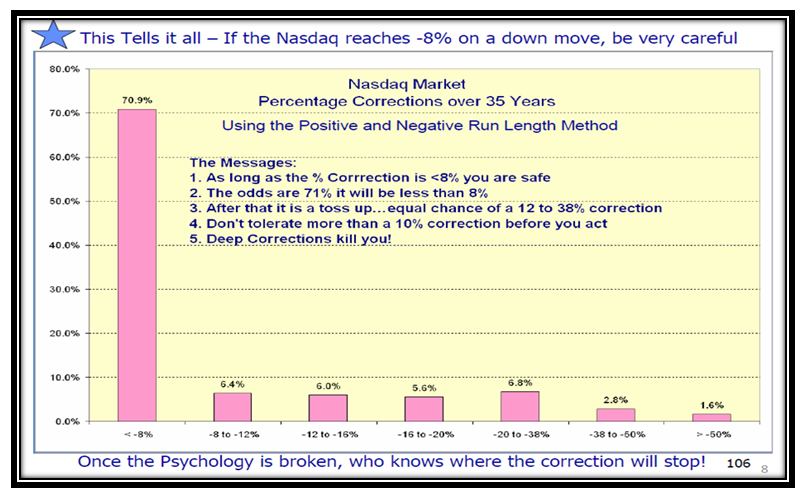
However, this very unusual market has re-emphasized that these rules of thumb are golden and the High Jump has solidified all of this yet again. You also understand that the odds that a Correction of less than -8% is 77% and 71% is in our favor that it will turn back upwards for the S&P 500 and Nasdaq, respectively. Anything worse than that can land anywhere, so be careful. I leave you with the important charts for the S&P 500 and Nasdaq which support the concept that the odds are in the Bulls favor up to -8% from the high. After that heaven help you. I am not suggesting one waits till we are 8% down, but once the floodgates open you know your nest egg will be hit the way it was in 1987, 2000 to 2002 and the worst one of all in 2008, so do something!
Now you know all I know and hopefully we will be sitting in a better position this time next week.
Best Regards,
Ian.
