Ian Woodward's Investing Blog
Stock Market: Happy Thanksgiving!
Saturday, November 23rd, 2013We have a lot to be thankful for despite the difficult market that keeps confounding the gurus as they try to call the top in this overbought market. We are only a week away from the start of the Santa Claus Rally and there are still few signs of a breakdown except for the Canaries which are long in the tooth and taking a breather.

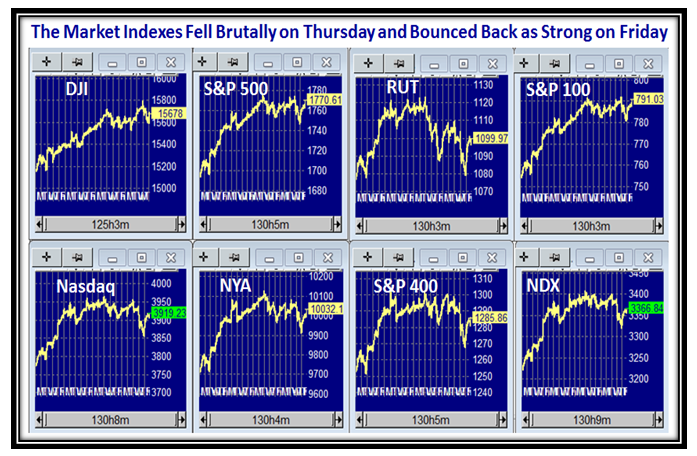
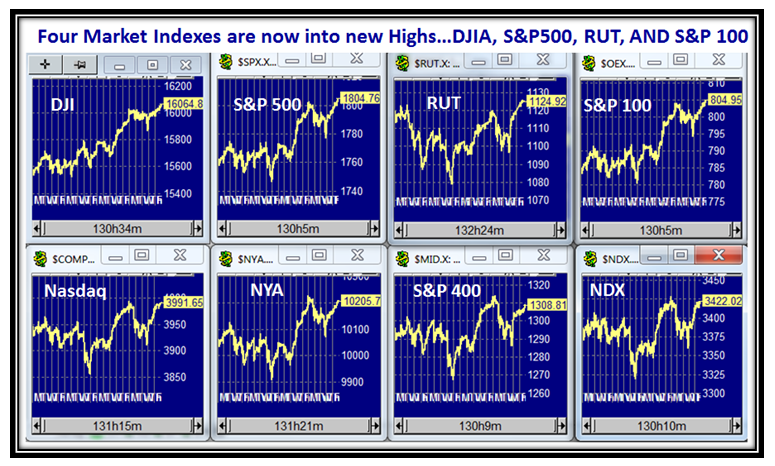
The long march upwards continues with four of the eight Market Indexes into new high territory this week:
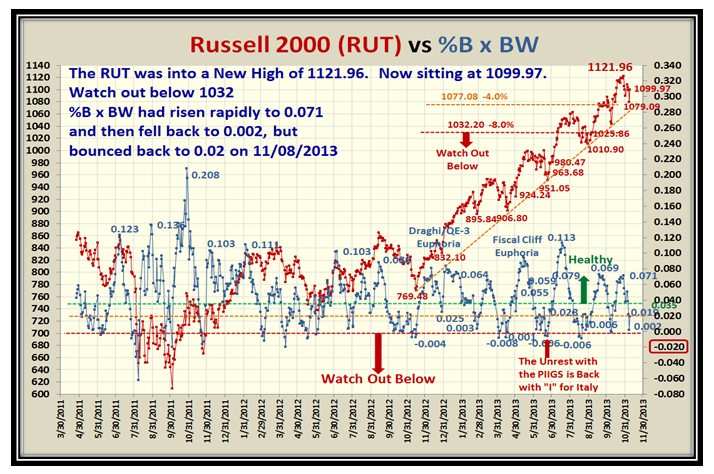
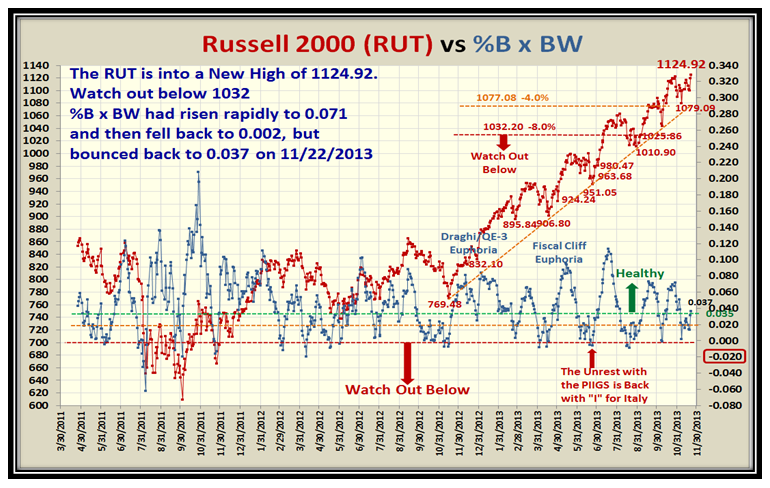
The Russell 2000 (RUT) is back in high gear and into new high territory as the small cap stocks take command once again:
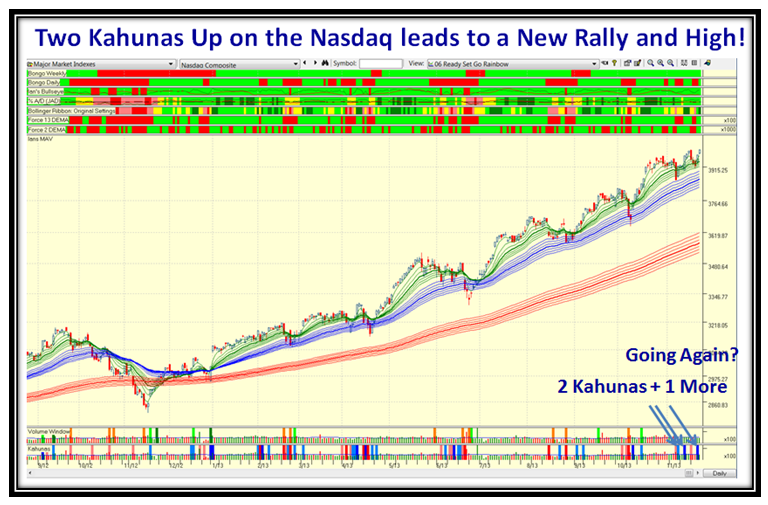
In the past three weeks since the October Seminar, although there have been Knee Jerks, the Markets and the JIRM Index show that at this point in time there are no signs that the big guns want to throw in the towel and take this Market down:
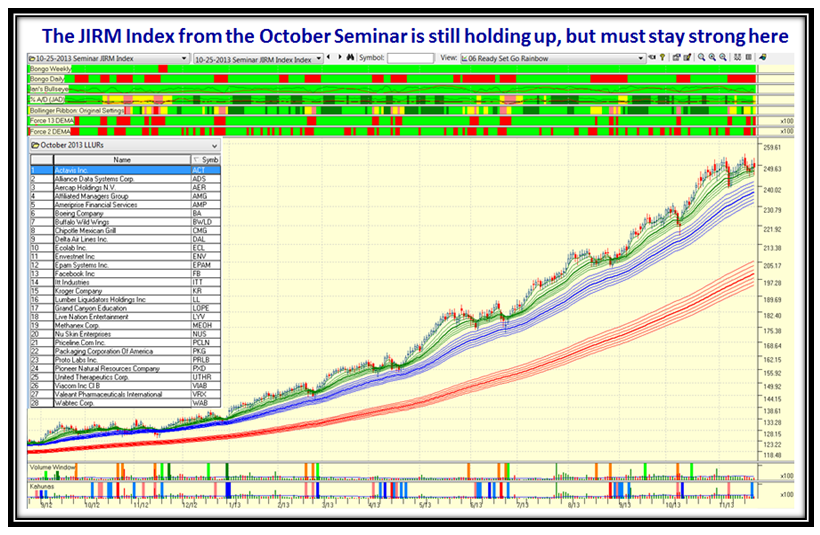
…And here is the JIRM Index which again is still holding up, but must continue strong here to avoid a triple top. Please note that the clusters around the 17-dma (green) have NOT collapsed, which is a good sign as it too reaches into New High Territory:
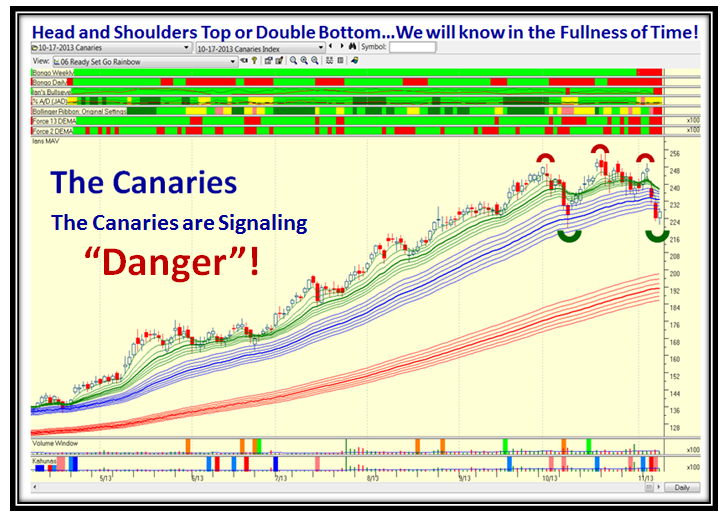
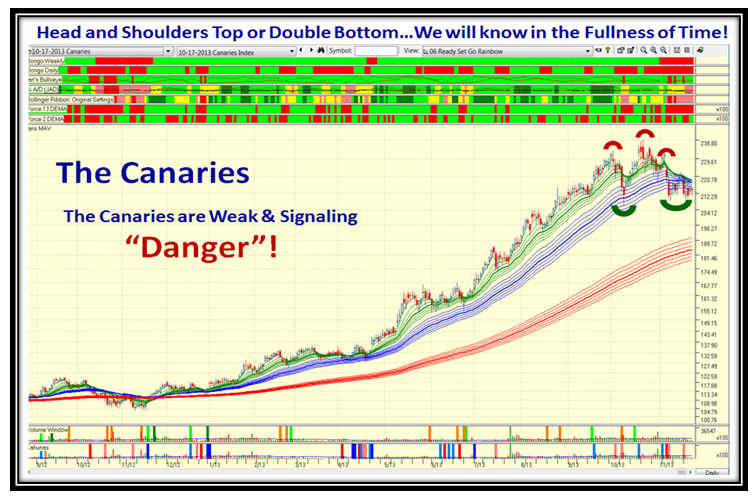
The Canaries are suggesting Danger ahead, but these have had a very long and envious run so it is to be expected that there would be profit taking, and these have fulfilled their role for us in being the first to signal a correction may be at hand. Note the value of the Rainbow charts which quickly show that when a cluster around the 17-dma eats into the 50-dma cluster we have fair warning that a potential big fall is about to happen.
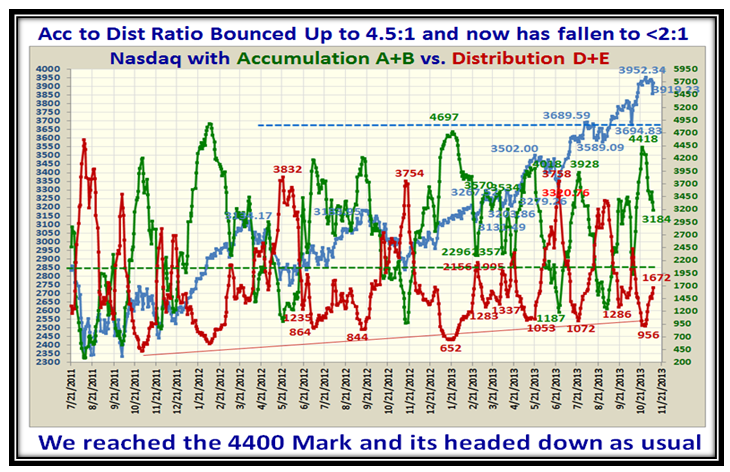
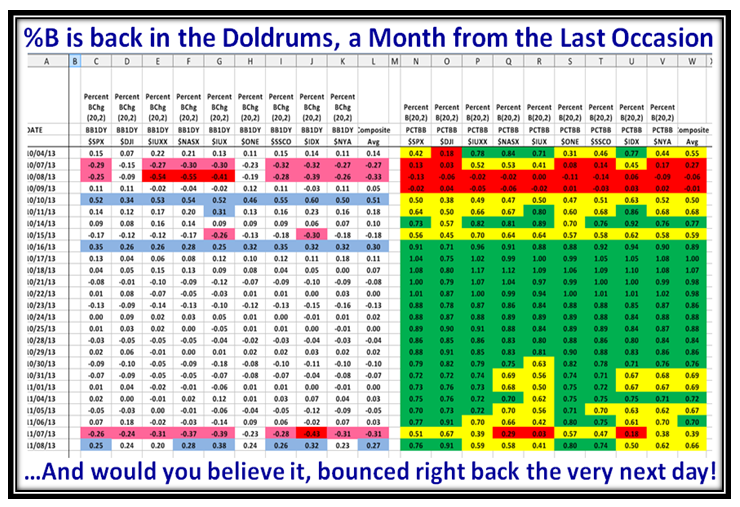
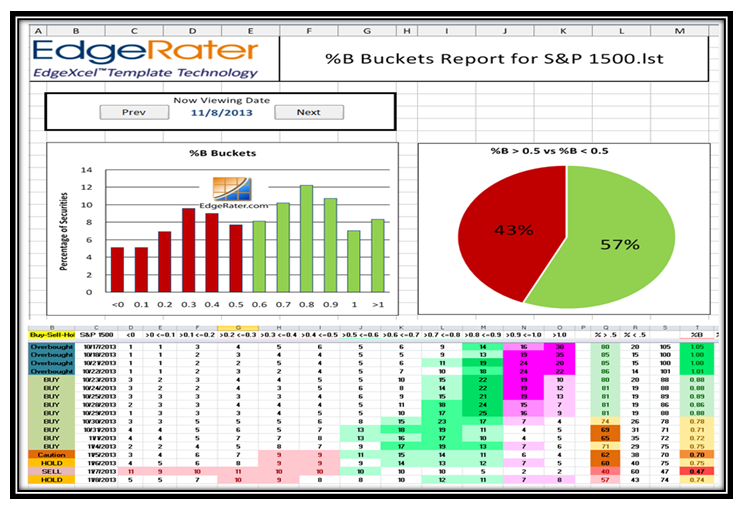
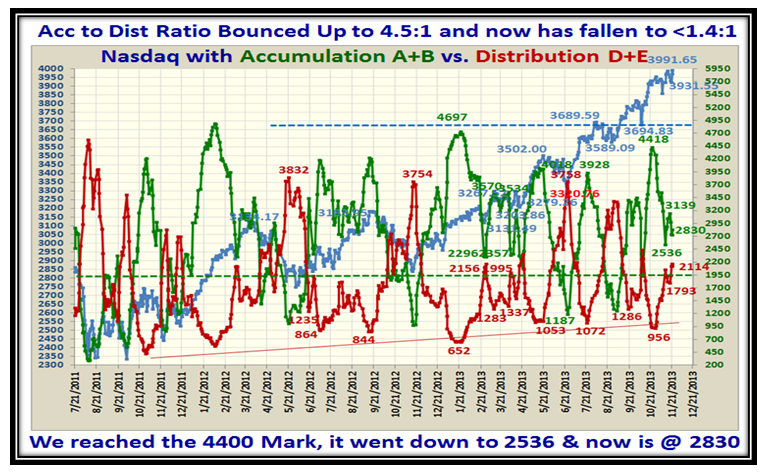
Now for a look at the Internals with regard to the abcde’s…the accumulation of A+B vs. D+E. Having hit a high of 4418 three weeks ago we are back in the doldrums and heading for stalemate with a ratio of 1.4:1:
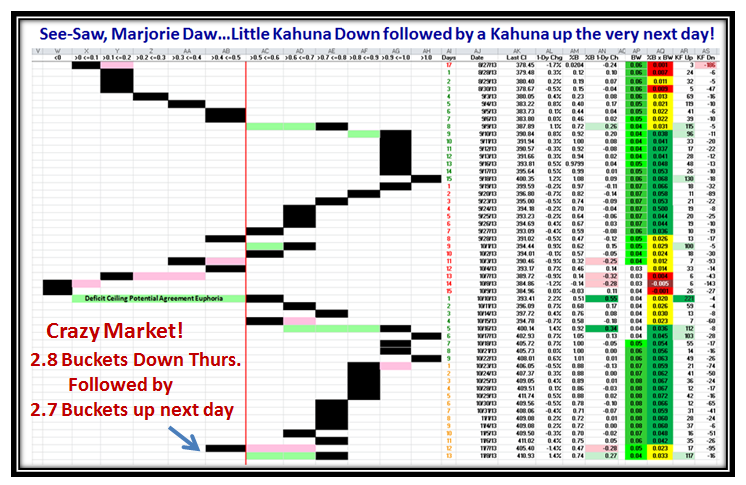
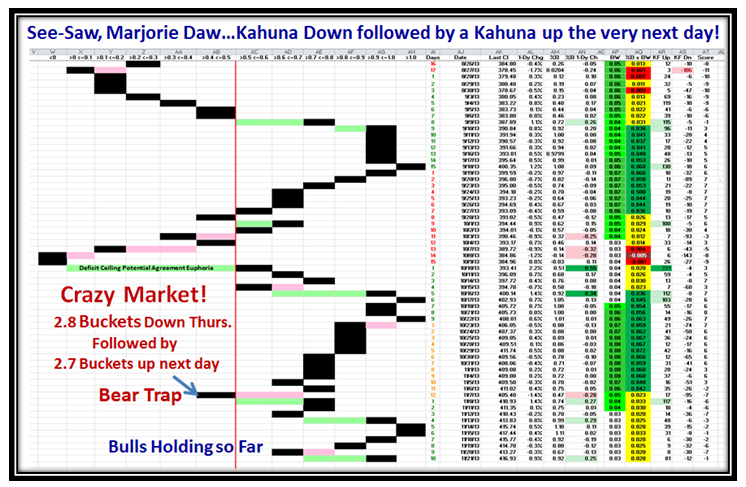
It goes without saying that the opportunities are primarily very short term…quick be nimble and nimble be quick action:
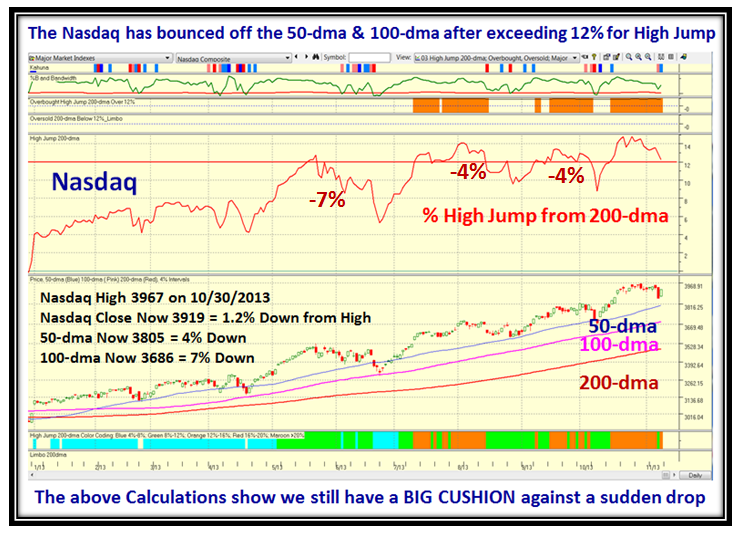
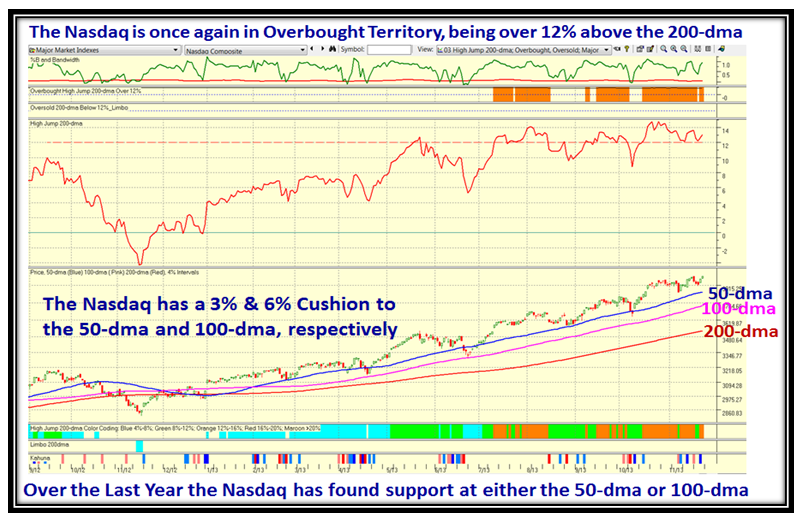
…And now for the So What? Despite all the fru-frau of overbought and very extended, the NASDAQ has a BIG CUSHION before major damage can be done. Unless we have a huge knee jerk down, we should have plenty of warning that a major correction of 12% or more is underway.
Have a Happy Thanksgiving to you all!
Regards,
Ian.