 Ian Woodward's Investing Blog
Stock Market: The Hindenburg Omen Strikes Again!
This past week has provided a good deal of information and insight regarding the overall direction of the Market. It trotted down for most of the past week, and it appeared the Grinch was making an early appearance. However all of that was brushed aside with the strong up-day on Friday which was triggered by the Jobs Report. Everyone is measuring and interpreting every bit of information as to when the bough will break, but as yet nothing is broken and we trundle on. To add to the excitement, the Hindenburg Omen has poked its head out again!
I will address three important themes in this blog note:
1. The perspective on the Jobs Report
2. The Market Indexes, Hindenburg Omen, and Market Internals
3. A follow up perspective on the behavior of the S&P 500 based on the past 25 years performance
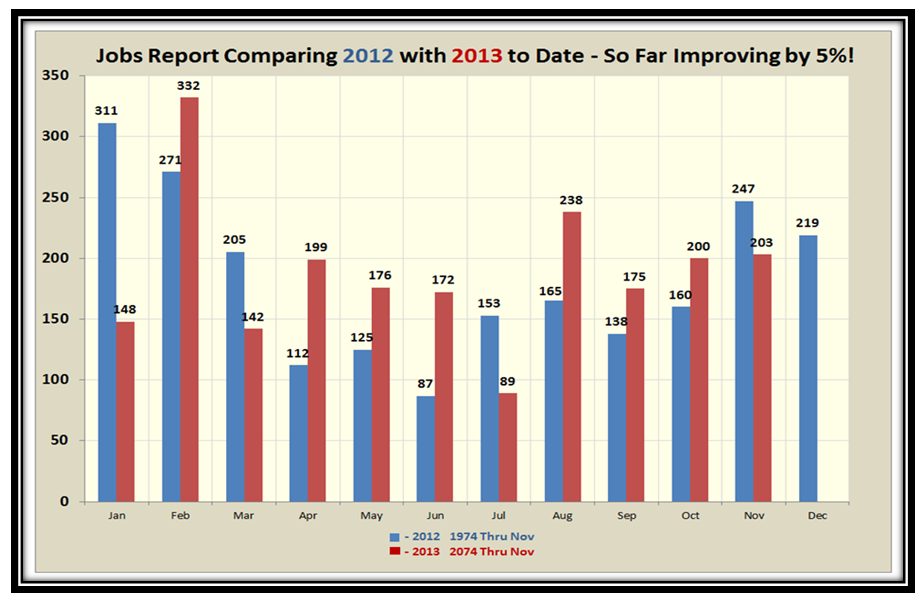
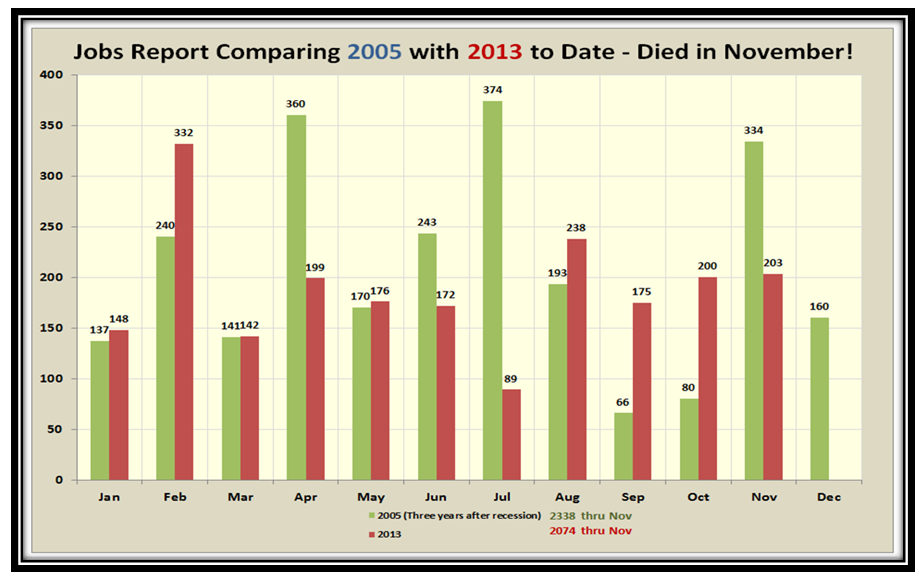
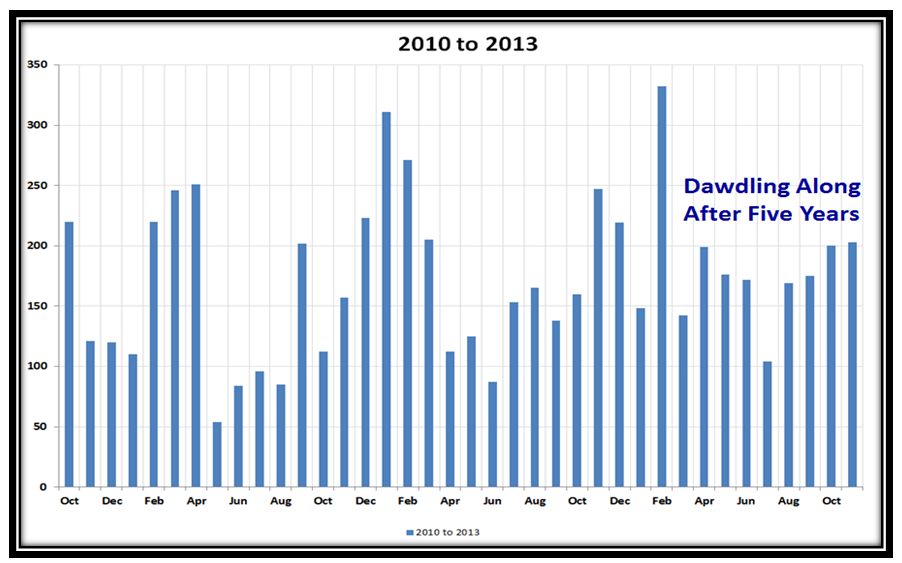
Here is an update on the Jobs Report Statistics, where I relate the latest numbers to the previous benchmarks I have used for 2005 and 2012 in past blog notes. Net-net, the So What is this latest November report was not anything to get excited about in terms of the long term improvement in the economy. However, mediocrity at this stage is interpreted as good as it will not cause the FED to take action in increasing Interest Rates, but not that bad for them to throw more Q-E money into the pot. Go figure, but that’s what helped stave the Grinch from doing more damage at least for this week. You judge for yourself…but our nest eggs accept any gifts!
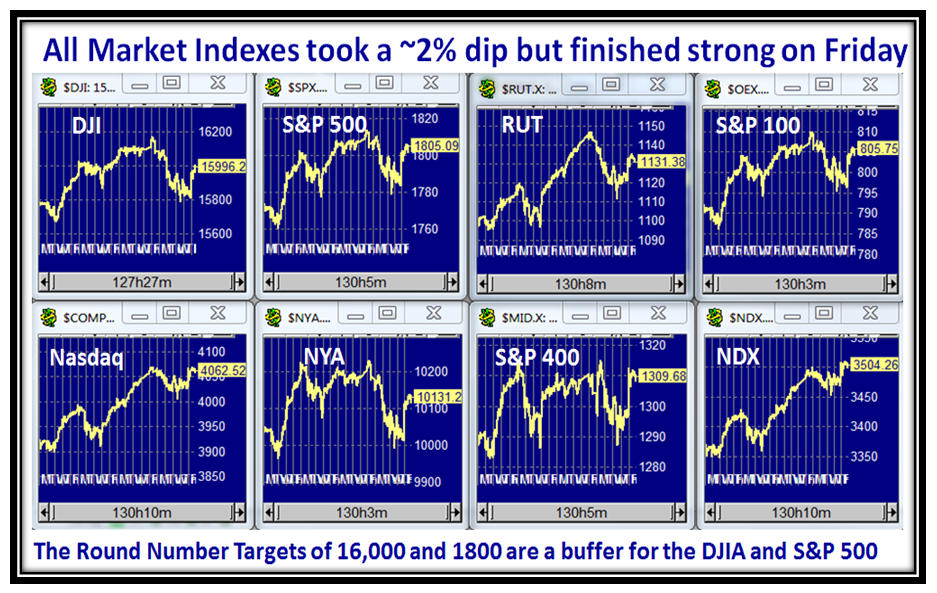
The Market Indexes charts show the 2% to 3% drop followed by a strong rebound on Friday:
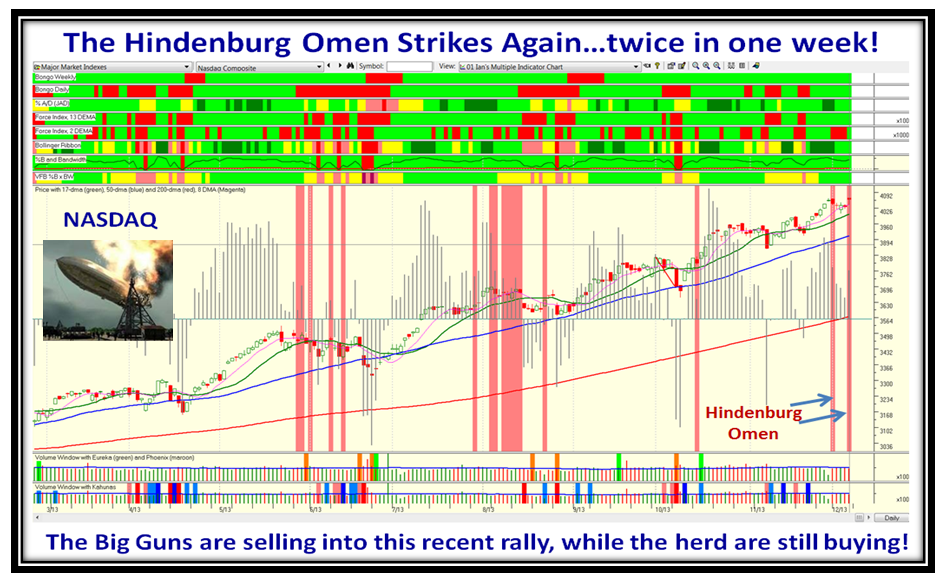
Beware of the Hindenburg Omen which has poked its ugly head up again:
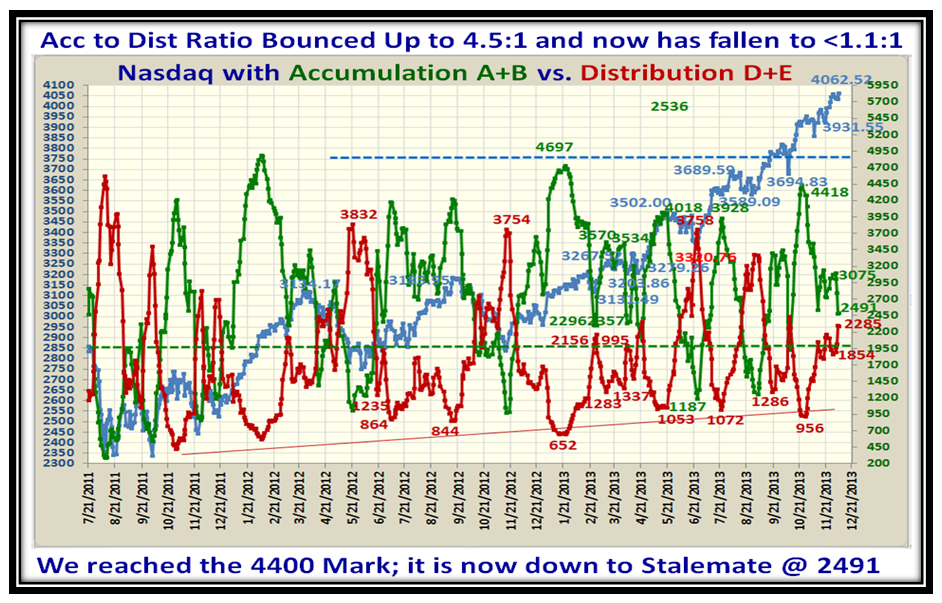
The Acc:Dist Ratio has gone to pot and is at stalemate at the moment, another warning sign:
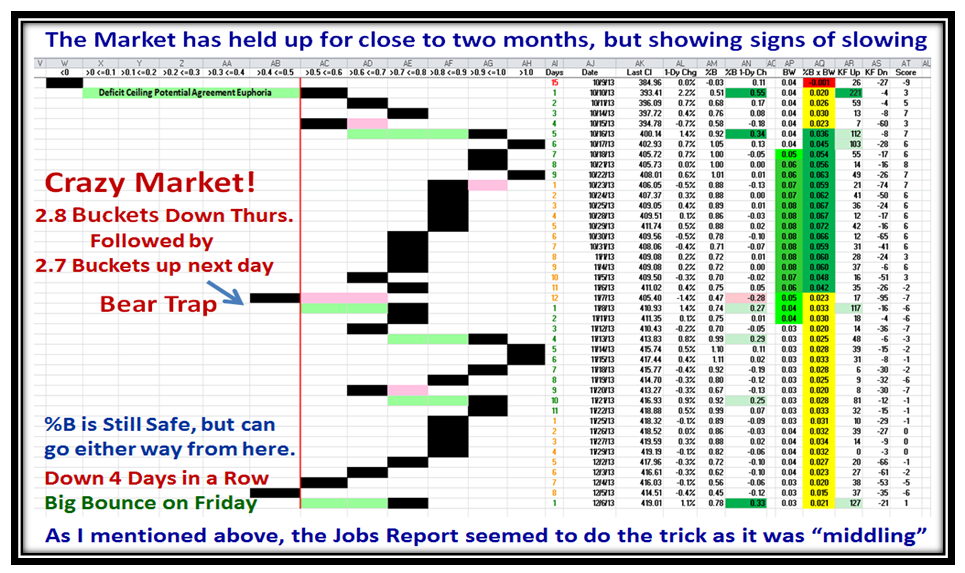
Friday came to the rescue with a 3.3 Buckets up day to keep the Rally alive:
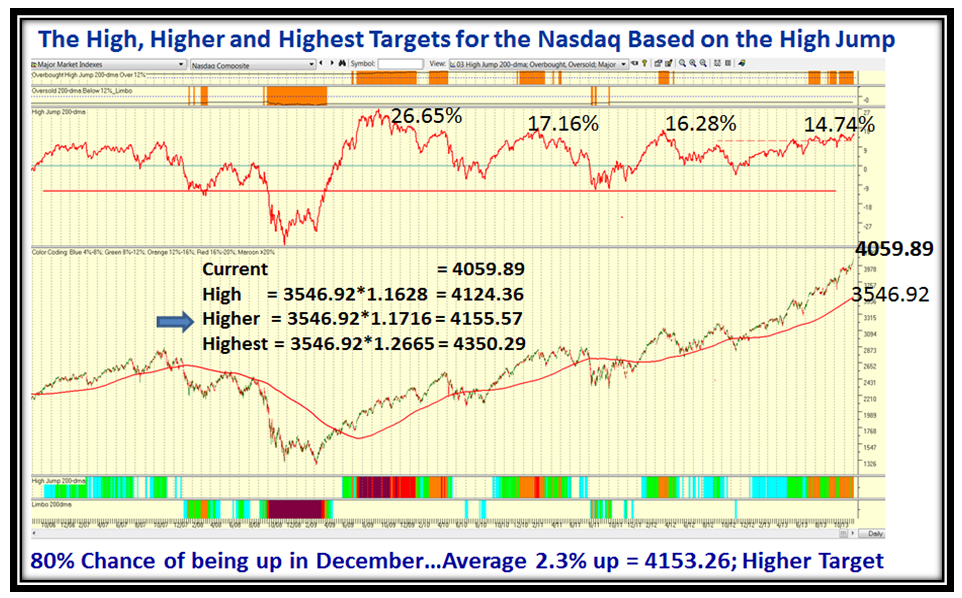
Here is a Repeat chart to remind you of where the High, Higher and Highest Targets are for the High Jump:
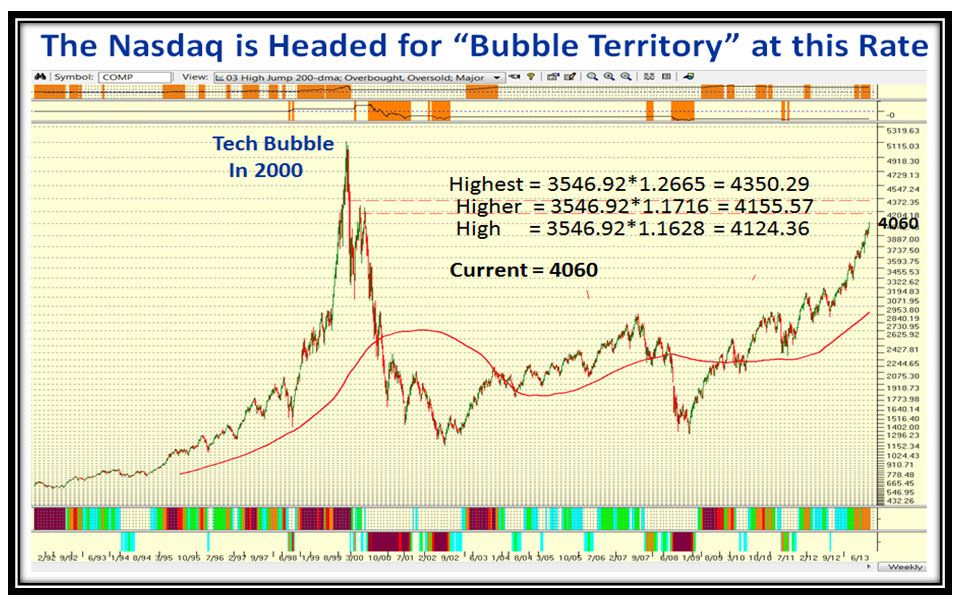
…And here is the longer term picture:
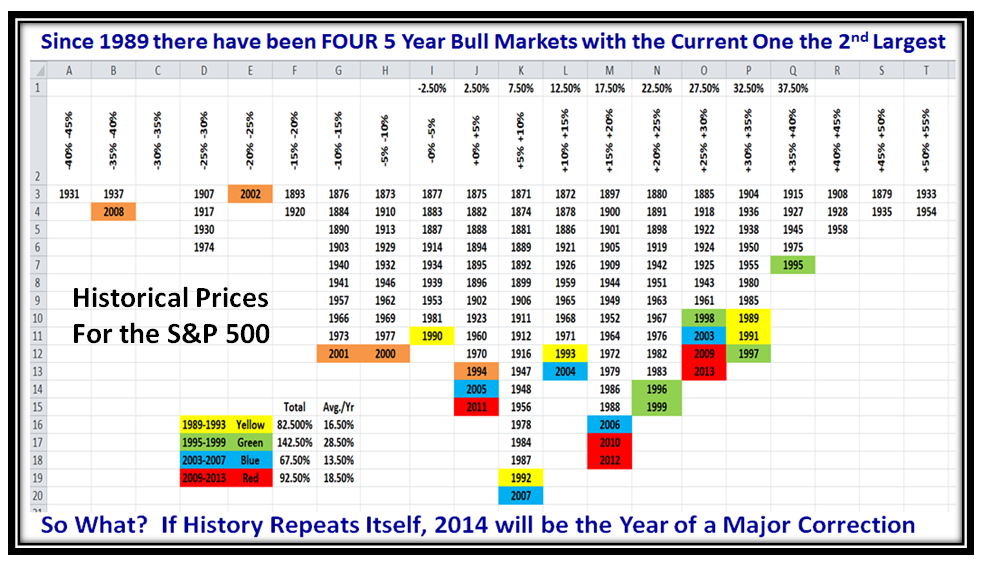
Here is an updated picture of the one I left you with to ponder over the S&P 500 Historical Prices and I have been able to milk blood out of a stone to show that for the past 25 years we have been in Rally mode for 5 years at a time. This latest rally is the 2nd largest of the four I show below:
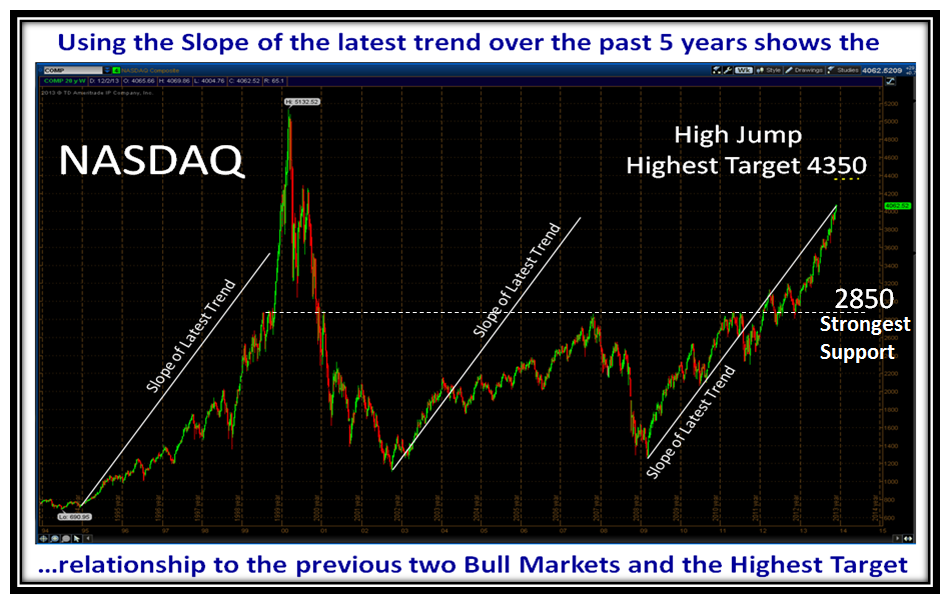
…And this chart with the help of my good friend Bob Meagher ties it all together for where we stand:
Enjoy, and Best Regards,
Ian.
