 Ian Woodward's Investing Blog
The Rickety-Rackety Bridge to Nowhere
Yes, I am back and thank you for your patience. As most of you know and been through it, I have had a harrowing time getting my Computer working again sufficient for me to give you most of the charts we like to analyze in these blog notes.
The last two days have established that the Small Caps are on the brink of giving up the ghost or are so oversold we should see a bounce play, and the Large Caps have at least given up substantial gains to cause the Markets to be in Oversold Territory. Hence we have a Rickety-Rackety Market:

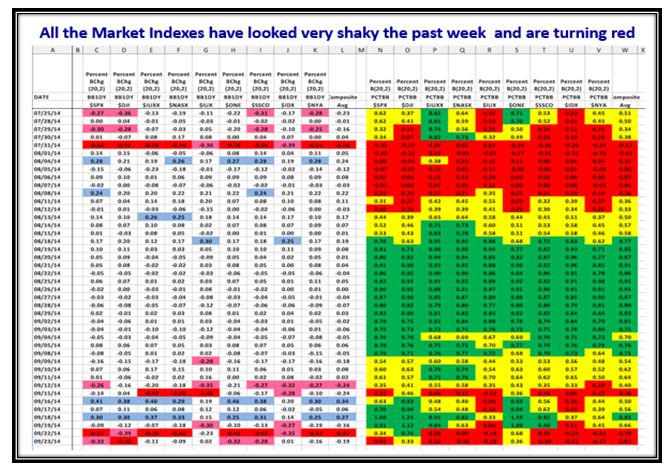
Here is the Chart of the Indexes that proves this market is all over the place, and just had a False Breakout:
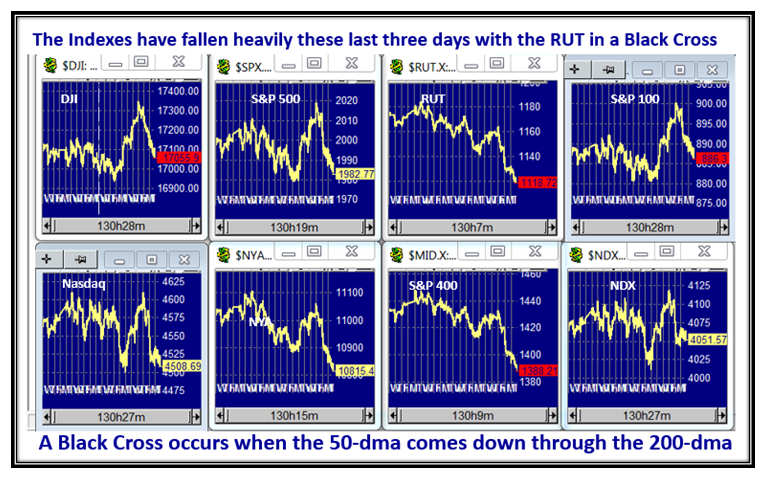
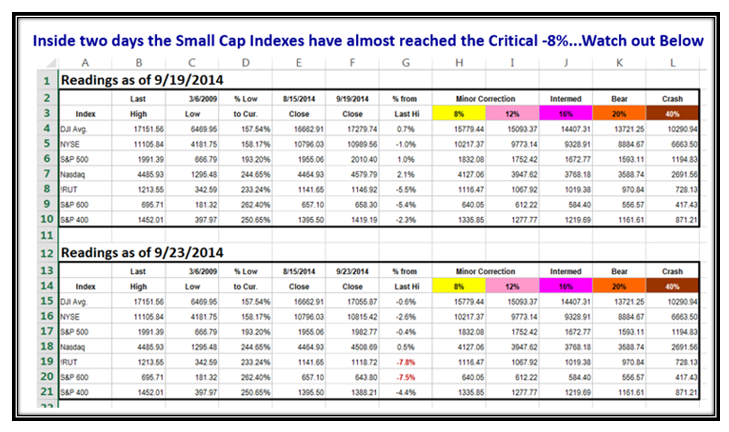
We are nip and tuck as to whether we are oversold and will find support here or there is more downside to come. If you compare the two charts in the next picture you will quickly see that inside two days we are now at a critical point, especially with the Small Caps:
Just look at the action in the last two days and it says it all. 6.2 Buckets down is not to be brushed aside with 9.0 buckets in all in two days:
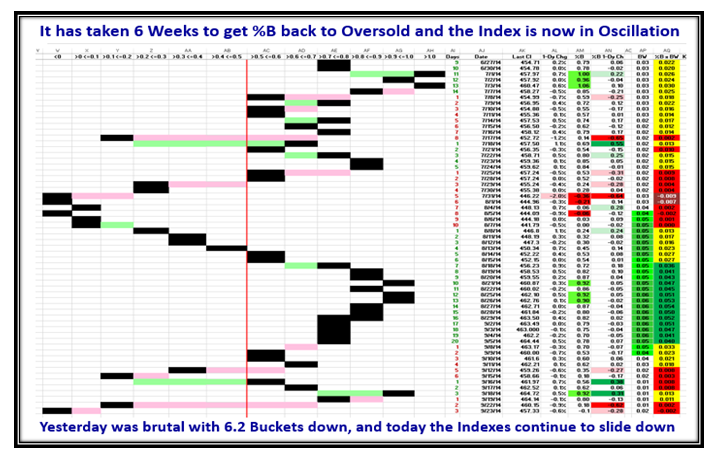
Yes, we are Oversold, but I have seen numbers far worse than this so there is still room on the downside. However a Bounce Play is on soon:
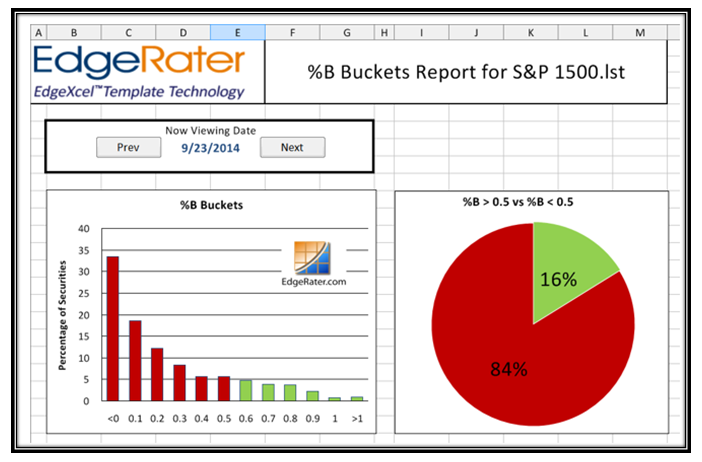
The Market Indexes have taken a turn for the worse, and are getting oversold as shown by the red on the chart:
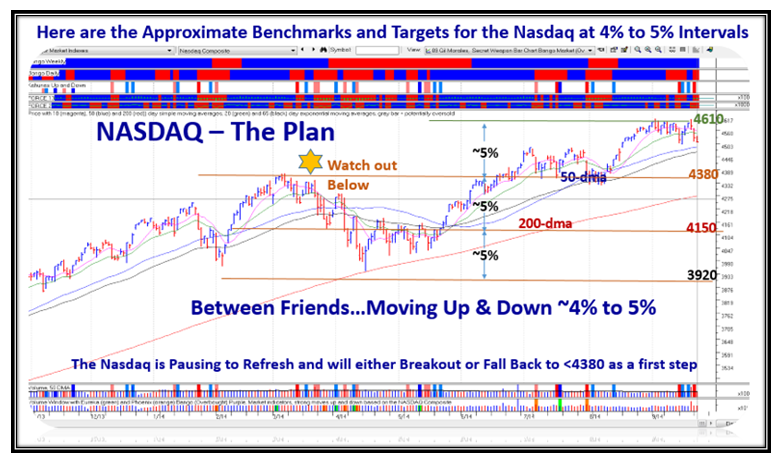
And Finally here is an overall Plan that sums up what the Market is telling us. Watch that 4380 level carefully:
Best Regards,
Ian.
