Benchmarking Fear and Greed in Bull & Bear Markets
Anindo asks an interesting question to compare Corrections in Bull and Bear Market Rallies:
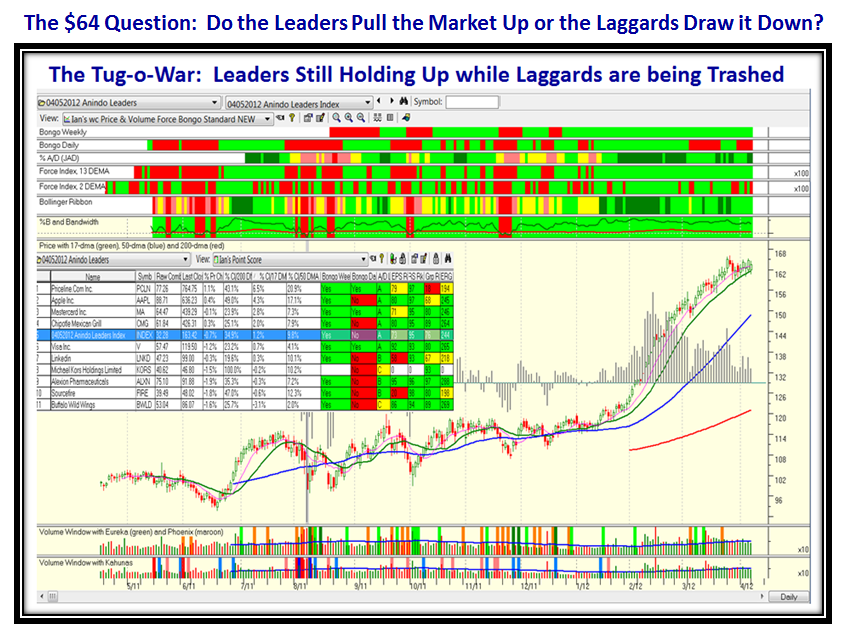
Thanks for a timely blog Ian. I note that %B < .5 is now 60 %. Is there a difference in how high %B < .5 gets in a bear market in 2011 vs a 5 to 8 % correction in a bull market that we saw in 2009. The action in the leaders like AAPL, PCLN, MA, V, KORS, FIRE, CMG, ALXN, BWLD, LNKD all indicate a healthy market.
That may change on Monday as S&P futures are down 16.75 to 1373.5.
Thanks, Anindo
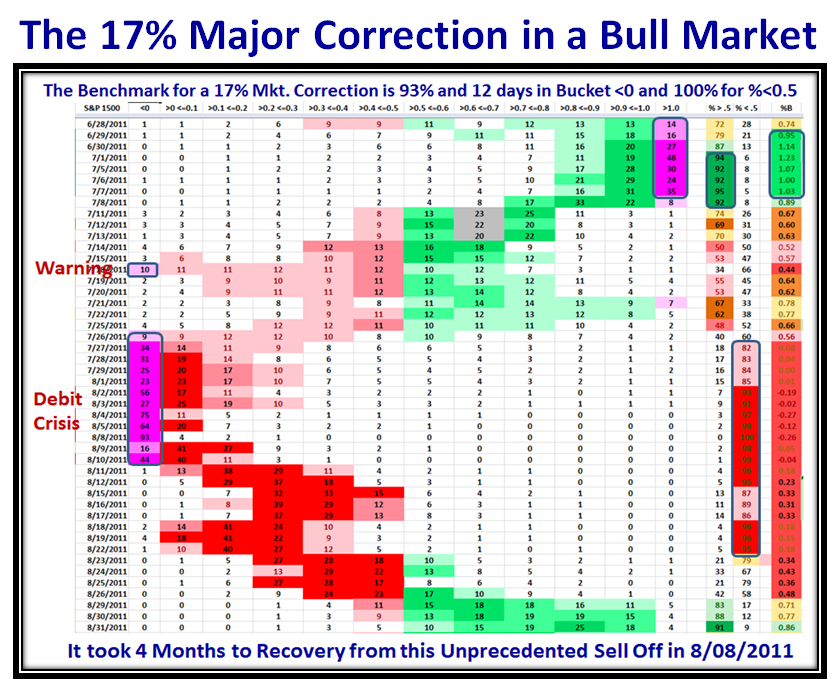
I had to dig back into the archives to give you a cogent answer. I have used two Benchmarks to give you a good feel for the comparison for Minor and Major Corrections in Bull and Bear Markets. I used October 2009 and August 2011 (Debt Crisis) for 7% and 17% Corrections, respectively. There is a lot of information on the charts which I have “ringed”, but let me get you to the Bottom Line Message before I unfold the nitty-gritty grimbling:
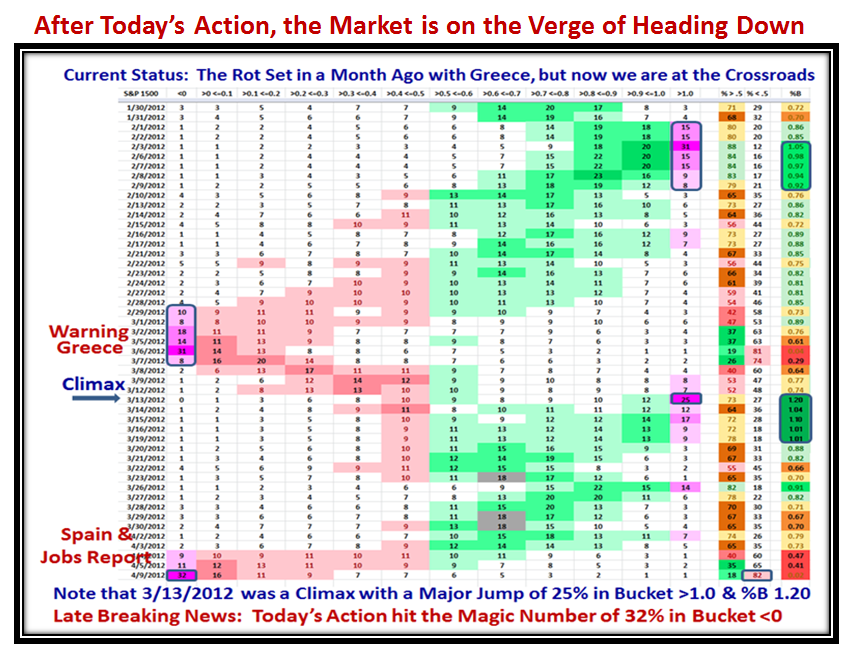
If %B in Bucket <0 exceeds 32% (~1/3rd of the S&P 1500 stocks), we are in for more than a Minor Correction. Let’s see what transpires from here. It will be particularly interesting as this is the first time in recent memory that we have so many LLUR’s (Lower Left to Upper Right) tight chart patterns still holding up that it will be a major tug-o-war between these and the others that have already been hit, which could determine which group wins out. Late Breaking News says we hit 32% on the button today, so it makes this review very timely as the next few days will determine if the Market will hold or the floodgates open. I have summarized the key statistics over the last three years and provided you with enough detail to understand the process I have used.
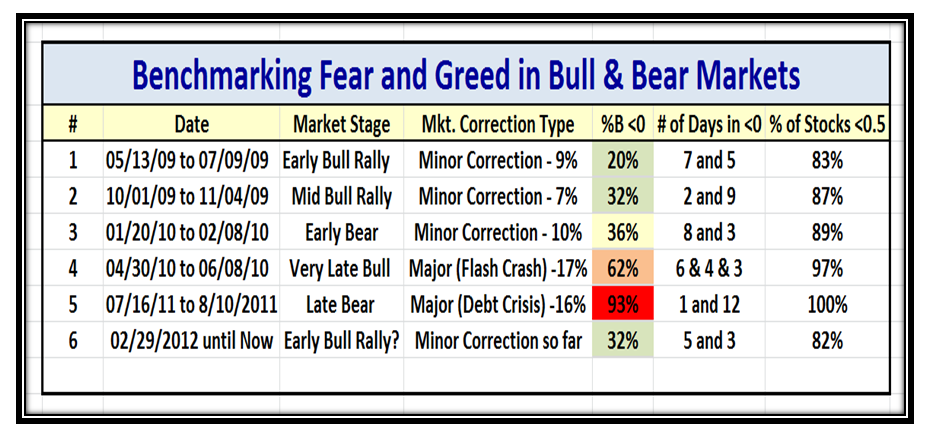
The above chart shows that in Minor Corrections the magic number for %B <0, i.e., below the Lower Bollinger Band for the S&P 1500 stocks is 32% or about 1/3rd of the total number of stocks. Also note that the % of stocks <0.5 must not be higher than 89%, and we are already at 82%. The next chart shows when these corrections occurred and I have used Item #’s 2, 5 and 6 to show the details.
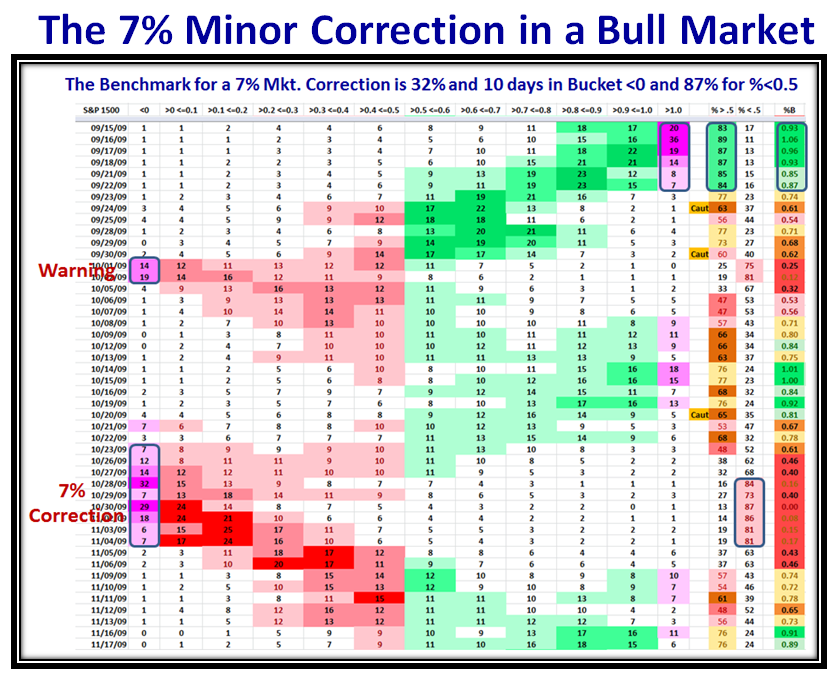
Here is the picture of the Buckets and key data for Item #2, the period of Oct to Nov of 2009, a 7% Correction. Note that the first Warning sign was three weeks earlier before the Rally Paused to Refresh:
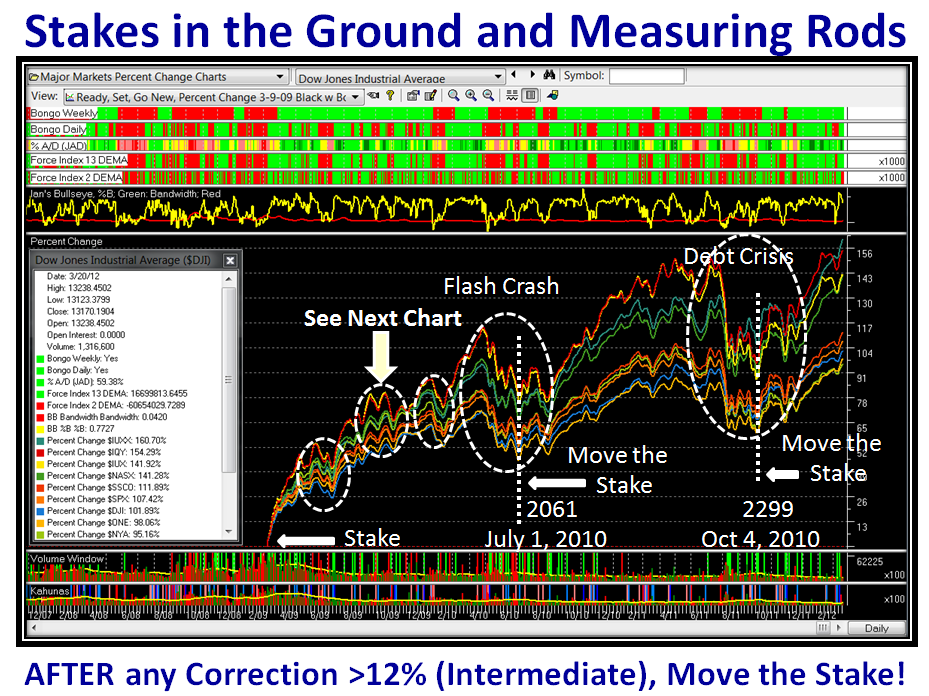
Let’s now look at a bleak picture which shows the dismal results for the Debt Crisis kerfuffle last August:
As you well know, these numbers of 93% in Bucket <0 and 100% of the Stocks below 0.5 are the worst seen. Now let’s turn our attention to today, hot off the press. We are sitting on a knife edge where we either see a Major push back up or the floodgates open and we either Pause to Refresh or go down for a full blown correction:
Those who attended the October Seminar are looking at the Leaders Index and scratching their heads as to what to do as we have not seen Leaders holding up so well while the rest of the market is exhibiting decay. The “go to” stocks of AAPL and PCLN were actually positive today. Since Anindo gave a list of 10 stocks he is following, I felt I would give him a bonus of his Leader Group chart which also shows the familiar pattern we all saw at the Seminar. One of these days we might see him and a few others who sit down in San Diego again at the Seminars!
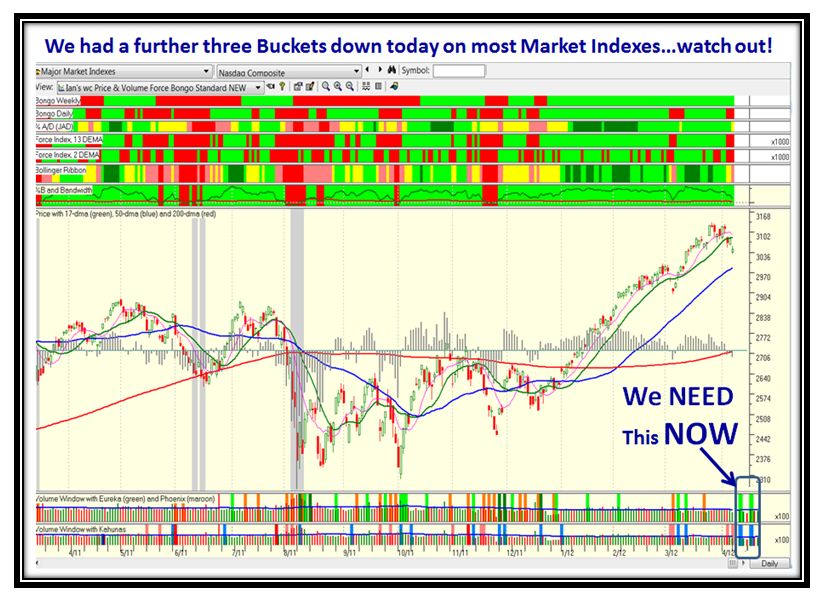
Before you get too complacent, we have now had two Kahunas down on the Nasdaq within three days. Just cast your beady eyes back to August 2011, then try September and November to decide the odds for and against you hanging on. The answer is simple…we must see equally strong upside Kahunas right away if we are to counter the inevitable pause to refresh at least and may be even worse.
As the popular saying goes on the HGSI Yahoo bb, “we will know in the fullness of time” and the time is NOW!
Best Regards,
Ian
 Ian Woodward's Investing Blog