Stock Market: When Bubbles Burst?
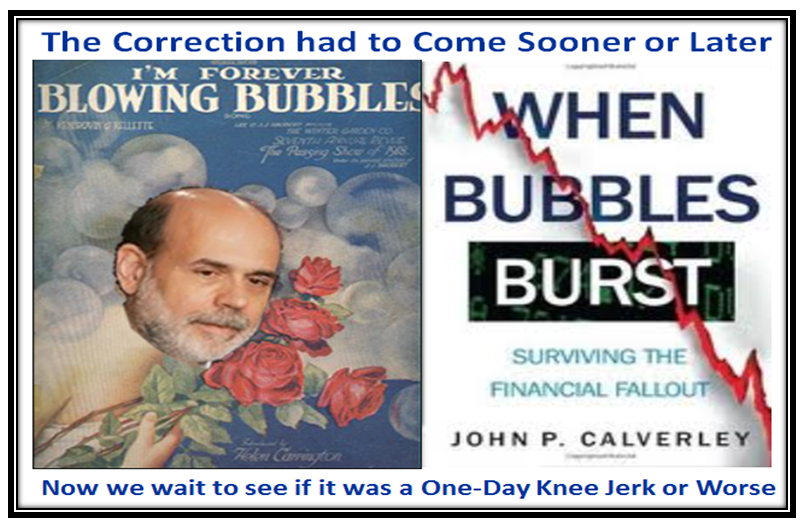
It’s no news to you that we had a Climax Run blow off on 05/22/2013 when most Indexes hit new highs and then the next day we had a knee jerk down. However as you will see, the Correction so far has been orderly and has found temporary support. This week will be critical to determine whether we continue downwards to arrive at the first downwards target of -4% from their highs, or we find new support and press upwards to either a double top or push on through to the next target higher:
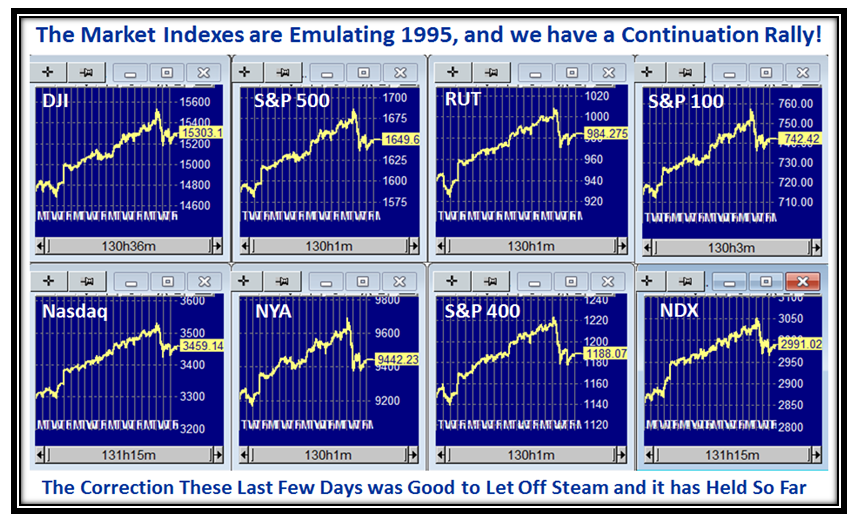
Here is the usual picture of the eight Market Indexes which show at a glance the action in unison of them:
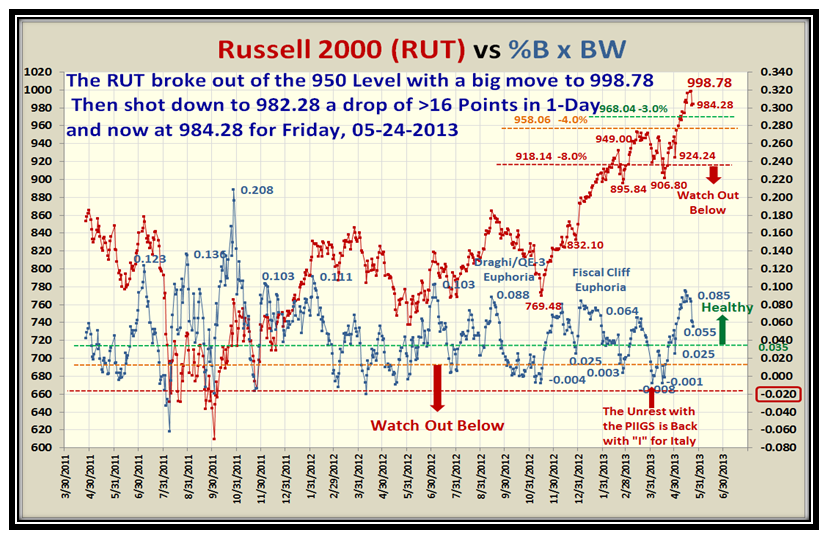
…And here is the Russell 2000 which shows the drop of over 16 points in one day for the Knee Jerk:
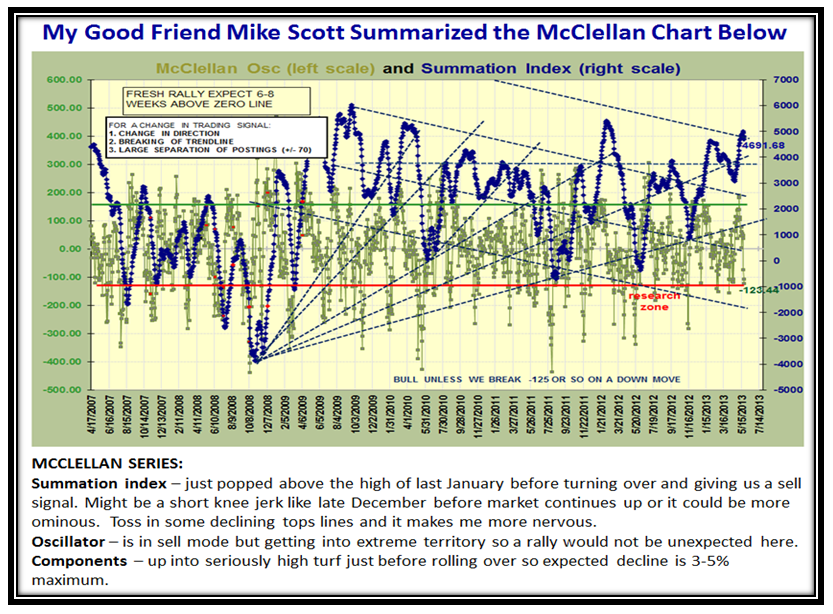
My good friend Mike Scott keeps a beady eye on the McClellan Oscillator and Summation Index and sent me his usual update which he has done for over 20 years. Here is his summary thoughts on where we stand today:
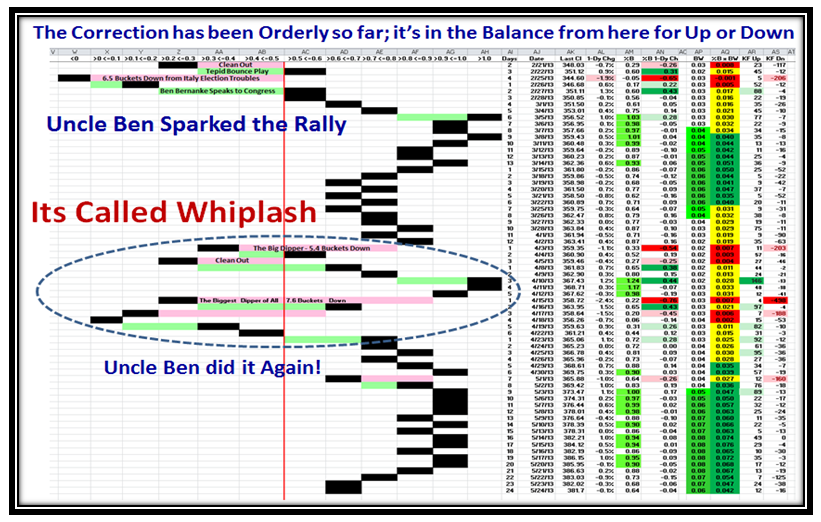
Here is the supporting evidence that the Correction has been only four days and orderly so far:
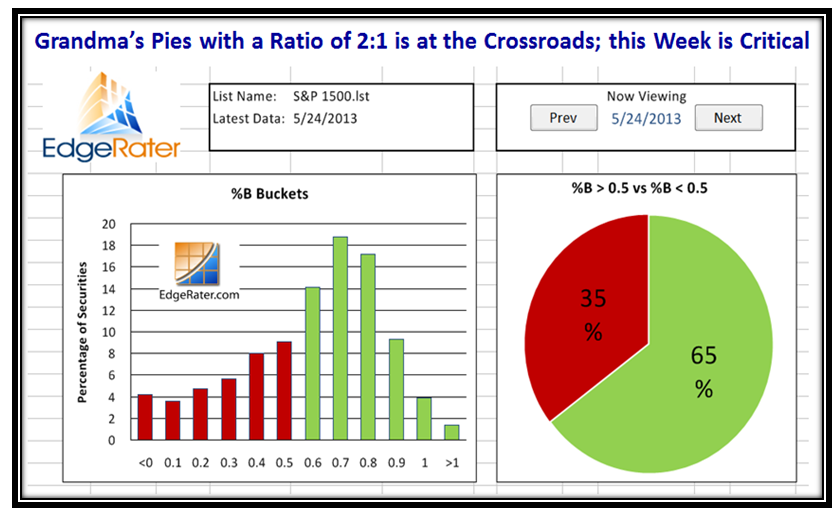
Grandma’s Pies show we are at the Crossroads:
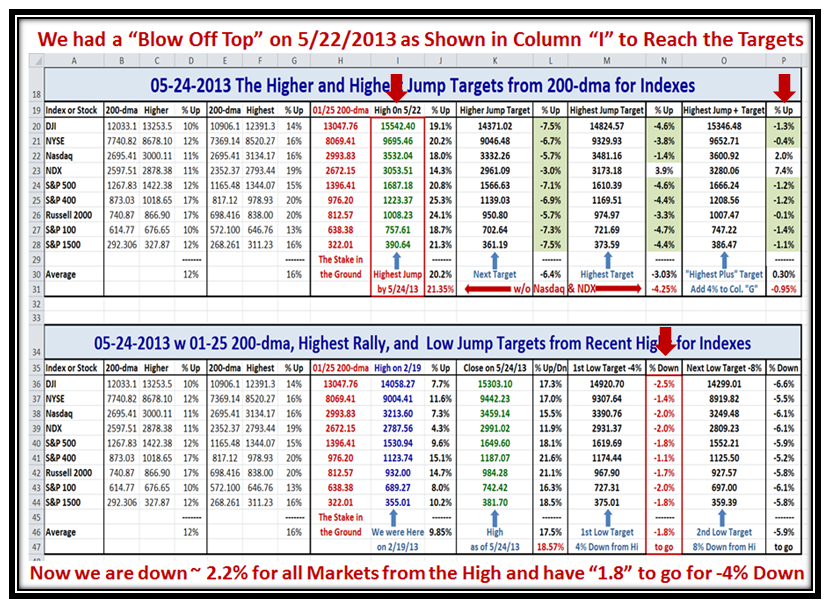
Now that we have reached a top with regard to meeting the Highest Jump Plus Targets (except for the Nasdaq and NDX which we know have lagged all along due to the hammering AAPL took earlier and its heavy influence on these Indexes), I show the Highs reached on 5/22/2013 and the extent of the decline so far which is approximately -2% on average:
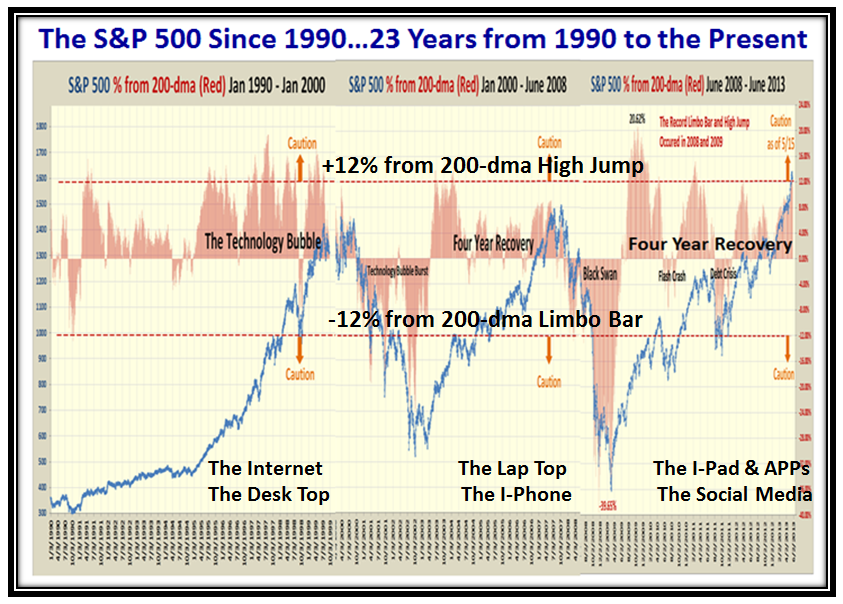
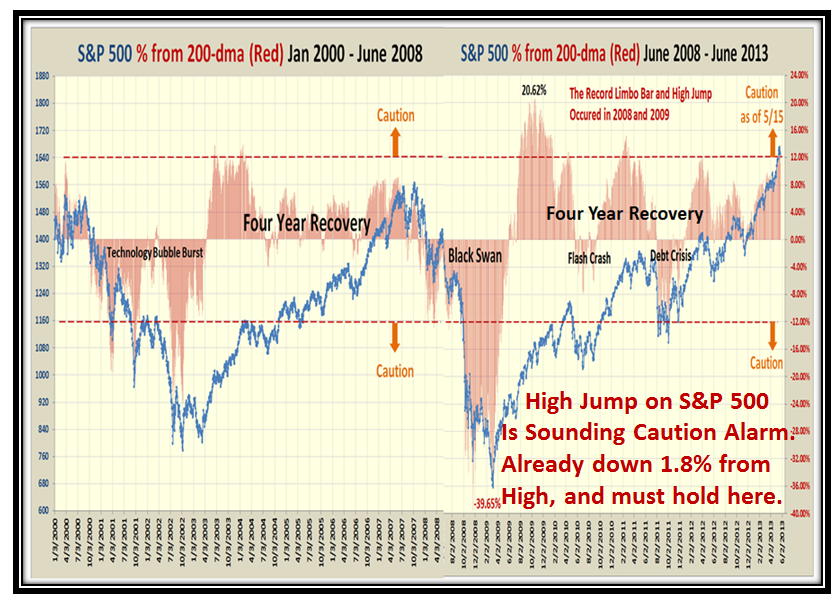
Now here are a series of charts which hopefully you will find are “Good Stuff”. It picks up on the theme of the High Jump which clinches that plus or minus 12% from the 200-dma is the Caution Signal for the S&P 500…Enjoy:
…And here is a closer in view which shows the last 13 years. Please note the Caution on the chart:
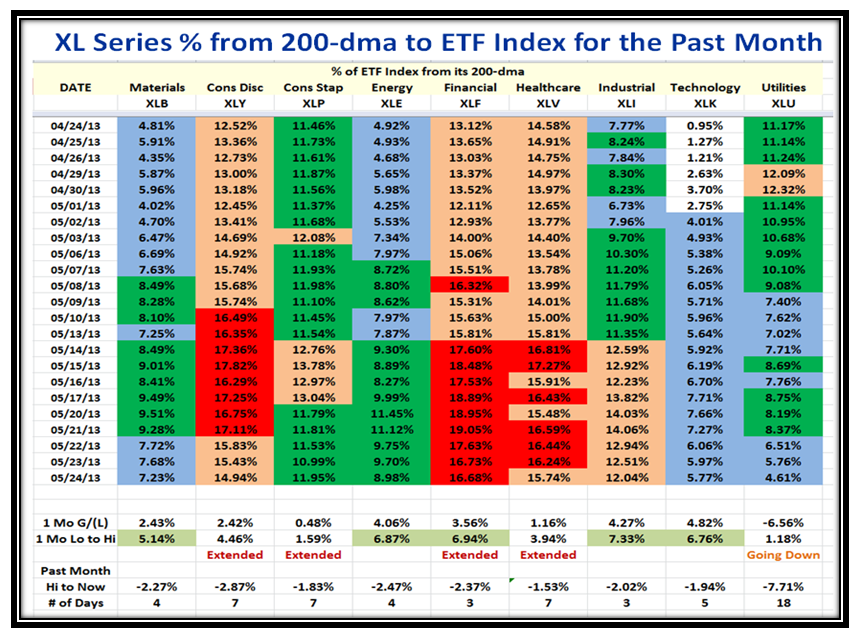
I felt we should turn our attention to the XL Series of ETFs and show you a snapshot of their performance over the last month. I have indicated what I feel are the ETFs that are extended and also those that may still be playable provided the market turns upwards yet one more time:
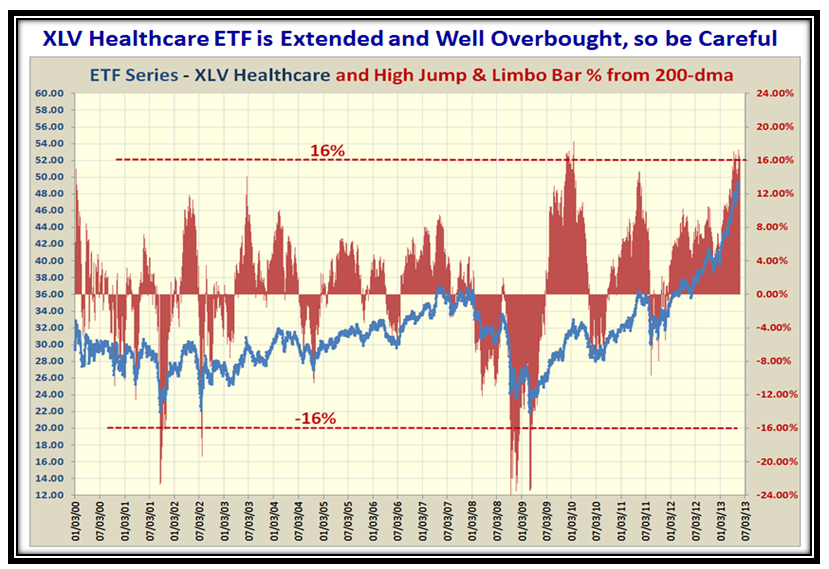
Here is the History for the Healthcare ETF XLV, which shows this one is extended and well overbought:
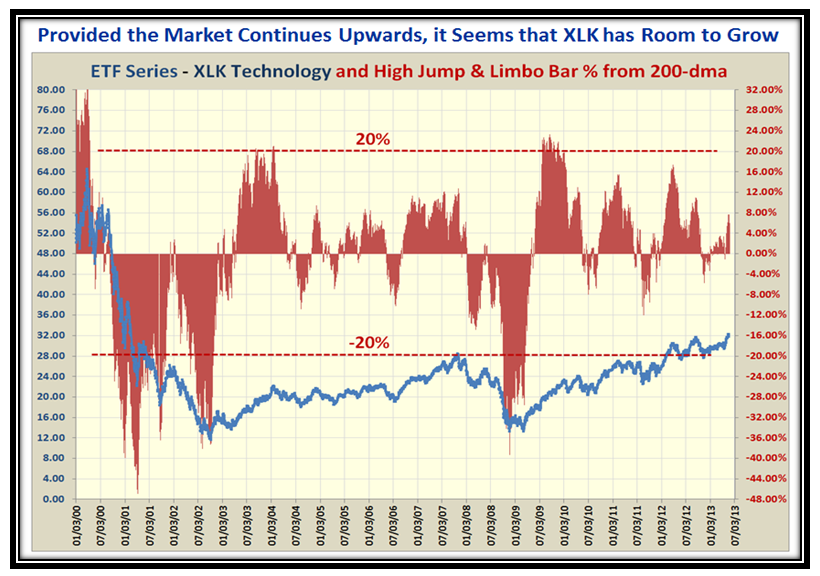
…And here is a chart for the Technology ETF XLK, which may offer an opportunity if the market has more to the upside:
I trust you all had a good Memorial Day and remembered our troops in your thoughts and prayers.
Best Regards,
Ian
 Ian Woodward's Investing Blog