 Ian Woodward's Investing Blog
Stock Market: Blowing Bubbles in Sight
Now that Thanksgiving has come and gone with nary a sign of the Market giving up its upward climb yet, the Indexes have blown through the rounded numbers of 16,000, 4000 and 1800 for the DJIA, NASDAQ and the S&P 500. So now we look forward to Santa Claus in his red car to drive this Rally to even further heights, hopefully before it gives up the ghost.
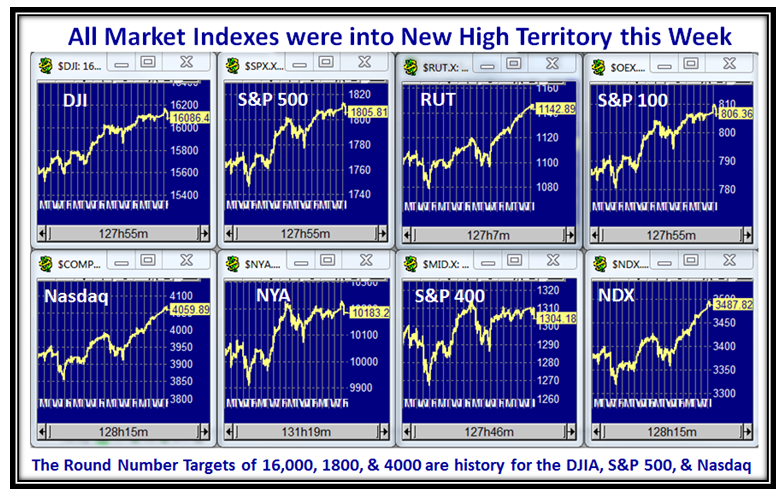
The Market Indexes drove into New High Territory yet again this past week as shown below:
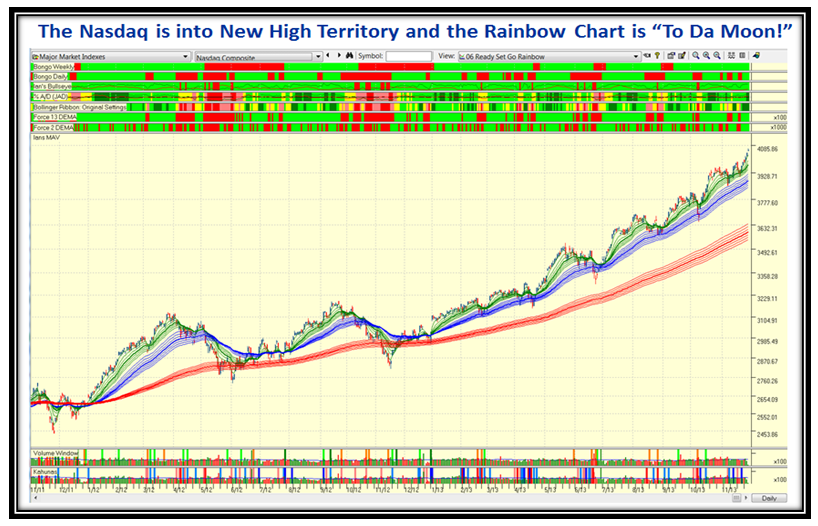
The NASDAQ is showing fresh Momentum and the Rainbow Charts are rising to the Moon…notice that %A/D is strong showing “dark Green”, with three Blue Kahunas in the last ten days!
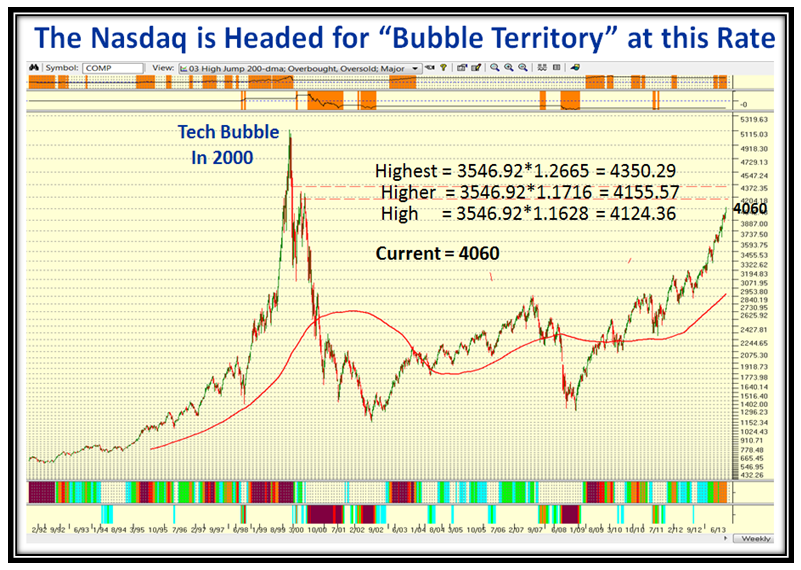
The obvious question at this stage is “How Much Further can the Nasdaq go?” Let’s turn to the High Jump, which has served us well when the Market gets Overbought, as it is now. The answer based on recent History is on the next chart:
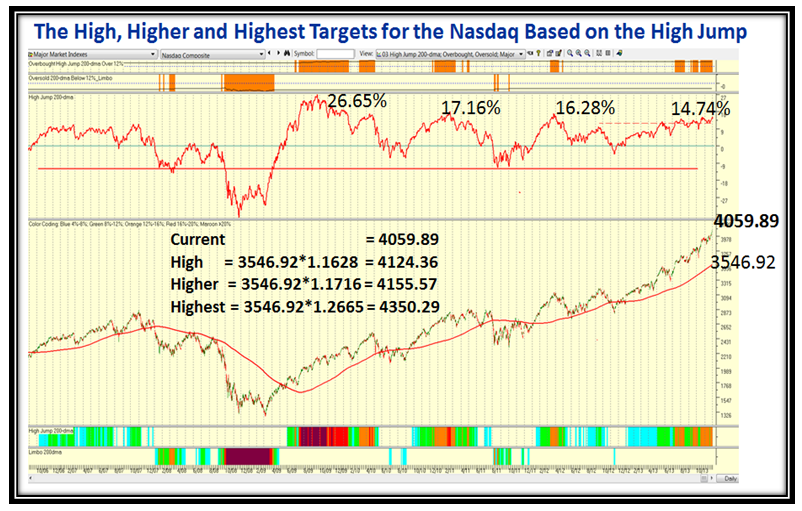
Here is where the Greed and Fear really sets in as seen by this next chart which shows the famous Tech Bubble from 1999 to late 2000, with the High Jump potential Targets on the chart. It doesn’t take much to see that we are fast moving to nose bleed territory!
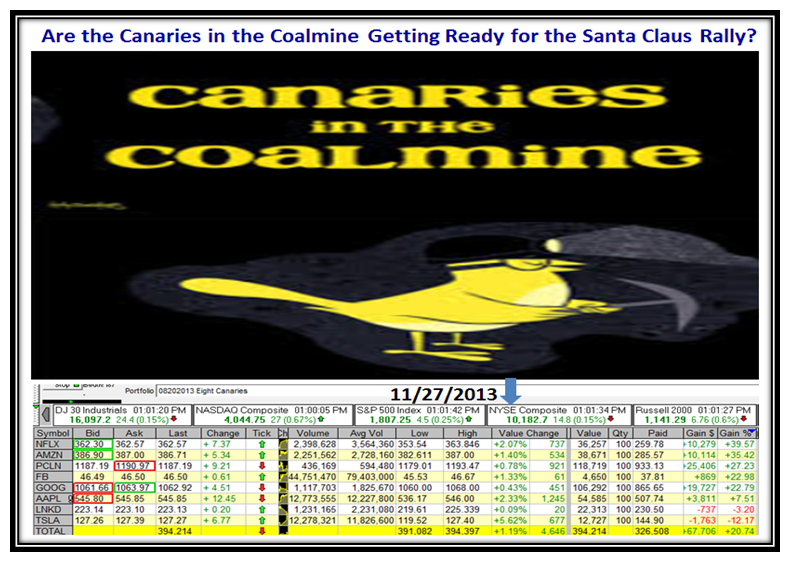
Now let’s take a look at the innards of the Market and see how the Canaries are holding up since they have recently found support, and had a strong bounce back on 11/27/2013, the day before Thanksgiving:
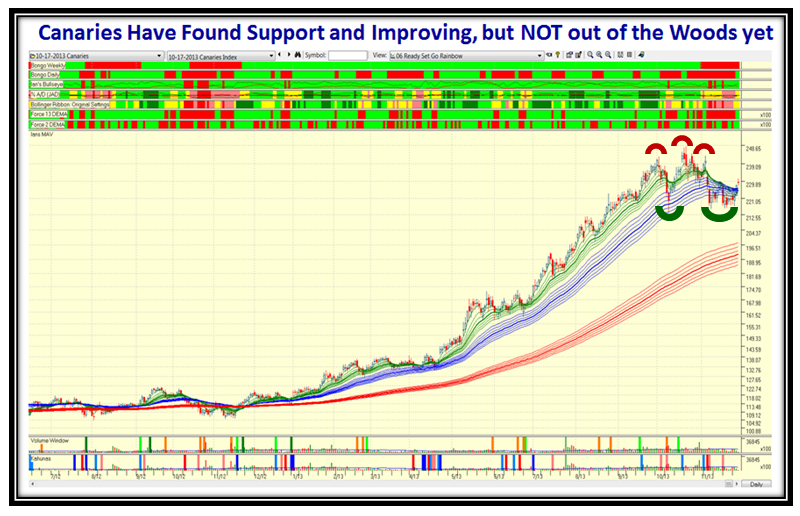
…And here is the Index for the Canaries, which shows a small recovery so far, but not enough to dance the Highland Fling!
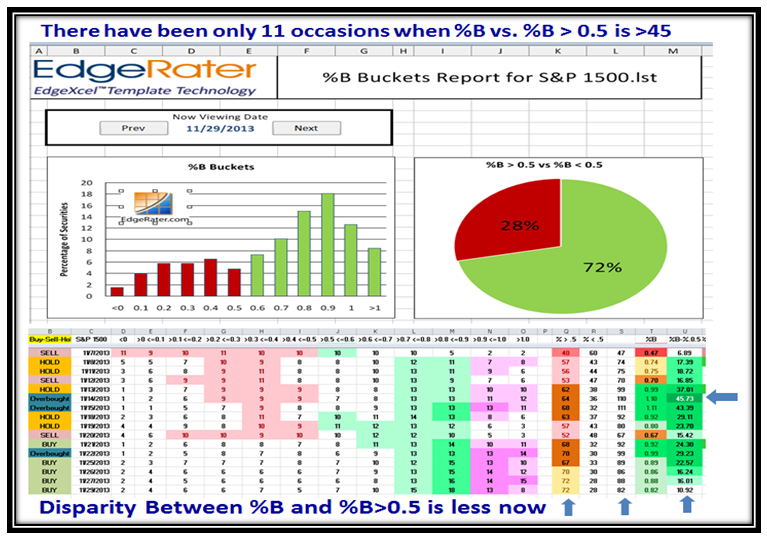
Here is the improvement since the two day ying-yang we had two weeks ago, which shows we are in safe territory with a cushion:
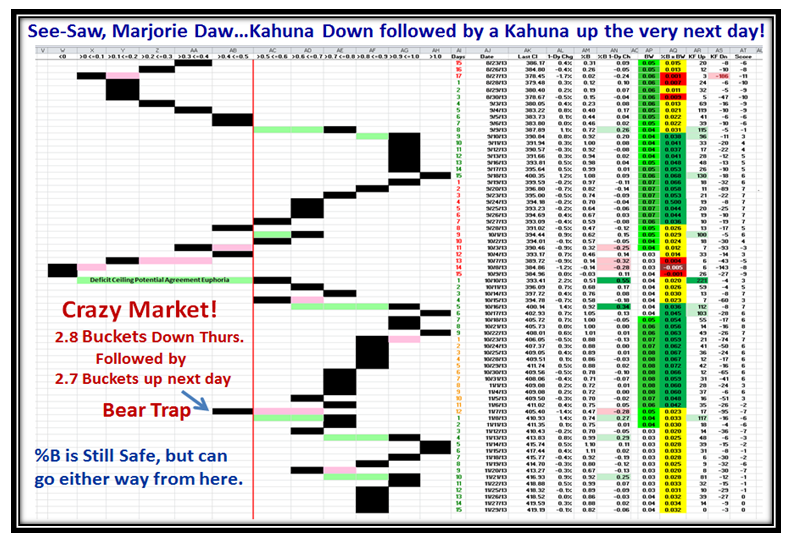
…And its twin picture which shows that the discrepancy between %B of the S&P 1500 and the % Stocks >0.5 has righted itself:
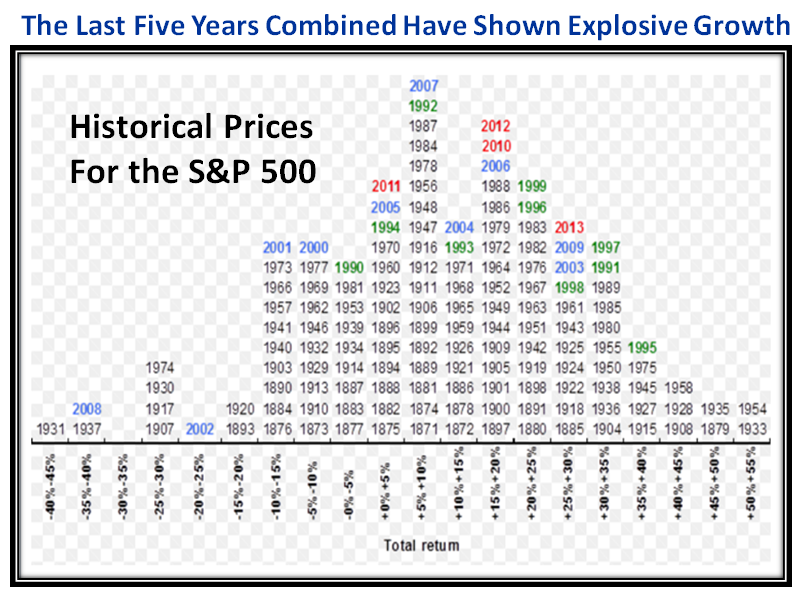
Here is a bonus picture for you to ponder over…The Historical Prices Year-by-Year of the Total Return for the S&P 500, which shows that the last five years from 2009 to 2013 have been very strong.
Best Regards,
Ian.
