Ian Woodward's Investing Blog

Archive for the ‘Market Analysis’ Category

Stock Market: Up a Lazy River, but be Alert

Tuesday, January 22nd, 2013

Now that the Inauguration is over, the Markets are back in business and still climbing a wall of fear, but except for the obvious Overbought situation, there are still no signs of a Break to the downside.  Blue Skies up above, but watch out for the Dark Clouds to roll in:

Blue PIcture

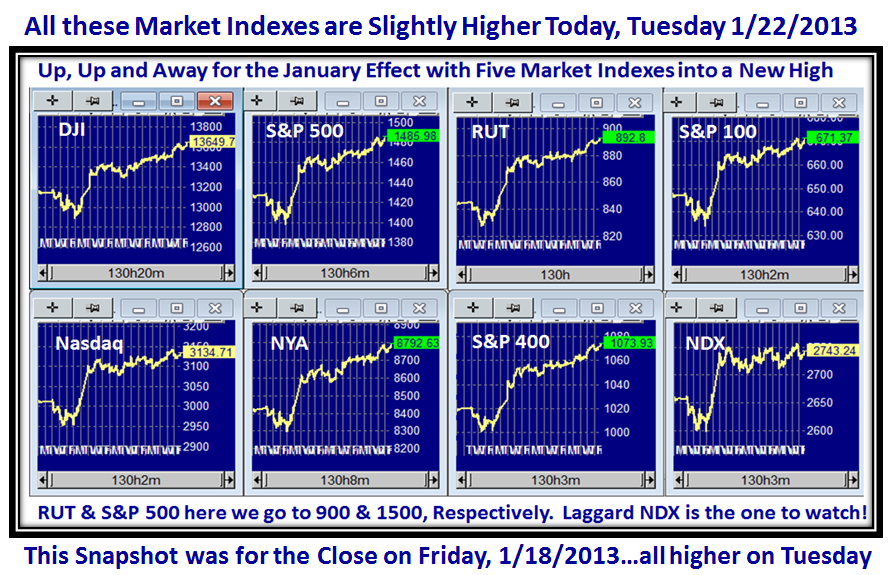
I am writing this Blog Note on Tuesday Morning at over half way through the session, and the Markets are all positive as I write:

Blue Indexes

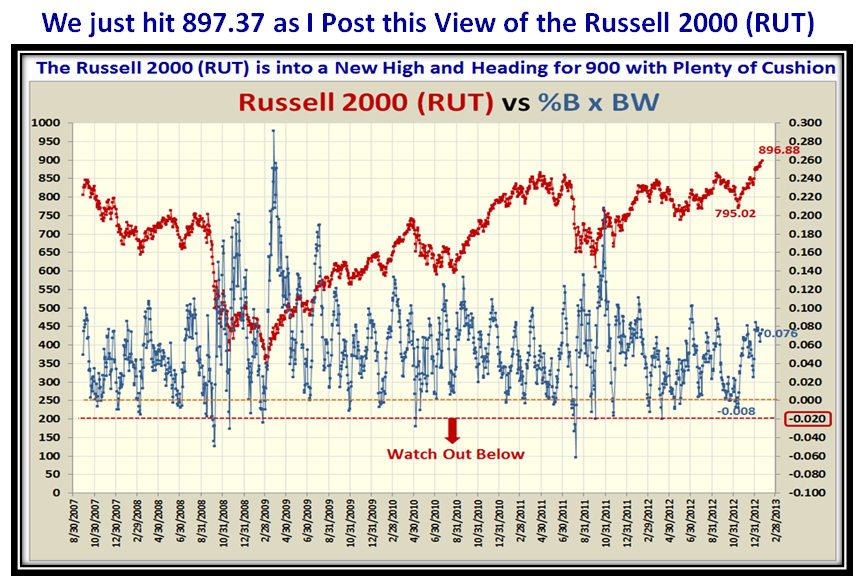
We are still on Target to hit 900 on the RUT as I suggested a few days ago and we are within 3 points of that target as I write:

Blue RUT

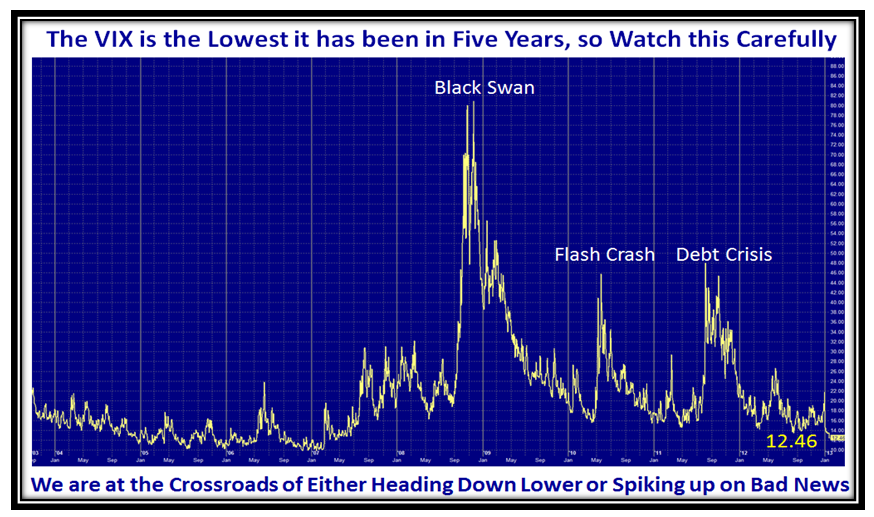
The VIX is alarmingly “Quiet”!  This could be the start of something big with a long run to come or just waiting for some bad news to shoot it back up above 20ish…we will just have to wait and see, but for now this too provides us a nice cushion in which to act should we have to run for the hills, or turn to shorting the market:

Blue VIX

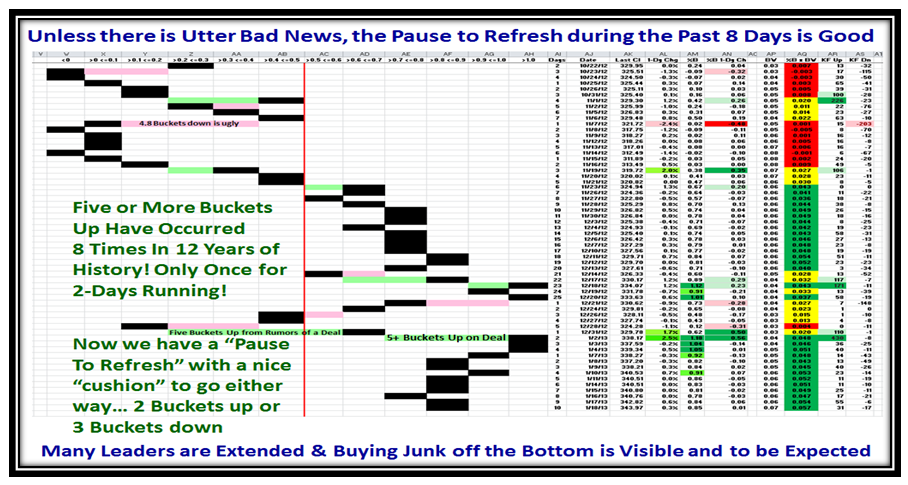
…And here is the snapshot of the Bucket Brigade which also shows we can go either way, and have a cushion for the downside:

Blue Pat 2

As we would expect, the A+B vs D+E snapshot shows we are getting to the point of exhaustion to the upside, and we have been on Alert for some time now, but now things are curling over:

Blue acc

Watch for the big guns to sell into this rally at some point in time, and the best alarm is at least a 2% down day in the Market Indexes coupled with 5 Buckets down, and then succeeding Kahuna alerts to the downside as I previously showed you in the picture for #7 & #8 successive 5 Bucket up days at the start of the New Year.

Good Hunting,

Ian.

Stock Market: January Effect Came in with a Bang, but Now What?

Sunday, January 13th, 2013

My New Year’s Blog set the stage for the Euphoria of the January Effect spurred on by a settlement of the Fiscal Cliff just in time to avoid pain.  Let me remind you that January Effects can indeed last well into March, but of course there are invariably pull backs along the way.  The question at this stage is how much and when, so let me portray the upside and the downside for the next couple of weeks.

January Picture

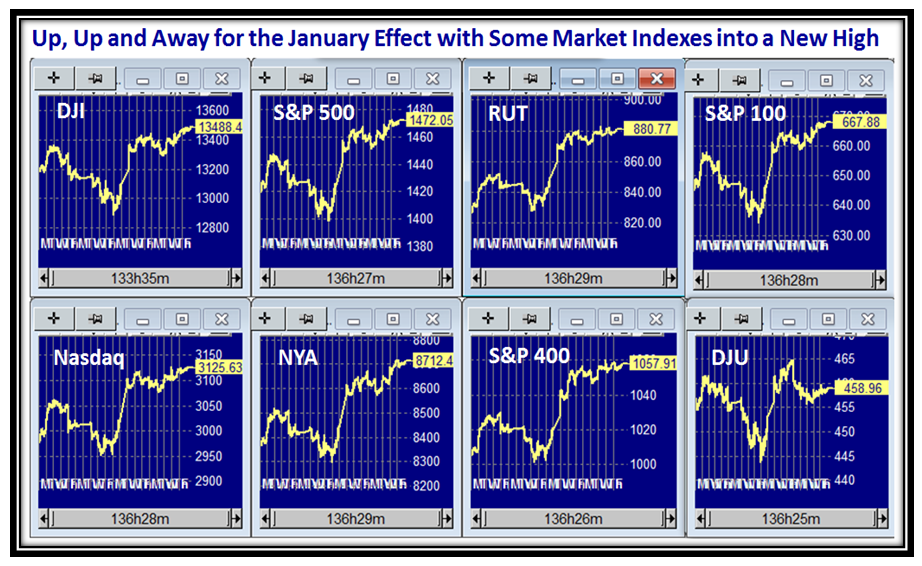
My signature chart of the eight Market Indexes show that we are into New High Territory for the likes of the S&P 500 and Russell 2000 (RUT), but there has inevitably been a stalling action or more appropriately a “Pause to Refresh” and here is that picture:

January Indexes

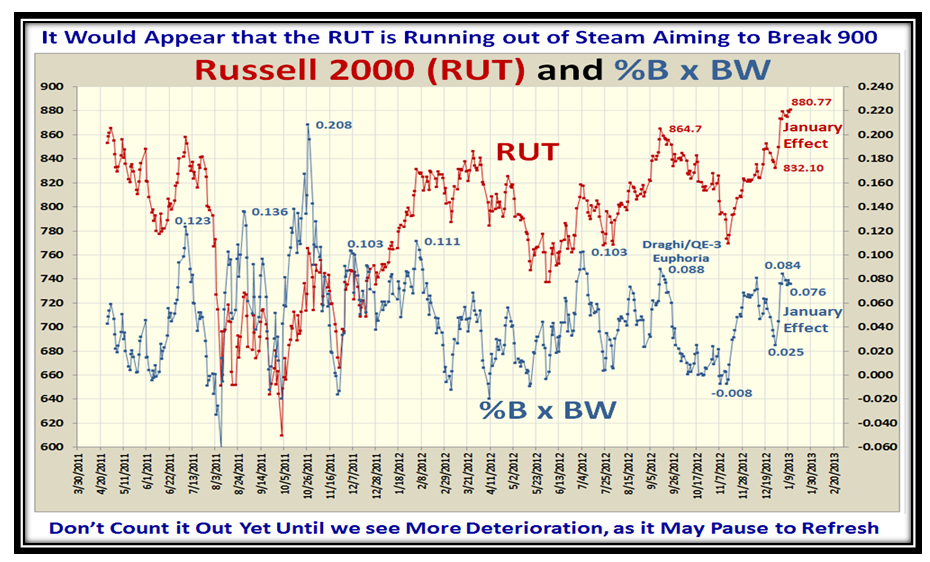
So let’s dig deeper and take a look at the RUT, and we see that it shot up and as I suggested was headed for 900, but it paused to refresh this past week and that is only to be expected after such an Irrational Exuberance move the previous week.

January RUT

Let me remind you that ten buckets up in two days in a row is not to be taken lightly, and its effect was to drive the underlying parameters of the Market such as the Accumulation/Distribution Ratio to new highs not seen since this time last year, as we will see in this next chart:

January abcde

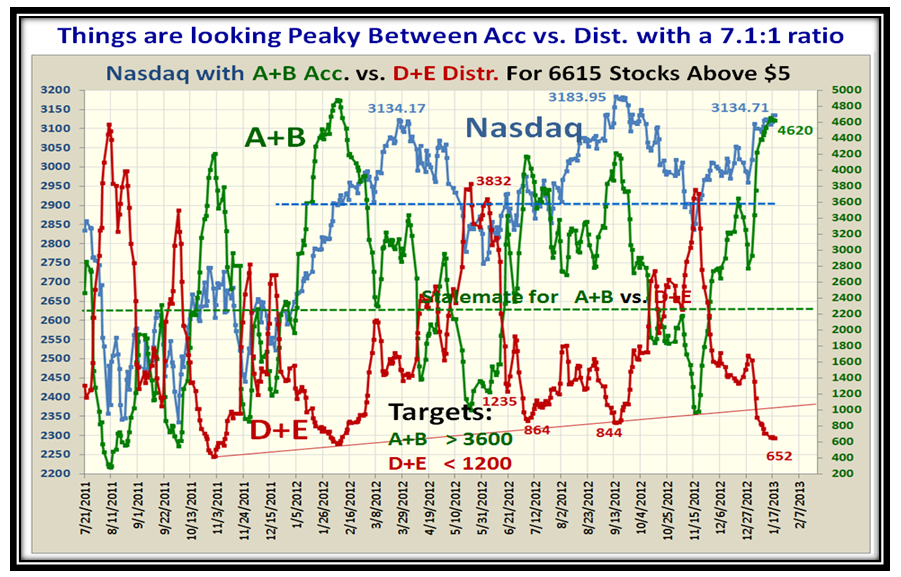
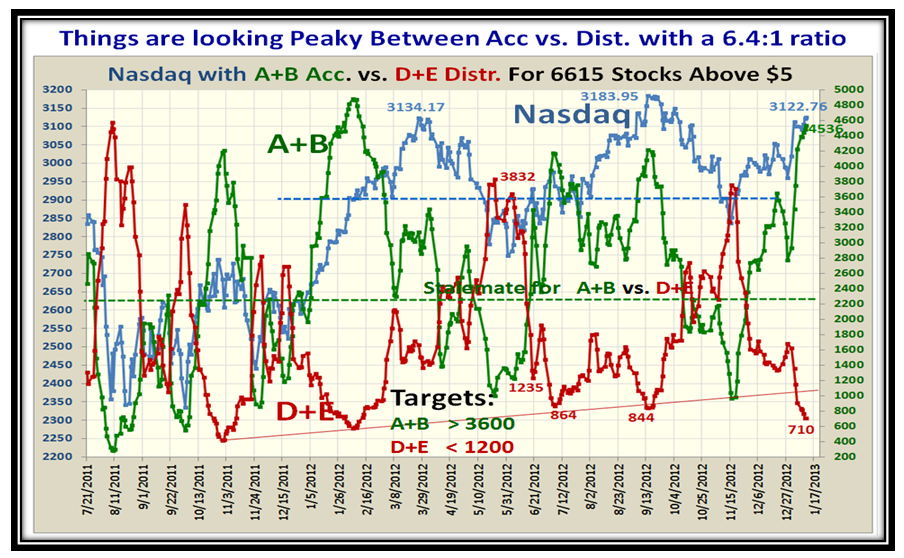
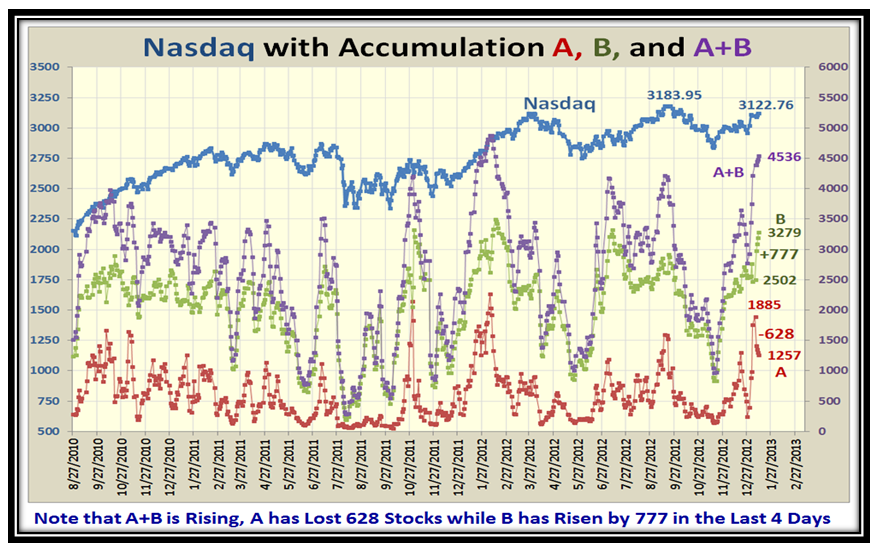
But now we must look deeper and focus on the relationships of A, B and A+B as shown in this next chart.  As I show, this past week we have seen a falling off of stocks with A Accumulation of 628 stocks though an increase of 777 stocks into B which gave a small net increase to A+B.  The Total of 4536 stocks in A+B is the second highest in the three years shown, so it is still inching up:

January ab and

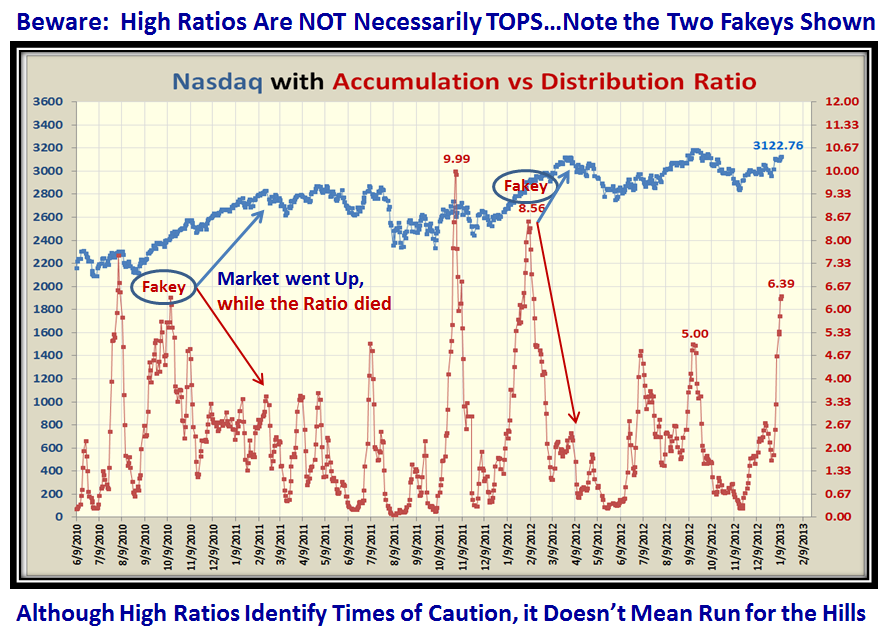
But that is not enough…let’s look at the History with regard to the Ratio of A+B:D+E to see if we can glean where we stand and what to be careful about before we draw general conclusions.  As I point out on the chart, be careful you don’t get Faked out and miss additional upside moves as has happened twice in the last three years:

January ratios

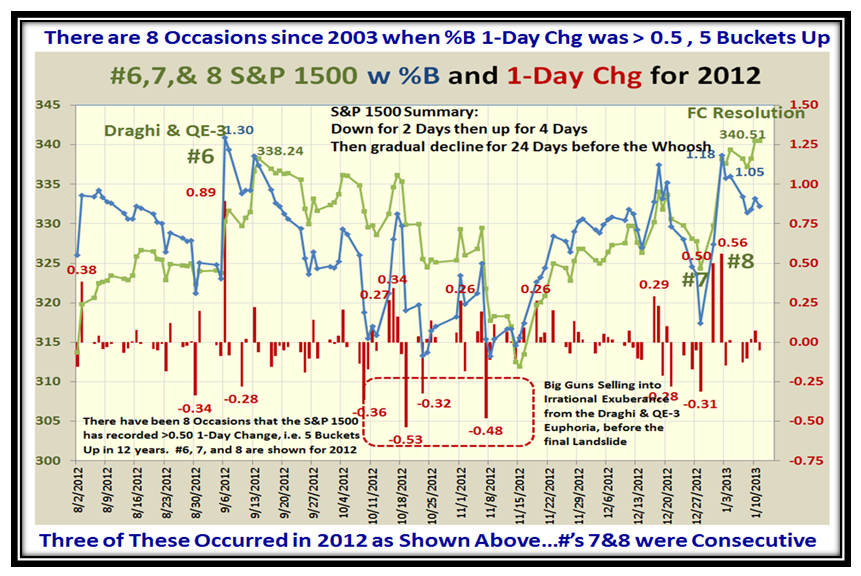
It is noteworthy that the two Fakey’s both occurred at the January through March timeframe, so watch carefully and don’t jump to conclusions too fast.  So how do we find clues as to which way the wind is blowing?  I gave you that last week and that is to watch how the Big Guns may be selling into this situation as we follow their actions with Down Kahunas.  It is a trifle early to say, but note how the drop in %B has not as yet been matched with Big Down Kahunas, although the S&P 1500 has bounced back to 340.51.  It is far too early to tell but I have yet a further trick up my sleeve for you  to keep you on the right side of Greed in the Market:

January 678

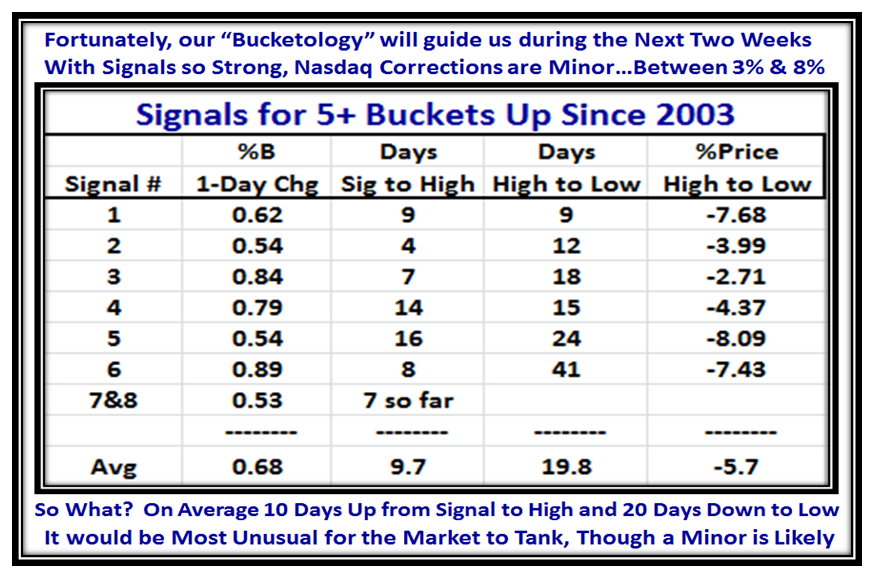
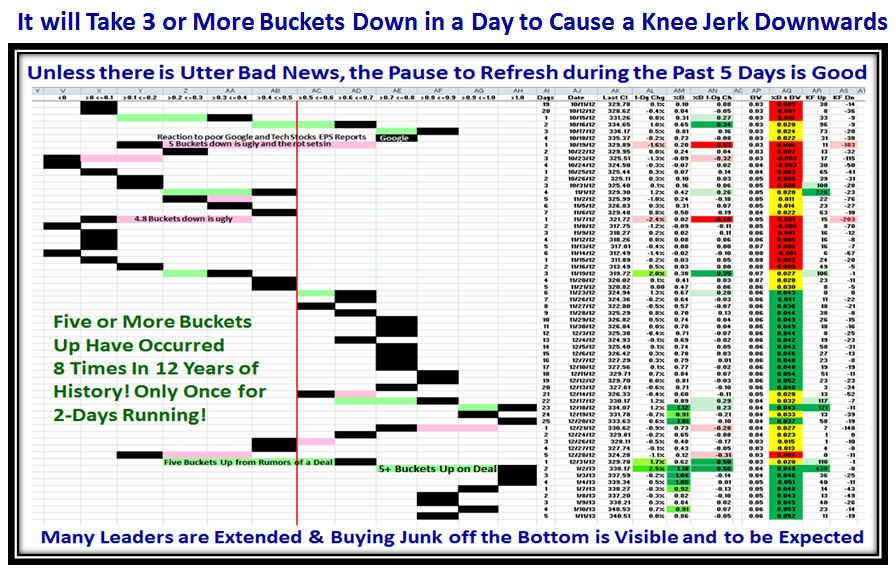
…And now for Late Breaking News.  With the help of my good friend Bob Meagher, here is a summary of the History over the past ten years for when the Market had Five Bucket rises or more in one day, thereby showing excessive exuberance:

January 5 Bucket Stats

To wind this up here is the usual picture you look forward to, and you can readily see we have room to go either way, but be thankful for small mercies that we still have a cushion before a landslide sets in unless we hit something ominous like 3 or more Buckets down in a day!

January Pat

…And that’s my Story for Today!  I always have a few faithful followers who regularly drop me a line of encouragement and I am grateful for that.  However, I am amazed at how we have a laize faire approach to writing a line of thanks with this Internet media.  That’s life!  When I am gone I hope you will miss me, but then it will be too late.

Best Regards,

Ian.

Stock Market: Remember Draghi & QE-3 Euphoria?

Saturday, January 5th, 2013

I am sure you recall the Irrational Exuberance of a couple of months ago when the Draghi Plan and QE-3 came out a week apart and the Market shot up only to then start the steady decline while the Big Guns propped the Market up long enough to pull you in while selling into it.  We are at that same stage now that the Fiscal Cliff fiasco has been temporarily fixed as they kicked the can down the road a couple of months before we have the next fru-frau.

So in the short term enjoy the remainder of the January Effect, but then look for similarities to the last chart in this blog note which I have developed to keep you on your toes.  I see Italy and India have recently gone “gaga” on this good stuff so my thanks to them for their support along with all the other faithfuls:

Sinatra Picture

As you can see from the Market Indexes Charts they are all up, up and away above the resistance lines with some of them into new High Territory…notably the Small Cap Russell 2000 as I predicted previously:
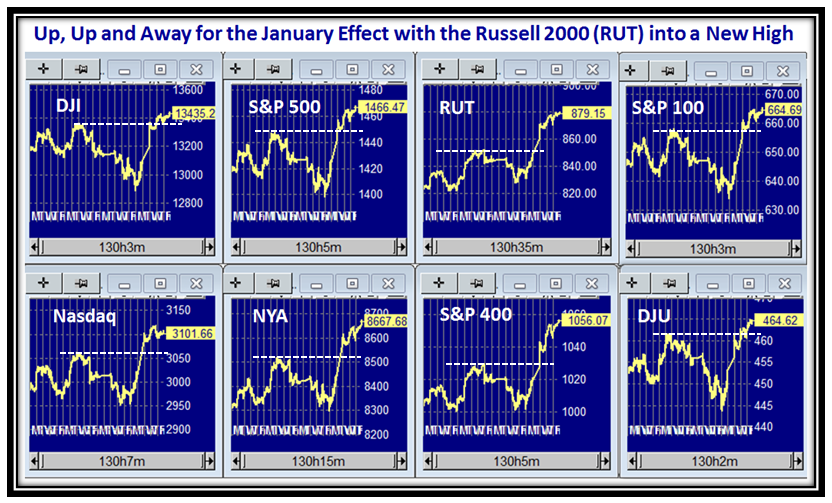
Sinatra Indexes

As you would now come to expect, we got the usual Eureka and Kahuna signals to suggest the Rally was on, but we have an Island Gap in the Nasdaq Composite.  The bias is up, but watch for a slight pull back to close that gap before we see a continuation of this powerful rally.  Alternatively, should the rally continue straight up from here then watch for that spot to be filled on the first retrenchment when there is a correction:
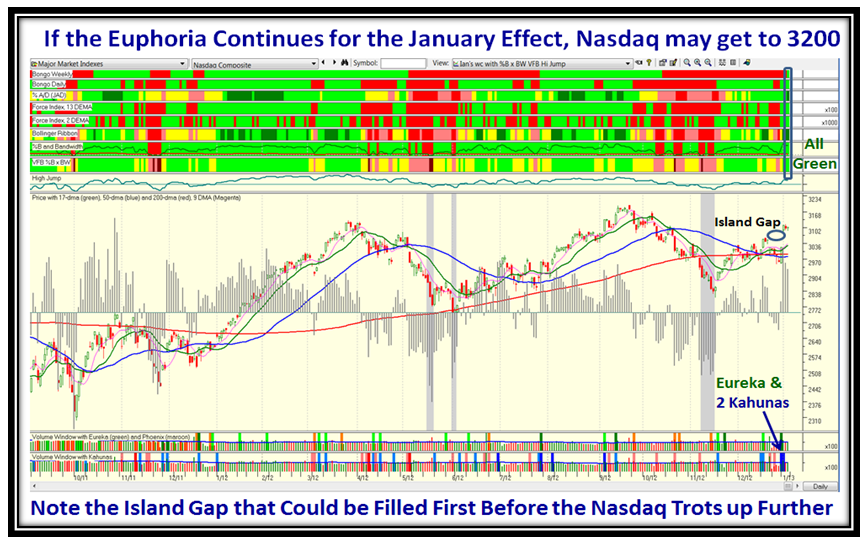
Sinatra Nasdaq

We had the expected knee jerk in the VIX while there was the possibilty that there would not be a settlement in the Fiscal Cliff mumbo jumbo, but now the VIX has dropped to below the 14 mark  and quietness abounds implying no fear for the moment…only greed!
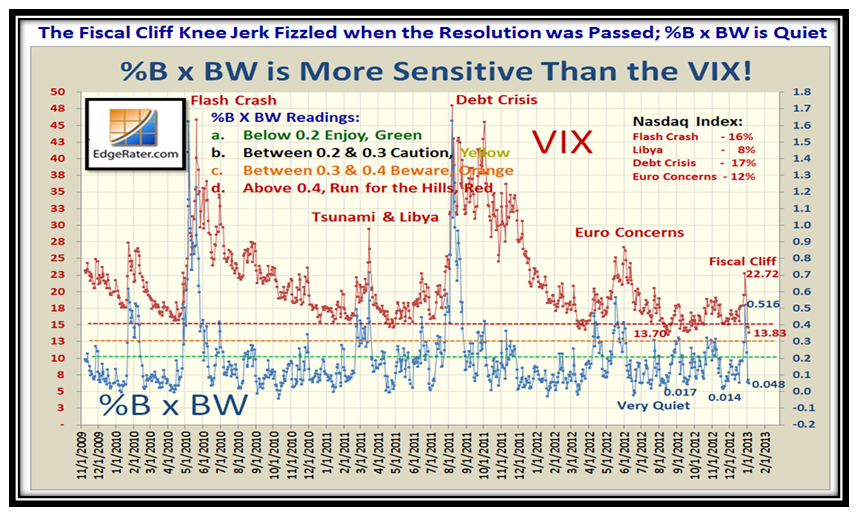
Sinatra VIX

Just to give you perspective on the VIX, here is the picture going back several years and we now watch for whether this is the start of something big in that the VIX should stay below 14 for some time to come (wishful thinking) or once this recent euphoria is over we trot back up to stay on our toes to be on the right side of the Market between Fear and Greed:
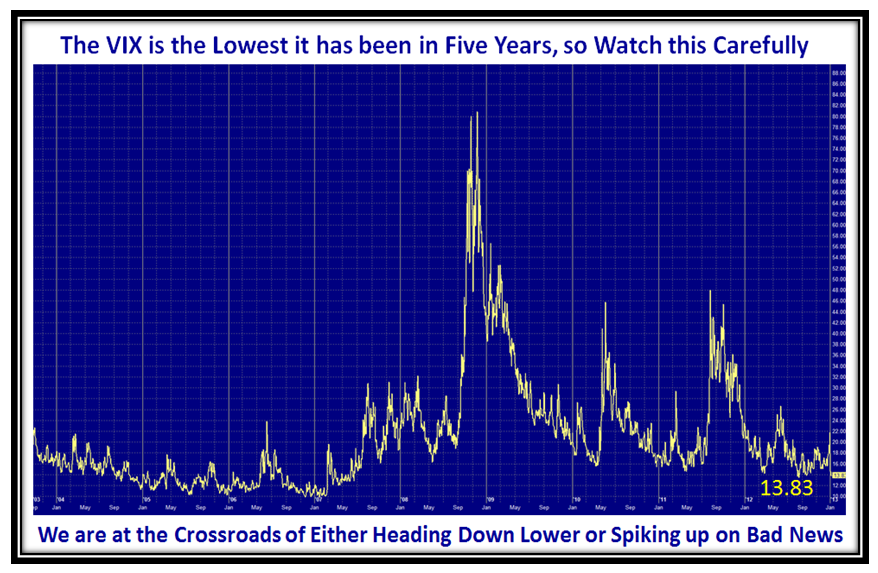
Sinatra VIX2

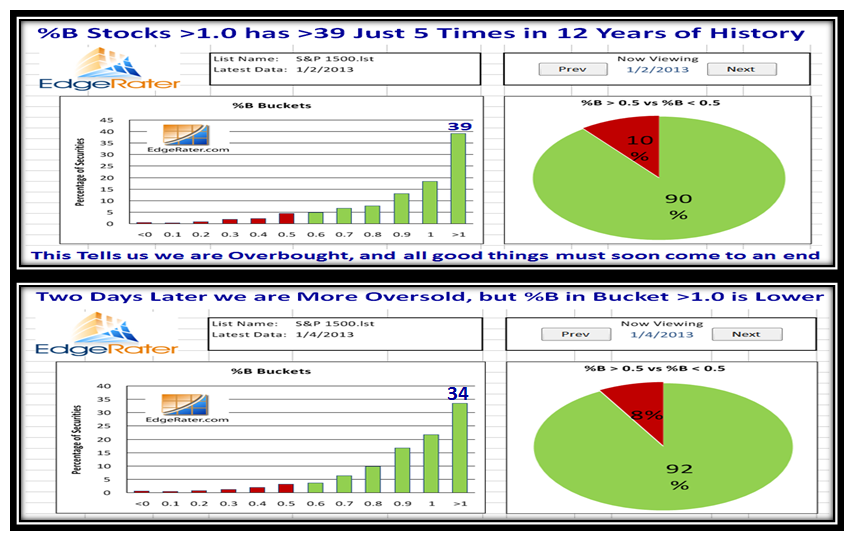
Needless to say that Grandma’s Pies shot up to overbought and invariably within 6 to 8 days of euphoria we should see the decline start to set in.
Sinatra Pies

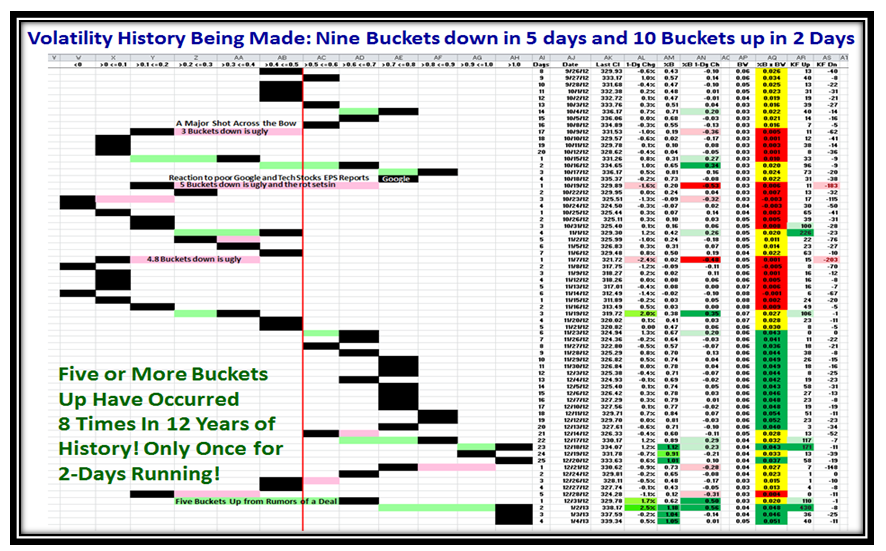
Shorts were covering feverishly these last few days which took us from nine buckets down in 5 days to 10+ Buckets up in 2 Days, where we have remained in Overbought territory for the last three days:
Sinatra Pat

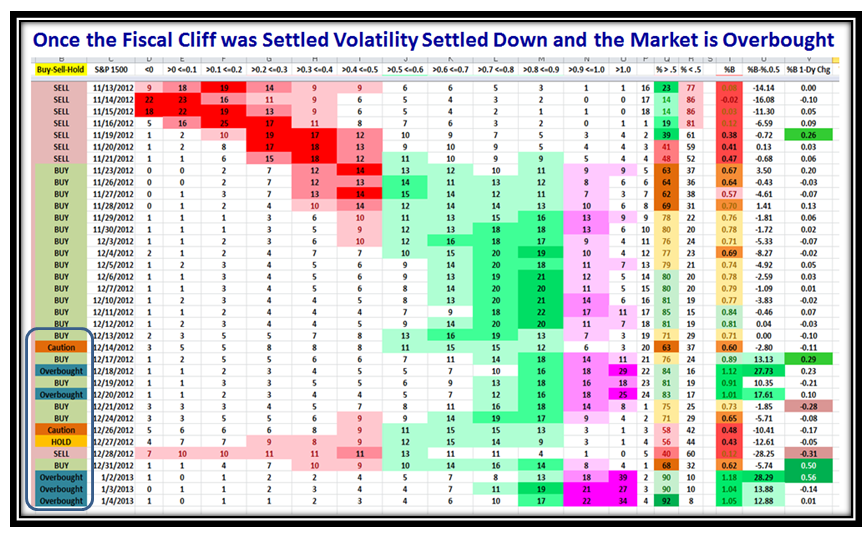
…And here is it’s twin picture, thanks to Pat Turner who developed these basic concepts many moons ago:
Sinatra Pat2

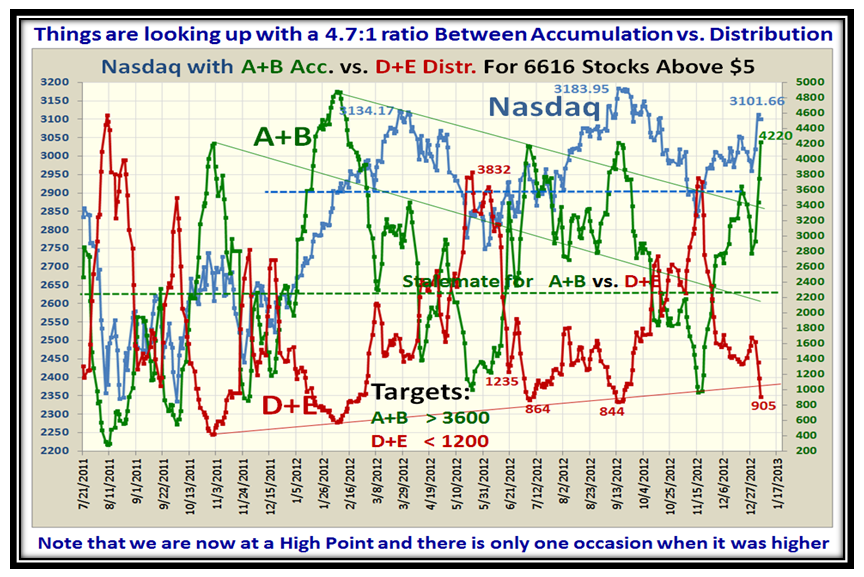
Accumulation A+B took off like a rocket and all it needs is one more push to reach the peak of a year ago:
Sinatra Acc

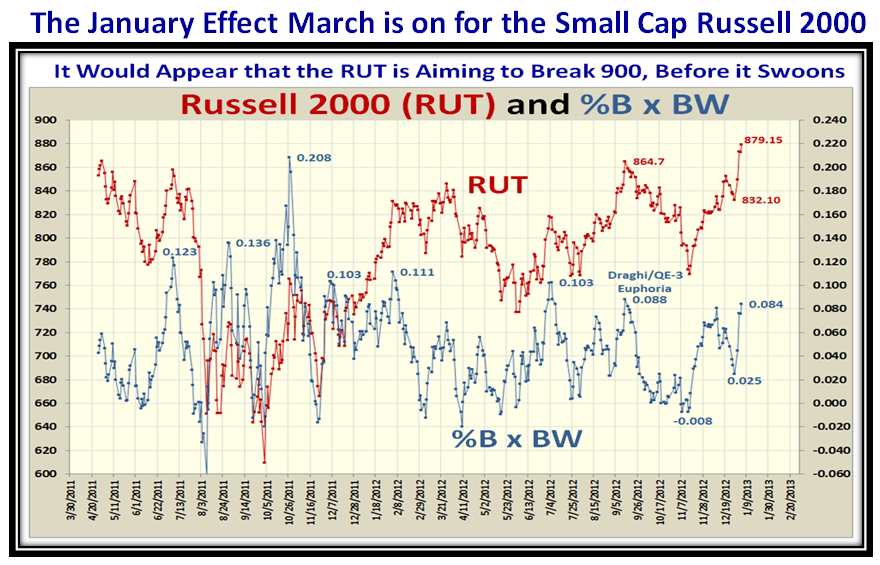
Always remember to watch the Small Cap Russell 2000 (RUT) Index for the January Effect and it is in New High Territory.  The Target is for it to reach the round number of 900, and that is possible given that %B x BW though up is not yet to the moon:
Sinatra RUT

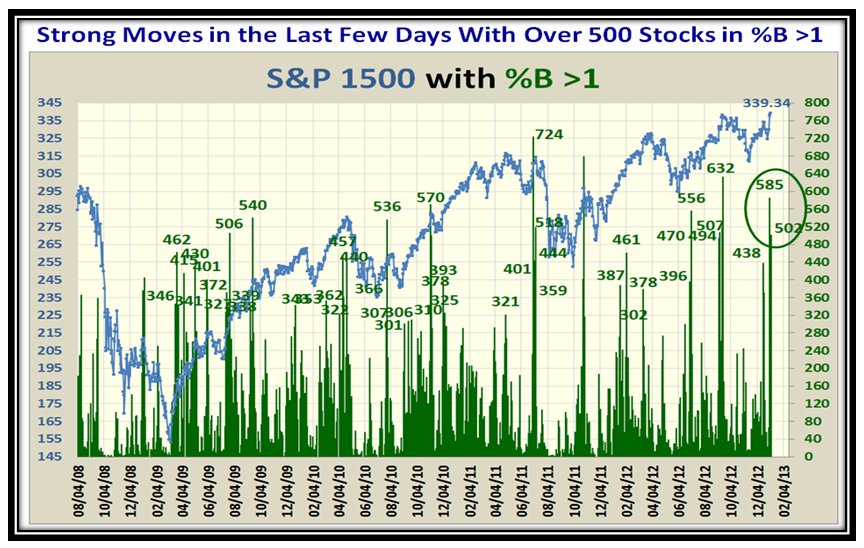
…And to cap all of this euphoria off, here is the proof this was no ordinary rally:
Sinatra Bucket 1

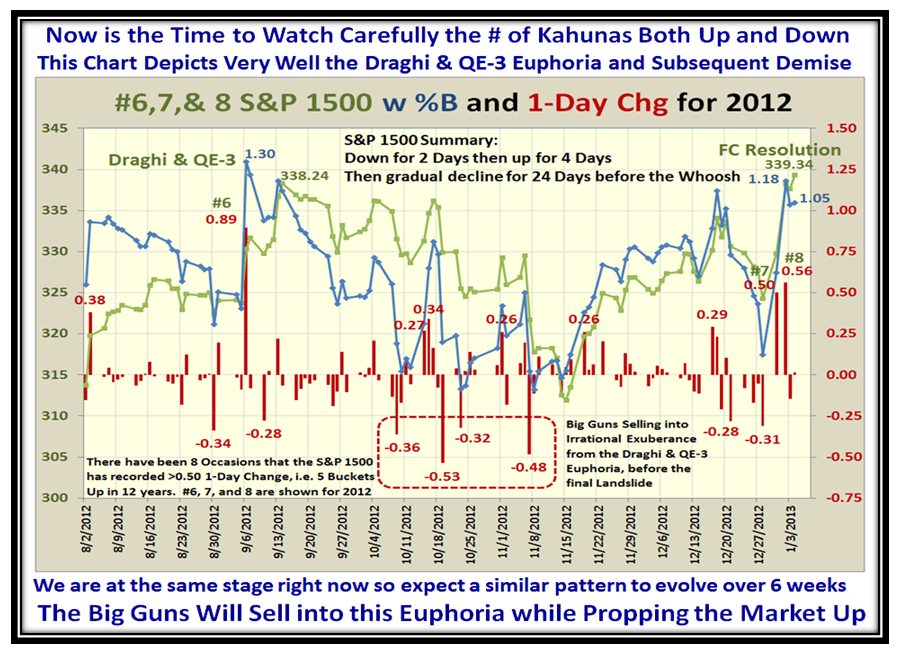
Now you know precisely where you stand on the ladder between Fear and Greed, but let me give you the New Year’s Present I have for you to show you precisely what to watch for in the coming weeks based on what transpired at a similar stage of Greed with the Draghi + QE-3 announcements a couple of months ago.  They say History never repeats itself, but it usually does “Close Enough for Government Work”.
Sinatra 1 Day Chg

I know there is a lot to digest in this chart, but click on it which will enlarge it.  Then make a copy of it and watch it like a hawk.  The SINGLE Key Item to watch for is the Number of Kahunas to the downside interspersed with those to the upside (shown in the dotted red area) which will give you a clue as to when the Big Guns are pulling you in while they sell into the rally and then when they have got you committed, they will drop the market like a lead balloon!

Best Wishes for a Happy New Year comes with this present to you and may all your bets be winners.

Give us some feedback in the Comments at the bottom of the note!  It only takes a minute.

Ian

Stock Market: The Grinch Stole Christmas!

Saturday, December 29th, 2012

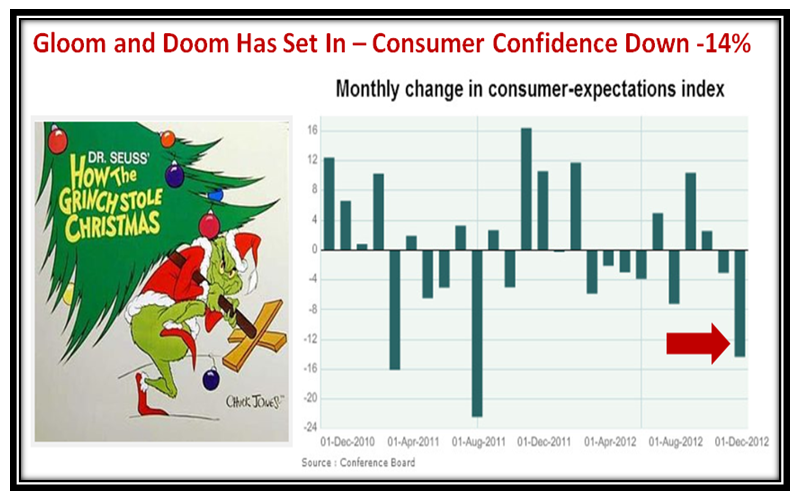
Gloom and Doom have set in as Consumer Confidence declined -14% this month and we are hanging on by our finger nails for a solution to the Fiscal Cliff, which at this stage seems inevitable:

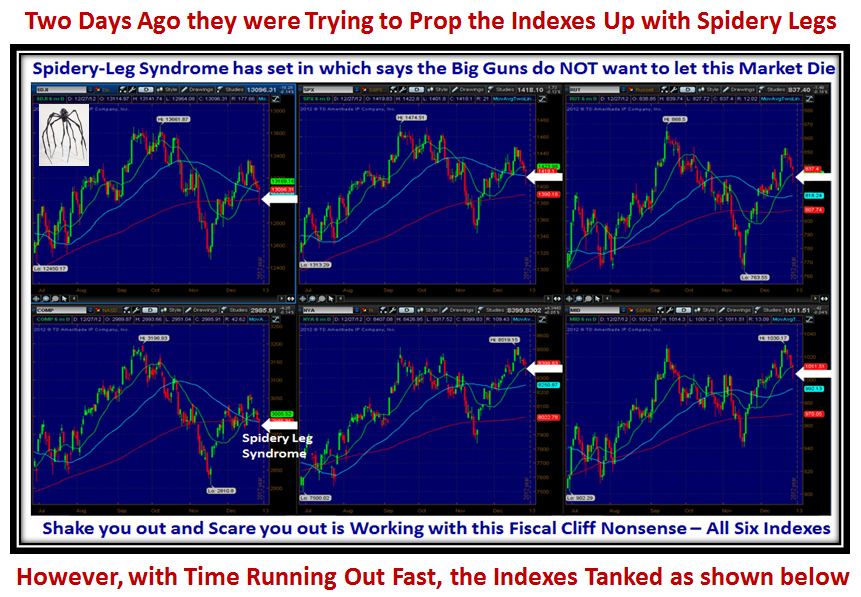
The Tell-Tale sign two days ago that the Big Guns were trying desperately to prop this market up was the complete reversal from a sharp drop on all Market Indexes to finish with what I call Spidery-Leg Syndrome where there is a long tail on all the candles for that day:

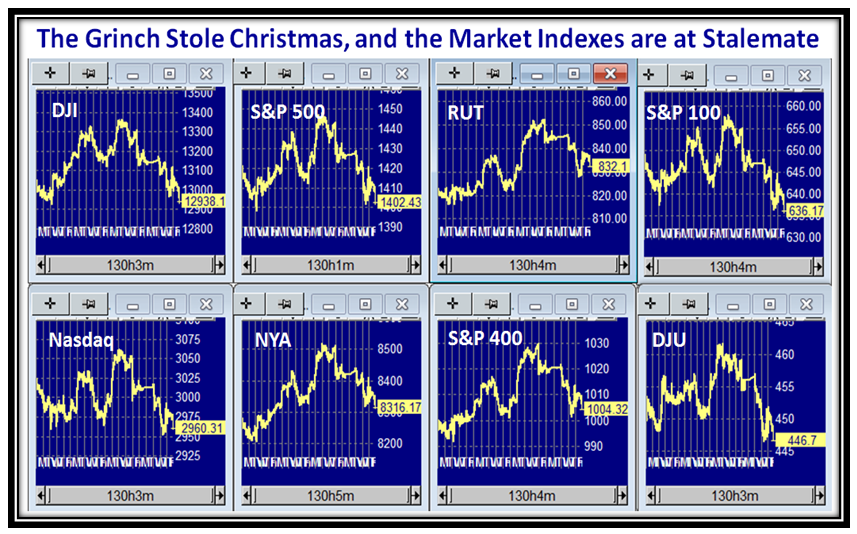
Then reality set in yesterday, when the rumors persisted that the powers that be were deadlocked and the Markets all took a dive of around three Buckets down for most Indexes on %B, though on light volume.  This indicates that we await Monday’s News before we see the floodgates open or there is a sudden burst of energy to the upside during the half day of trading, when most have already packed up their troubles in their old kit bag and left to celebrate the New Year.  The odds favor  a continued decline at this late stage of the game:

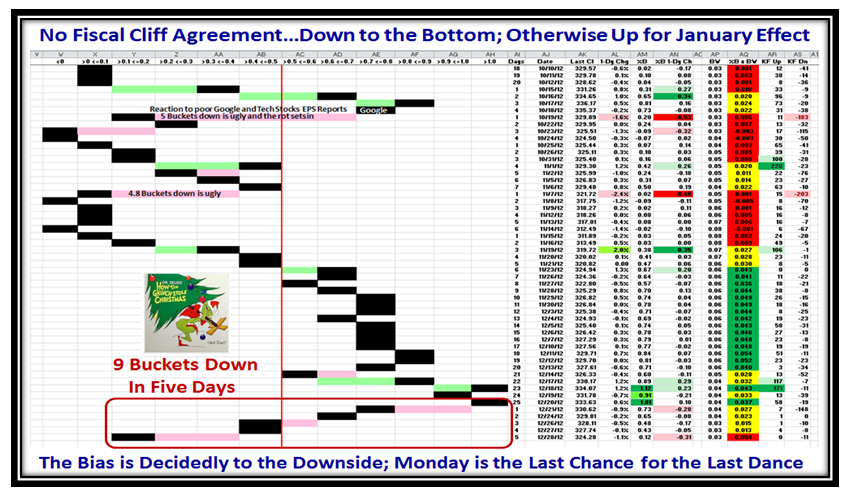
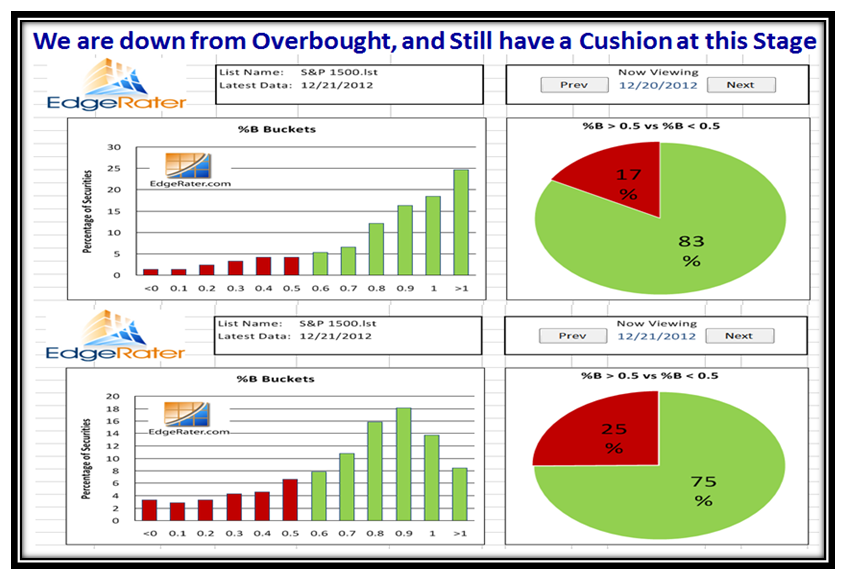
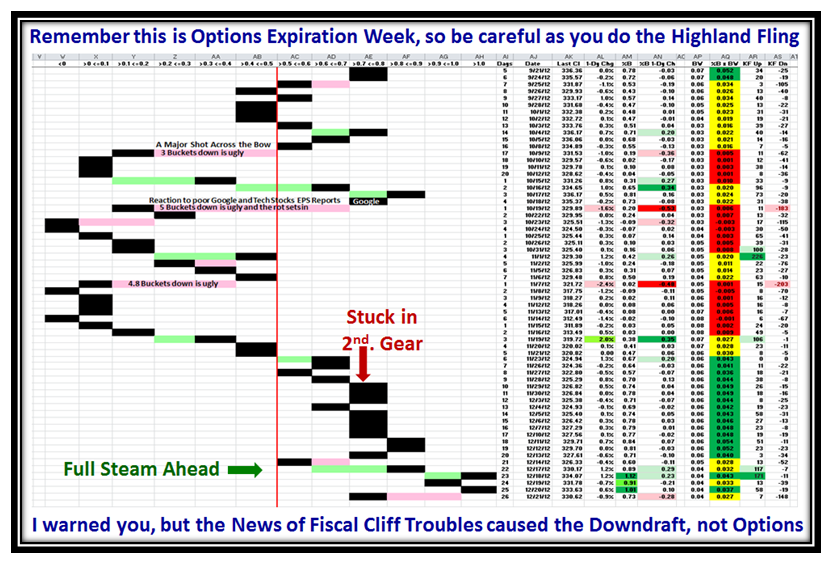
Even the brightest of optimist’s will admit that nine buckets down in five days suggests more pain to come:

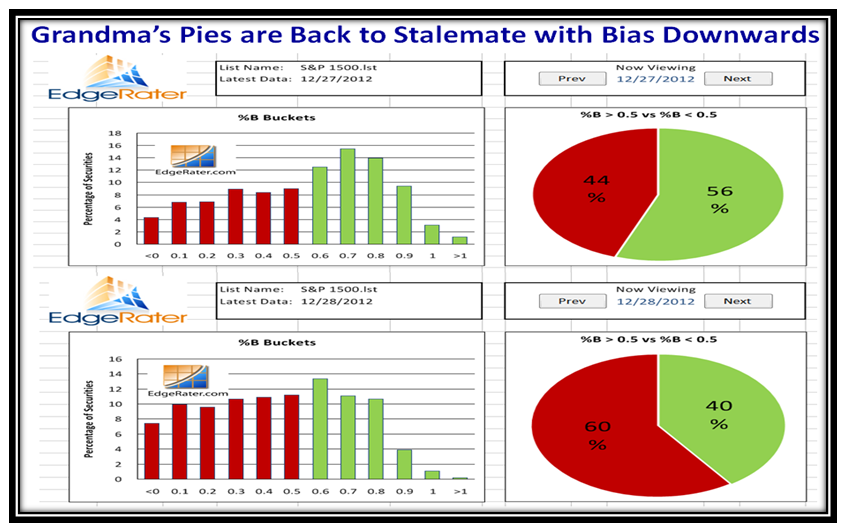
Likewise, Grandma’s Pies suggest the Bears have the upper hand as we switch to 60:40 red over green in one day:

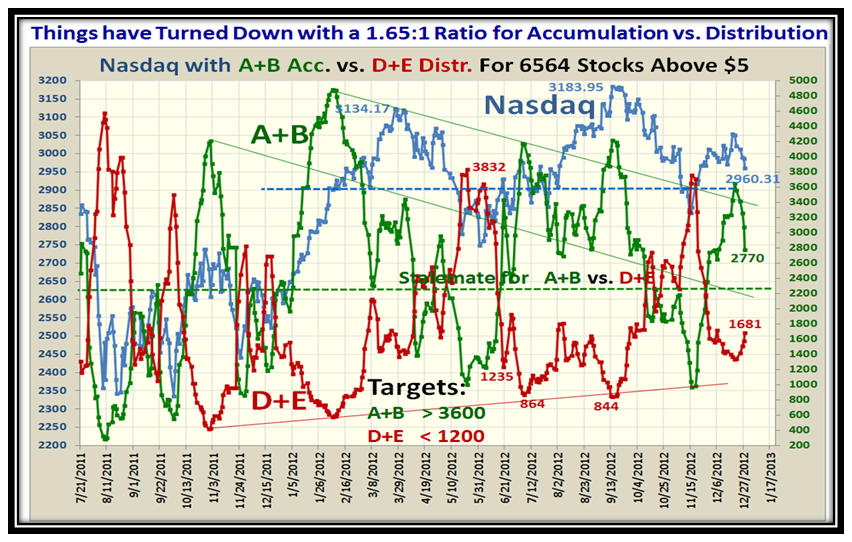
The lagging Indicator of the Accumulation vs. Distribution Ratio is also drooping down to 1.65:

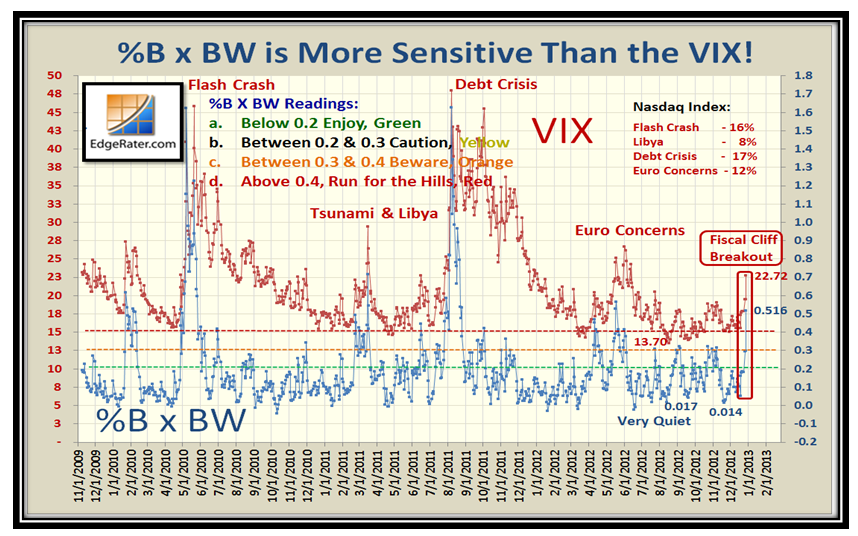
But of all of these Indicators we sit up and take real notice when %B x BW has an Upside Breakout on the VIX:

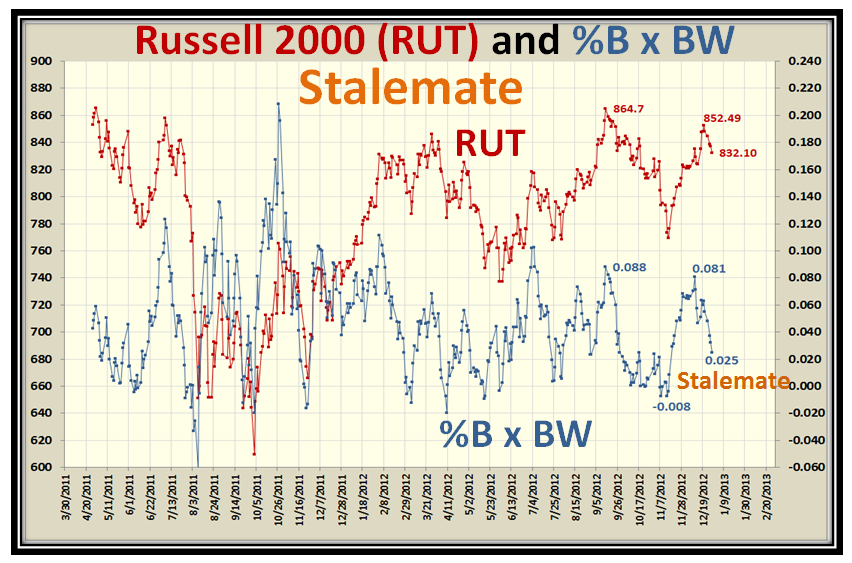
To confirm the predicament the market is in as we toddle into the uncertainty of the new year, we always look for a push up in the Small Caps as defined by the Russell 2000 (RUT) with the so-called January Effect and it is drooping:

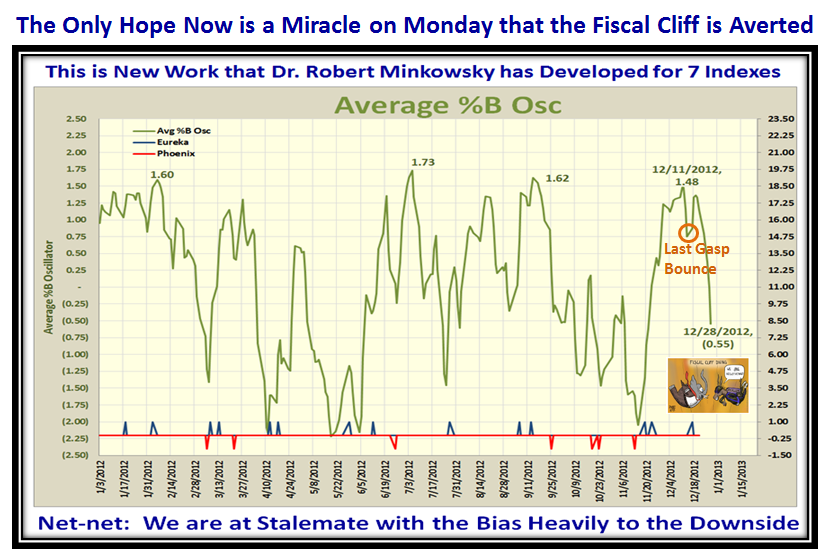
…And last but not least we have the new work of Dr. Robert Minkowsky which shows promise when we look at the Normalized Average %B Oscillator for seven different Market Indexes in that we must wait for a potential last gasp bounce at 0.75 before the Markets tank.  With the current reading of (0.55), we should expect to trundle down to at least (1.375) before there is hope of a Bounce Play.  Note also that when there is exhaustion to the downside signified by a reading of (<2.00) for an oversold condition, we should expect a new rally to commence with two Eurekas within a few days of each other.  Meanwhile we practice “Fiscal Cliff Diving”!

So, let me wind up this story for the old year as the HGSI Team wish you all a Happy New Year as we sing “Hi-Ho, Hi-Ho as off the Cliff we may go” to bring in the New Year…2013:

Best Regards to You and Yours,

Ian

Stock Market: Clowns are Back!

Sunday, December 23rd, 2012

Most people have given up investing until this Fiscal Cliff nonsense is behind us.  The Clowns are Back:

I’ll make this short and sweet:

Friday was a 2+ bucket down day:

Seasons Greetings, thanks for your continued support and all Best Wishes for 2013 from the HGSI Team…George, Matt, Ron and Ian.

Enjoy this wonderful video of the Drifters…just click on the link below;  then, when the video is finished, hit the return arrow at the top of your browser.

http://www.youtube.com/watch?v=ddVZOK_9UUI

Best Wishes to you all,

Ian.


Copyright © 2007-2010 Ian Woodward
Disclaimer: Commentaries on this Blog are not to be construed as recommendations to buy or sell the market and/or specific securites. The consumer of the information is responsible for their own investment decisions.