Ian Woodward's Investing Blog

Archive for the ‘Market Analysis’ Category

Stock Market: Waiting for Fiscal Cliff Fudge!

Wednesday, November 28th, 2012

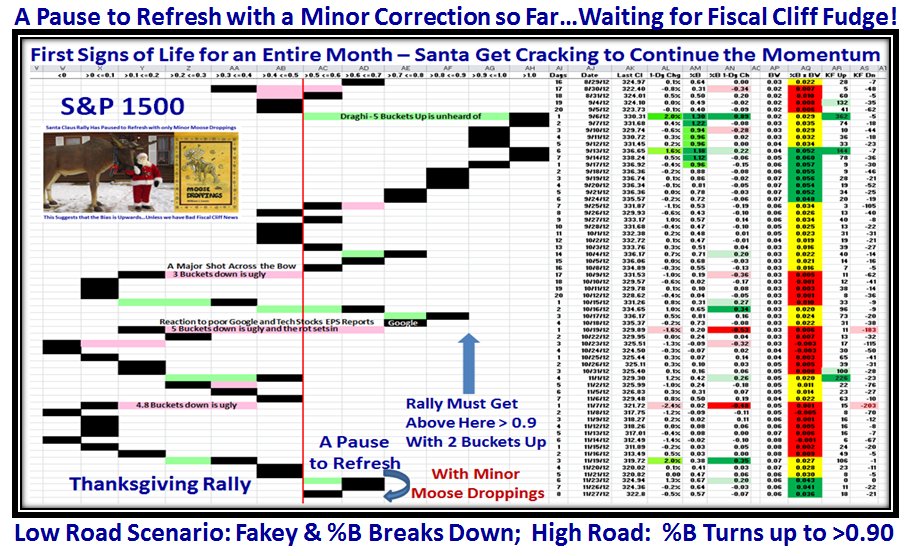
The Thanksgiving Rally is over, the Market Indexes have paused to refresh with the expected Minor Correction the last three days, and today we opened with a “Whoosh” to the downside only to recover and head on back upwards.  Expect lots of Game-Playing as we wait for Fiscal Cliff Fudge:

I warned you to expect a Pause to Refresh ala a Fakey and we got it yesterday.  Today is up as I write so now we need a strong up day for this Santa Rally to continue.  We had a ~35 point drop at the open on the Nasdaq only to recover to being up 13 points as I write this at mid-afternoon EST.

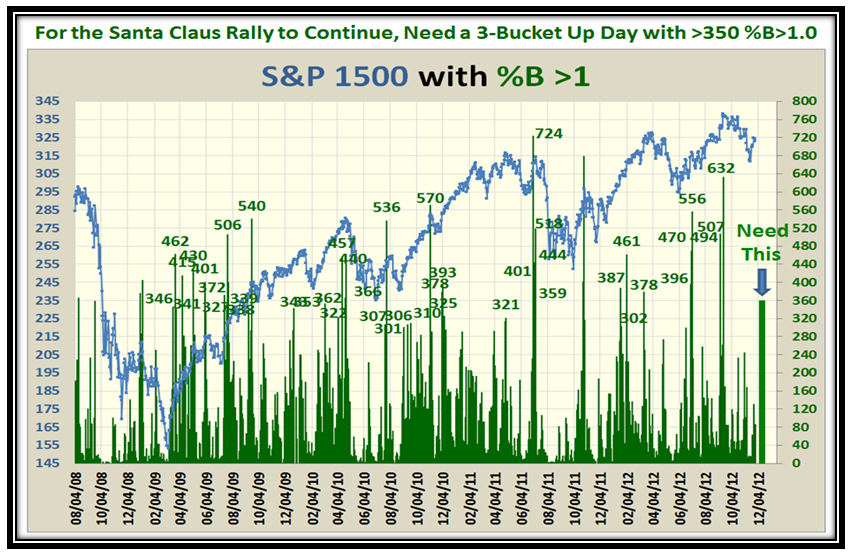
This is the kind of Game Playing to be expected right now, so be on your toes.  We need a 3-Bucket up day with over 350 S&P 1500 Stocks with %B >1.0 to kick this Rally into High Gear…Wishful thinking yes, but that is what it needs:

Best Regards,

Ian.

Stock Market: Hurry Santa Before the Grinch Gets You!

Sunday, November 25th, 2012

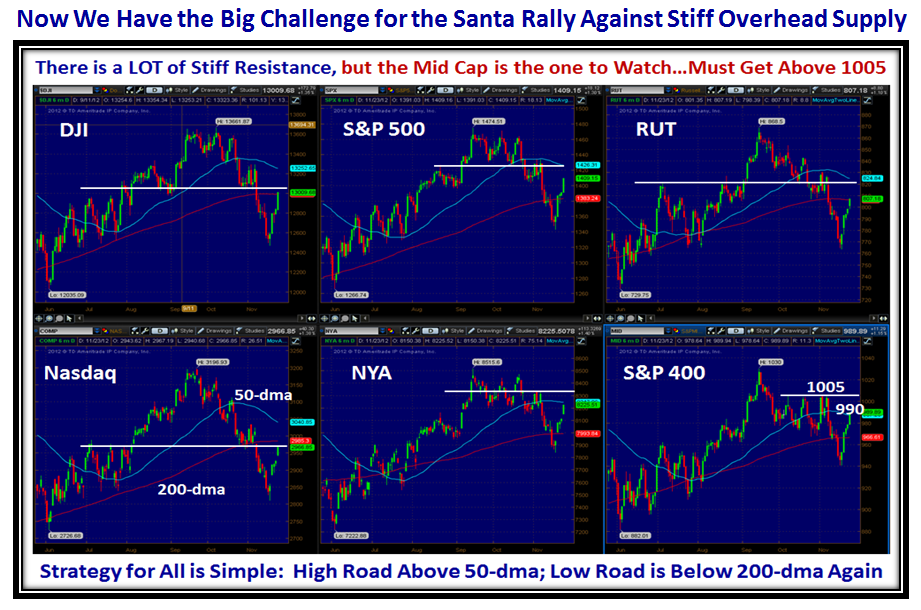
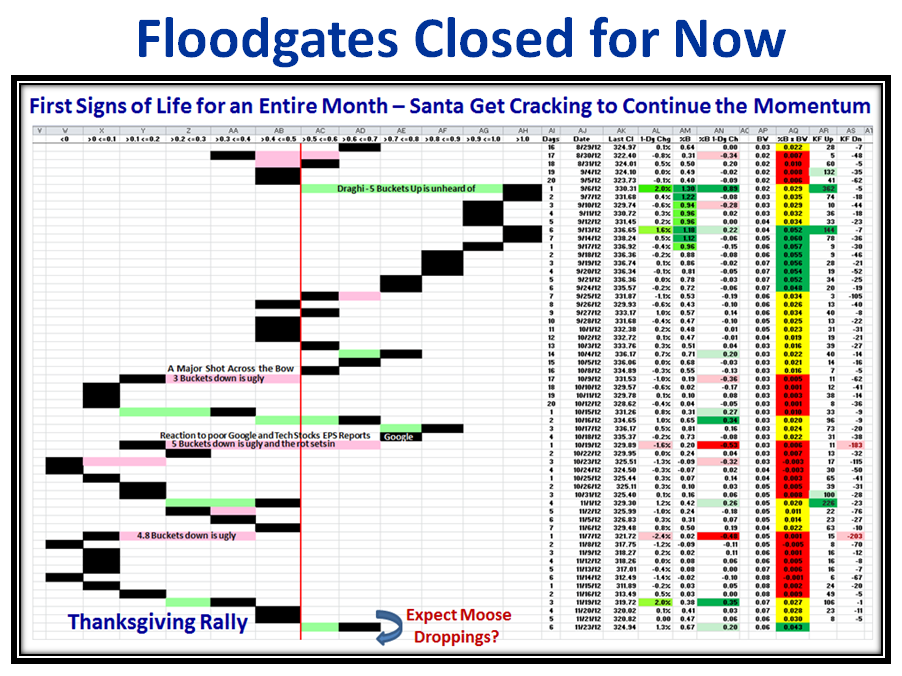
We had the usual Rally before and after Thanksgiving Day and now the big Question is “Where Next?”  This is usually the season when the Market has the Santa Claus Rally so that the Big Guns can ensure a decent Year-end result and secure their bonuses.  With the one month dismal drop of 12% in the Market Indexes, Santa must get cracking before the Grinch Gets him:

Why do I say that?  Because we are now at make or break time with the stiff resistance of Overhead Supply on all Indexes:

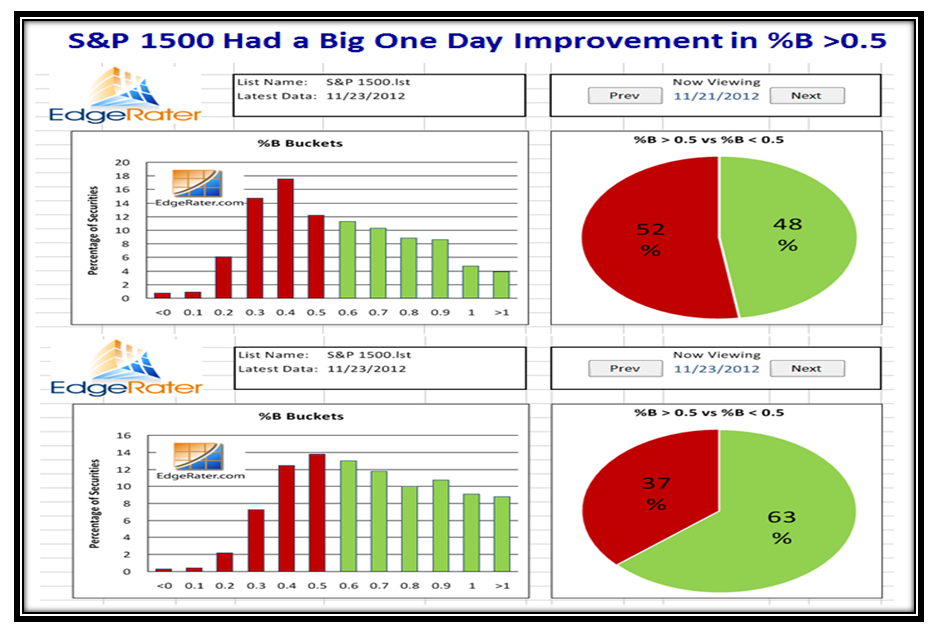
But now we have something to cheer about and after a dismal month there is hope for a new rally, with what I would call a “pseudo Follow Through Day” with a strong Eureka to boot, even though the Volume was very light…so don’t get too excited:

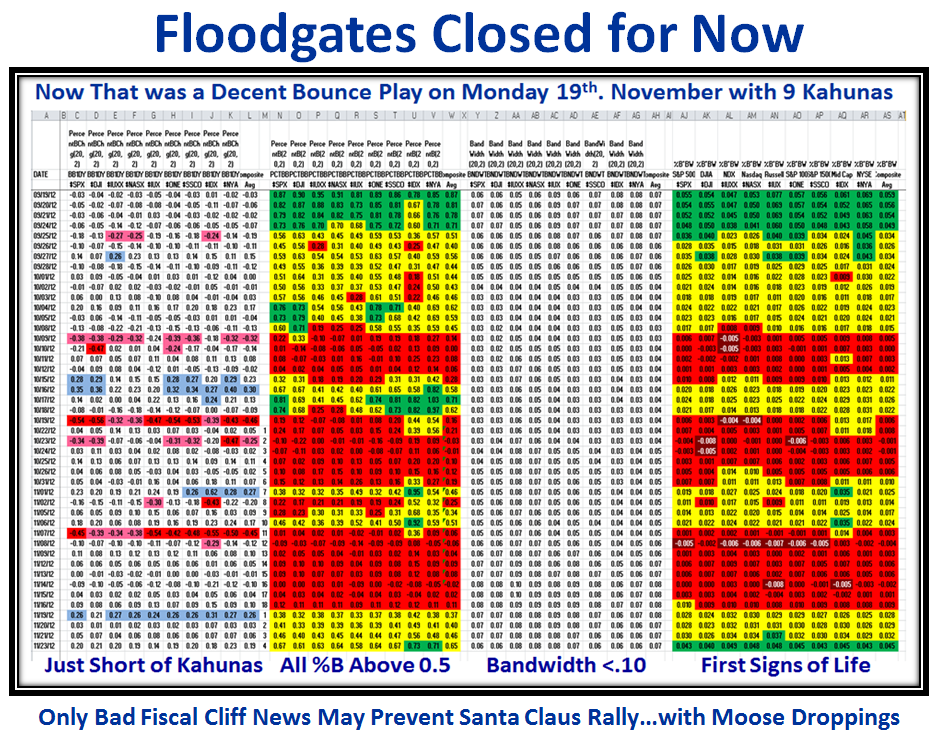
As a result, the Floodgates are closed for now as the %B parameters have started to show strength..we almost had Kahunas on Friday as shown on the bottom left of the next chart, where many of the %B 1-Day Change readings were >= .20.  Also note how the %B is >0.5 and Bandwidth is <0.10 for all Market Indexes, so %B x BW turned Green for the first time in 2 months!

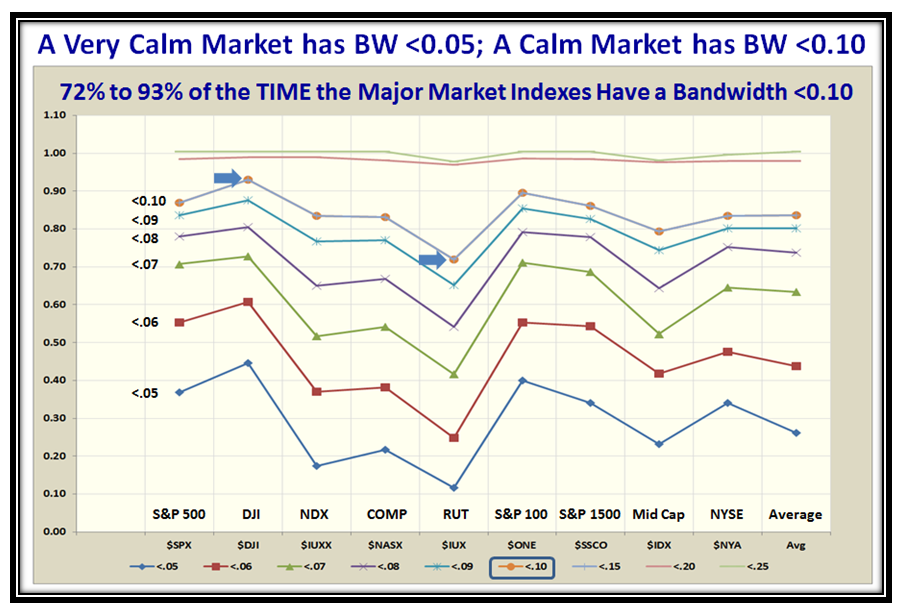
Now here is new research hot off the press worth its weight in Gold!  It shows the statistics for a Very Calm Market and Calm Market with %B for all Major Market Indexes being <0.05 and <0.10, respectively.  On average, it is more than 80% of the time.  When the Market gets dangerous the floodgates open when the Bandwidth first gets above 1.0 for all Market Indexes as I showed you in my last Blog Note.  Enjoy my Santa Claus early Gift to you:

This next chart shows we have had a decent Rally off the bottom in the last six days and we must now watch for a continuation or a pullback.  The extent of the move this next week either way will determine whether the Traditional Year End Rally is strong or is splattered with Moose Droppings!

Have a Happy!  Best Regards,

Ian.

Stock Market: Bulls Got an Early Thanksgiving Gift

Tuesday, November 20th, 2012

We have come around to that time again where we all celebrate Thanksgiving with our Families, and The HGSI Team send you our wishes for a Happy Thanksgiving and thank you for all your support.

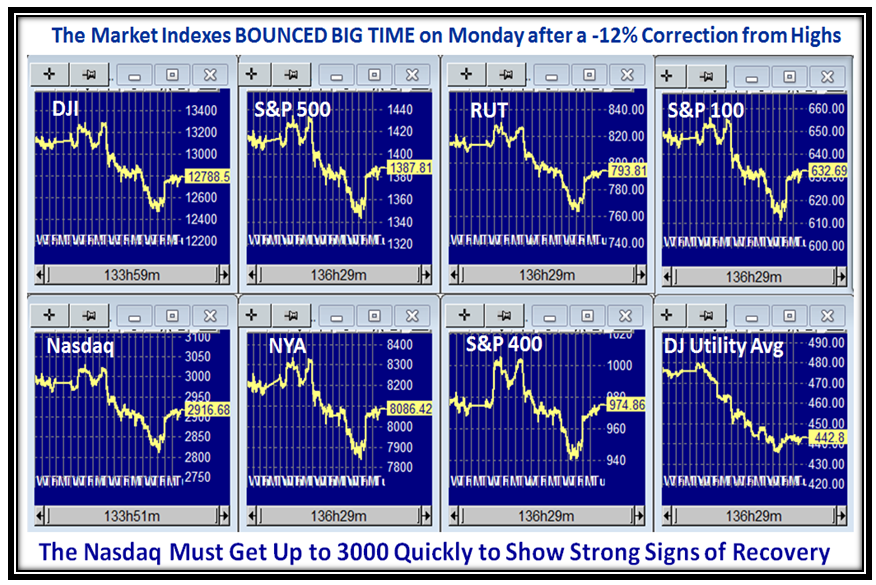
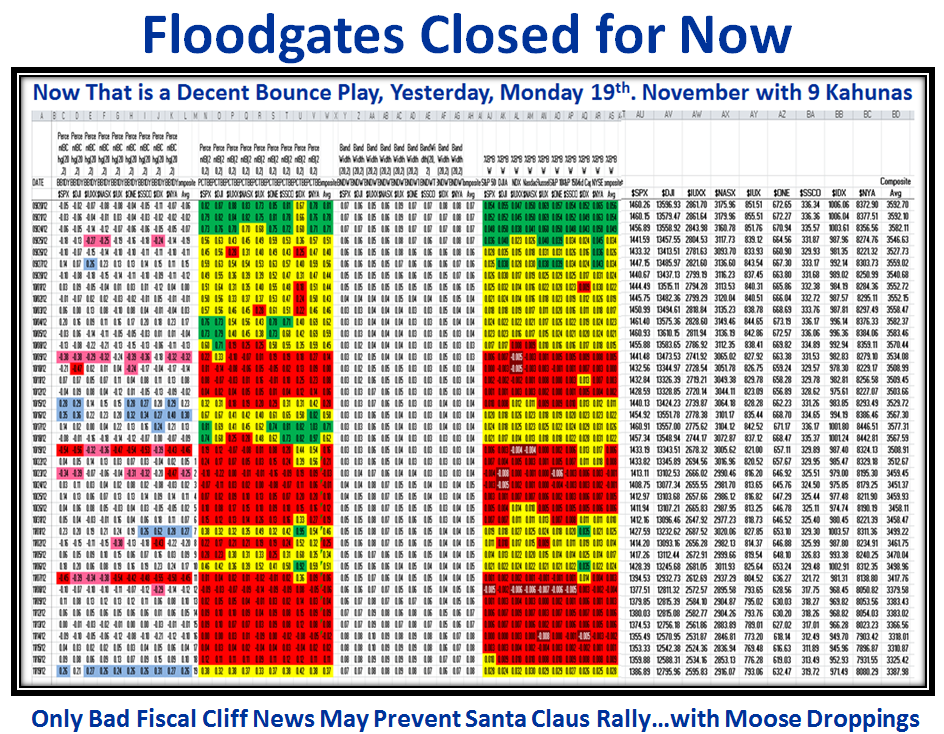
The Bulls were lucky to get a Strong Bounce Play on Monday with a 2% gain for many of the Market Indexes accompanied by nine Kahunas as you will see below that salvaged what was a miserable downward trek in the Market for these past two weeks, to round out a rotten two month drop from the Market Highs with a total loss of ~ -12%:
I hope by now that you followers have got into the swing of it to stay on the right side of the Market and to take heed of the Warning Signs I give you when things are about to trundle down.  For those of you who want a recap, I suggest you try my August 1 Blog for what has become a benchmark of what to look for when the Floodgates are about to open.  I have summarized key slides to give you continuity in the Story Line as I bring you up to date.

The biggest damage is done when we move from Capitulation to Despondency and Depression in the Psychology of the Market, and this is a reminder of the mood swings I often use:

The perfect Benchmark for understanding how to recognize that the Floodgates are about to open was over a year ago when the Global Concern was the Economic problems in Greece.  The following chart captures the essence of what to look for which as you will see from the chart is “5 Buckets Down on %B in one day”:
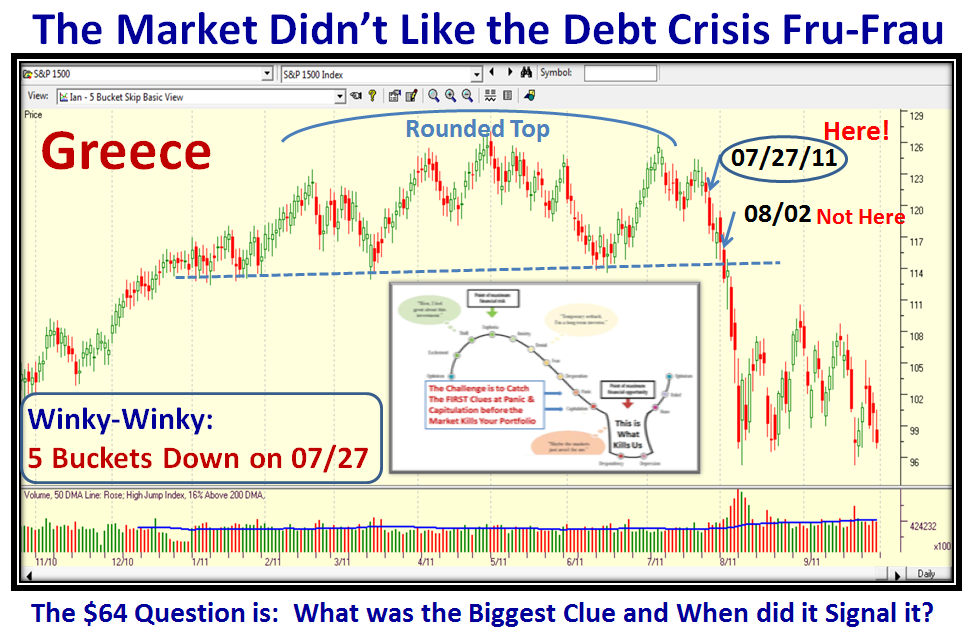
The net result in a matter of little more than a week was an approximate 17% drop which as the chart shows got the early warning signal on 07/27/2011, one week before other techniques called the usual Market in Correction.

That led me to look back in time to find other occasions when we had a  “5 Buckets Down Day” as shown in the next Chart:
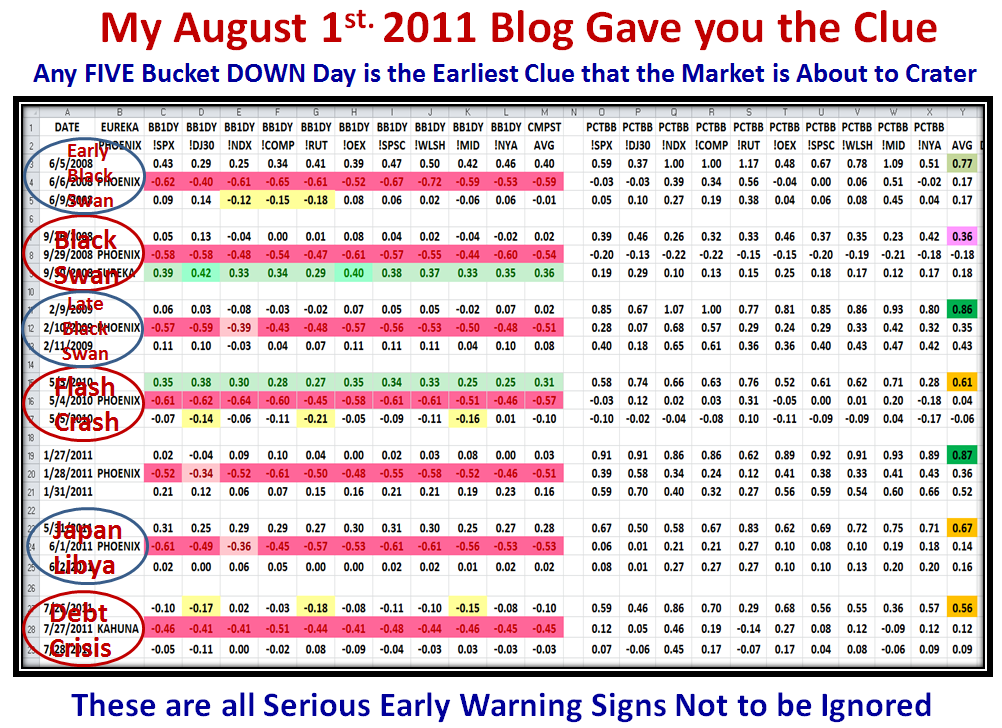
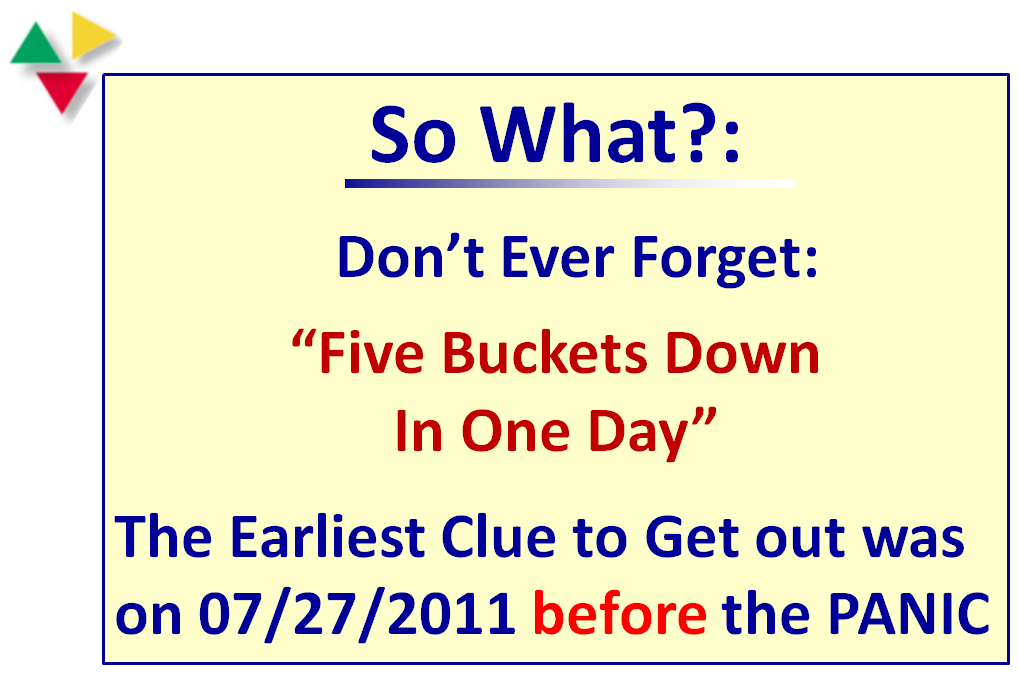
At that time, the Bottom line was never to forget “Five Buckets Down in One Day”:
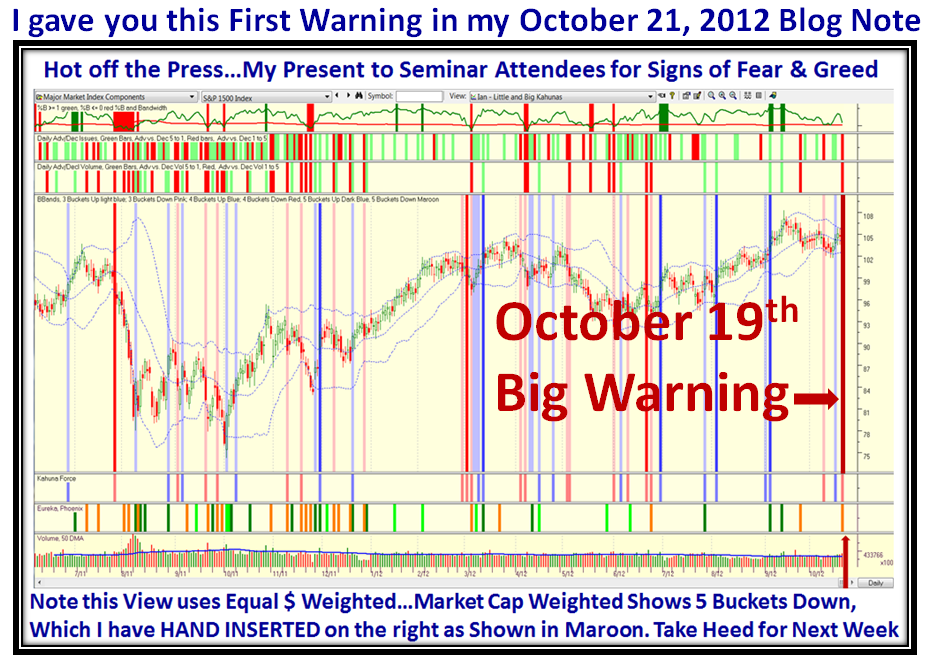
Now let me show you how we can expand on this to truly know when the Floodgates will open.  Let’s fast forward to over a year later when in my blog note of a month ago I showed you this chart with the Big Warning on October 19th.  It is important you review my last three Blog notes as they provide a substantial amount of background of the process and results:
The Bottom Line is that it takes three signals using Bollinger Bands to know when we are on a cliff edge and when the Floodgates start to break wide open.  So, let’s first look at our Benchmark for 07/27/2011 and then compare it to Now!
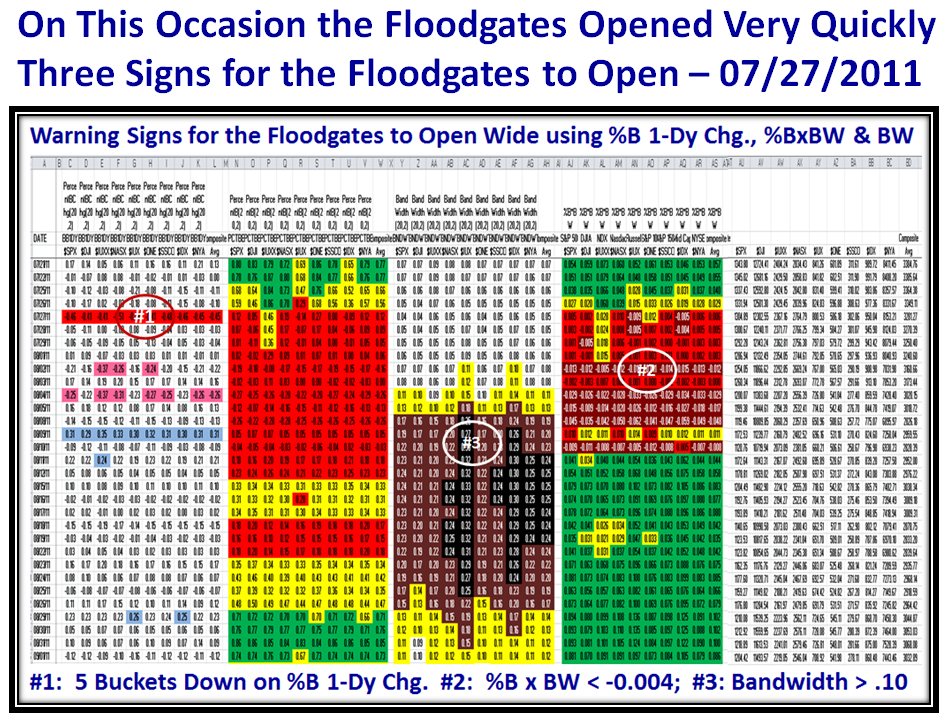
Don’t bother with trying to read the numbers, its the Color Formatting that is far more important.  On the left hand set of numbers is the %B 1-Day Change for ten Major Market Indexes. As you well know by now Kahunas up are in Blue and Kahunas Down in Red.  Note that we essentially had approximately 5-Buckets down on all indexes on 7/27/2011 as I previously mentioned.  This and succeeding charts are produced on EdgeRater:

Now look across to the 4th set of numbers, i.e., the %B x BW which is dubbed the Woody Indicator and notice #2 in white in that set of columns where all the Indexes are Less than -0.004…that is the second sign.

The third sign comes when the third column from the left, i.e., the Bandwidth opens up to >0.10 on most Indexes and then turns ugly as shown by the Brown and Black cells.

Note how all three signals fired within the course of seven or eight days max! I’m sure you are wondering where we stand to date, so let me show you the picture as of Friday of last week:
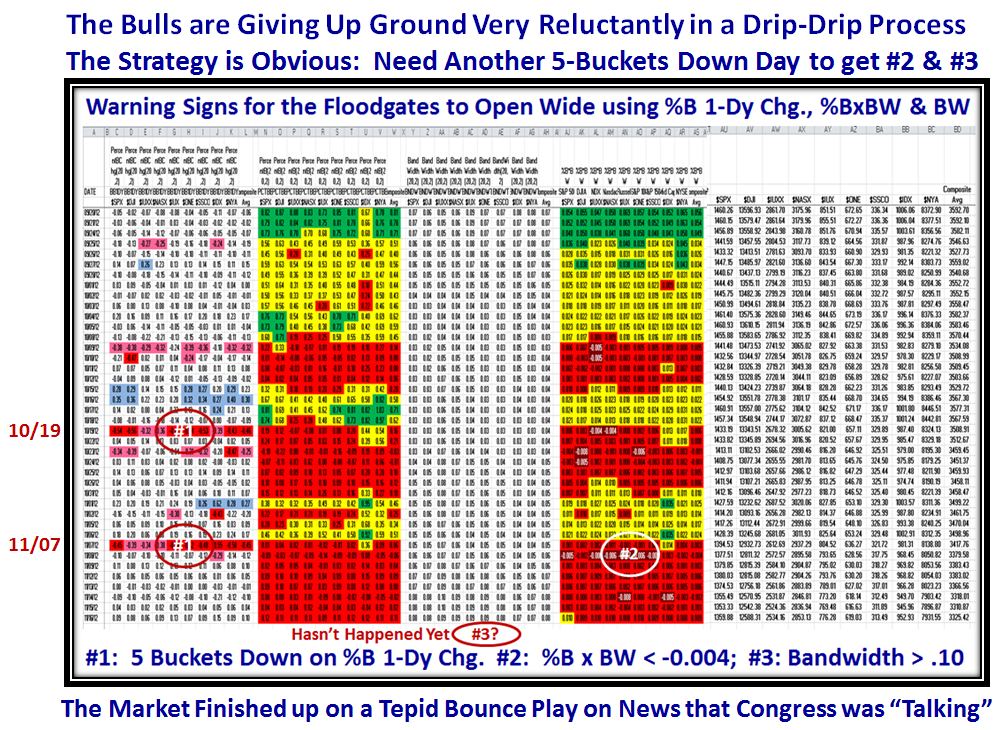
I’m sure you can immediately see the difference between the two charts, where the Bandwidth changing above 0.10 has not yet happened, and although we have experienced a 12% drop, it has been more of a drip-drip process rather than a burst of the floodgates opening.

Therefore, the final clue is the Bandwidth must expand rapidly to cause a Major drop of >16%.  Now let’s look at where we stand two days later, where you will recall we had nine Kahunas (blue) that related to an approximate 2% Index Gain as shown at the bottom left of the next chart:
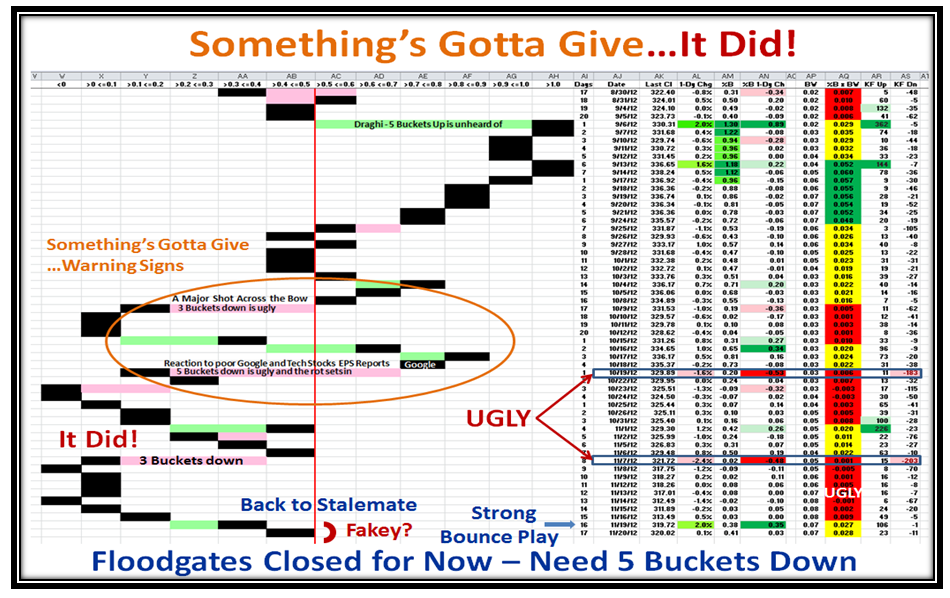
Finally, let’s look at our favorite chart which shows how the Bounce Play has now brought the S&P 1500 back to the “Red Line” of Stalemate.  Now we wait to see if the Bounce Rally can continue to take the Nasdaq back up to 3000 or we have a Fakey and fall back one more time into the doldrums:
All the very best to you and yours as you enjoy each other at this special time.

Ian.


Stock Market: The Market Index Cliff

Friday, November 16th, 2012

I am in the thick of writing the Monthly HGSI Newsletter, but here is my Summary Overview which I hope will encourage you to get a Free Trial of the Software and the Newsletter.  My friend in India who recently got the software is telling all his friends what they are missing, and I can see my friend in Qatar is also cooking up a storm in anticipation of what is to come.

Overview: 

We had an exhilarating three day Seminar, learned a lot from each other and had good fun.

This Month’s Picture shows you the focus I have given you on the Market Index Cliff and described in my most recent three Blog Notes starting on November 7th.  This Month’s Newsletter develops the story around this picture and shows you how we can get the earliest warning that trouble is brewing by understanding the implications of the Woody Indicator:

The $64 question is “Do the Floodgates Open Wide and Panic Sets in or do we get a Big Bounce Play to stem the tide?” So far it has been a drip-drip process down and it is Ugly.

Besides discussing the High and Low Road Scenarios, my theme for this month explains in detail the logic and results for identifying impending Market Cliff Hangers and when to protect your Nest Egg when the signs are more than a passing small correction.

Ron will devote his piece to One Step Scorecard Views, as those attending the Seminar enjoyed when Paul Reiche suggested this was a fruitful way of ferreting for worthwhile candidates. The Round Table discussion is on Tuesday, 20th October at 4.30pm EST, where we will as usual expand on the ideas in the newsletter.

Best Regards,

Ian.


Stock Market: Floodgates Open or Bounce Back? Part 2

Sunday, November 11th, 2012

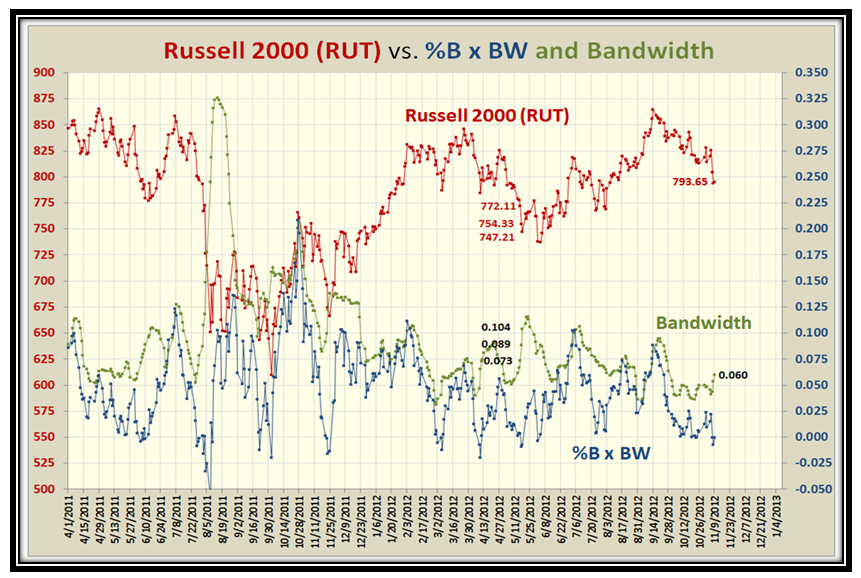
So it seems you like this stuff from the feedback I am getting.  Here are a couple of quick snapshots which will give you the “What If” should the Markets tank next week.  I have used the Russell 2000 (RUT) as the guinea pig so see if this will help you.  I am NOT discounting a Bounce Play from this Oversold condition…but the object of this lesson is to see if the pointers I give you work SHOULD the Market go down.  Then at least we will FAITH for the next time if not this time!

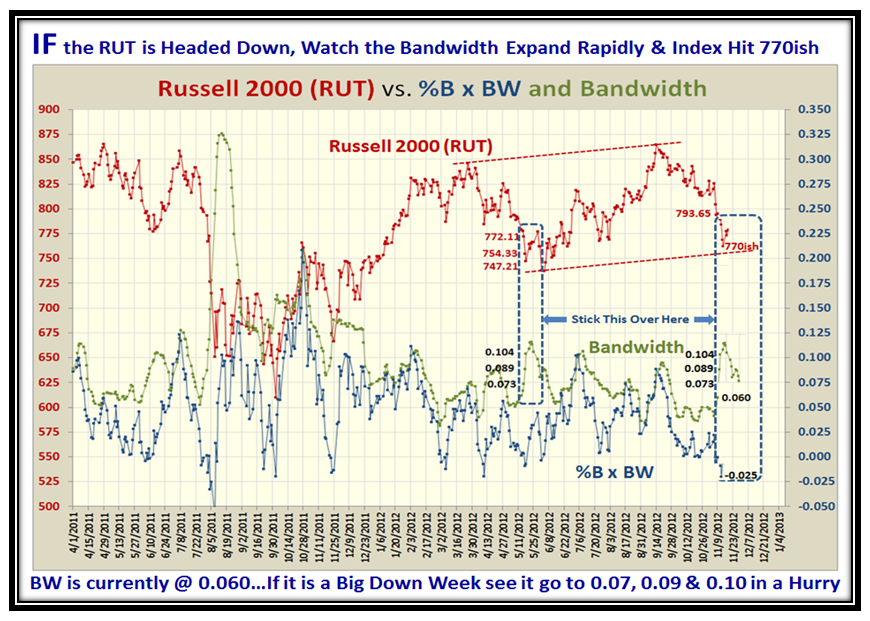
Many moons ago I taught you that when the Market Drops rapidly, the floodgates open on the BANDWIDTH which rapidly gets wider, so that’s the thing to watch.  Here are the three steps it took when it was at a similar (not identical) point in time in mid-May 2012, when it rapidly moved up to 0.073, 0.089 and 0.104 in three days, while the RUT lost 25 points in three days as shown:

You know by now that the trick is to lay that same picture on “now” to see what to expect at this stage given the same move when playing “What If” games:

The net-net result is to expect 770ish if it is a big down week.  Now, I am no soothsayer, but you get the message.  The all important point is that in times like these when things are on a cliff edge, it is the change in Bandwidth that gives you the big clue day to day.  Of course they will try to hold the Market here, but if the floodgates start to open these last two Blog Notes should be your guide! Watch the Bandwidth 1 Day Change, and the %BxBW as I showed you in the last Blog Note.

All the best,

Ian

Copyright © 2007-2010 Ian Woodward
Disclaimer: Commentaries on this Blog are not to be construed as recommendations to buy or sell the market and/or specific securites. The consumer of the information is responsible for their own investment decisions.