Ian Woodward's Investing Blog

Archive for the ‘Market Analysis’ Category

Stock Market: “V” Bottom Market Has Fangs

Sunday, November 9th, 2014

A Month ago we had utter turmoil in the Market and now we are into New High Territory.  Be careful as this market has Fangs!

V Picture

After a “V” Bottom, this Market has been very strong and all Indexes are back into High Territory; this market can go higher but is due for a Pause:

V Indexes

The move this month has been remarkably strong coming off a “V” bottom, and now the rally is 16 Trading days long, so a bit long in the tooth:

V Pat

In the last two years, there have been only five occasions that the rally has been higher than 16 days, so we must look for a correction soon:

V Drummers

If the pullback in the S&P 1500 has %B stay above 0.7, the Market will remain healthy, otherwise watch out below:

V Percent B

Five weeks ago we were in the depths of a 10% correction and potentially going lower, but to our amazement we pulled out with a “V” bottom:

V Pies at bottom

…And a month later we are into a very Strong move with %B above 0.5 around 90% for days:

V Pies at Top

The Jobs Market Report added to the enthusiasm and kept the Market up with yet another Month of >200,000 jobs, which is encouraging:

V Jobs

…And here is the long term view from 2011 to now:

V Jobs 2

Enjoy and Best Regards,

Ian.

Highland Fling or Snakes & Ladders Market?

Thursday, October 23rd, 2014

As I write this on Thursday Morning, the Rally suggests we are into a Highland Fling for now!  We had a great Seminar which offered these two alternatives:

Highland Picture

The Market Indexes had all produced a “V” Bottom and were either headed down for a retest of the lows or continue up.  This morning’s strong Rally suggests we go higher before we pause to refresh:

Highland Indexes

The Canaries are half strong and half sluggish, but holding at their support levels and higher:

Highland Canaries

The BRIGHT spark in all of this to and fro is that we had an Eureka on Tuesday and as you can see from the chart below we also had an  ~Kahuna, with it only being off by 0.016 of a point…Close Enough for Government Work!  At the seminar I hammered on the need for an Eureka and two Kahunas within a week, and it seems as if our wish is coming true for a Rally to take off:

Highland Nasdaq

This next chart shows the tremendous sell off we had on 10/1/2014, and the following charts show the slow recovery until yesterday:

Highland Pies 90

Here is the struggle to recover the following nine days:

Highland Pies struggle

…And here is the Rally attempt two days ago after more struggle:

Highland Pies struggle2

This next chart shows the Utter Turmoil the Market Indexes have been through with the Bears in Control until today:

Highland Turmoil

This chart shows we should be into “Safe Territory” with %B by tonight:

Highland Pat

Here is a chart of the S&P 1500  showing more turmoil in %B below the Bandwidth:

Highland Turmoil2

Twelve Drummers Drumming continues to show it is a good short term measure of Rallies and Fades, and also Turmoil:

Highland Drummers

Finally, the S&P 1500 must hold at 440 and above or we head down again:

Highland 1500

Best Regards,

Ian.

Ticket for Staying on the Right Side of the Market

Saturday, October 4th, 2014

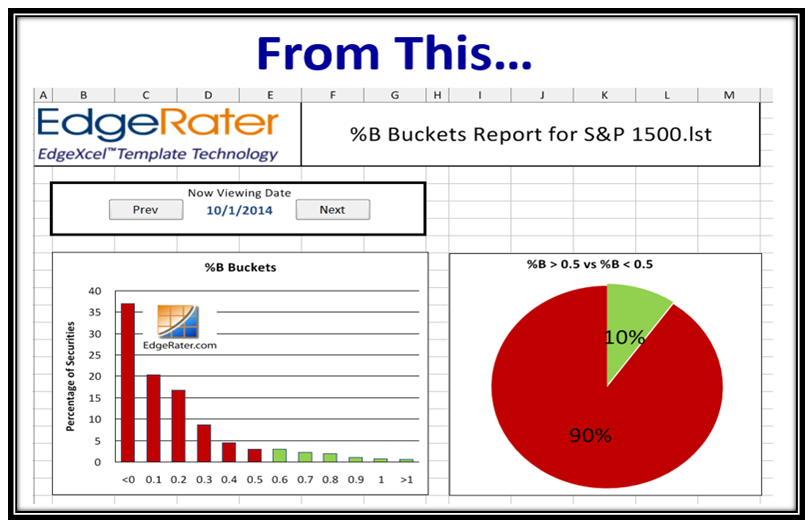
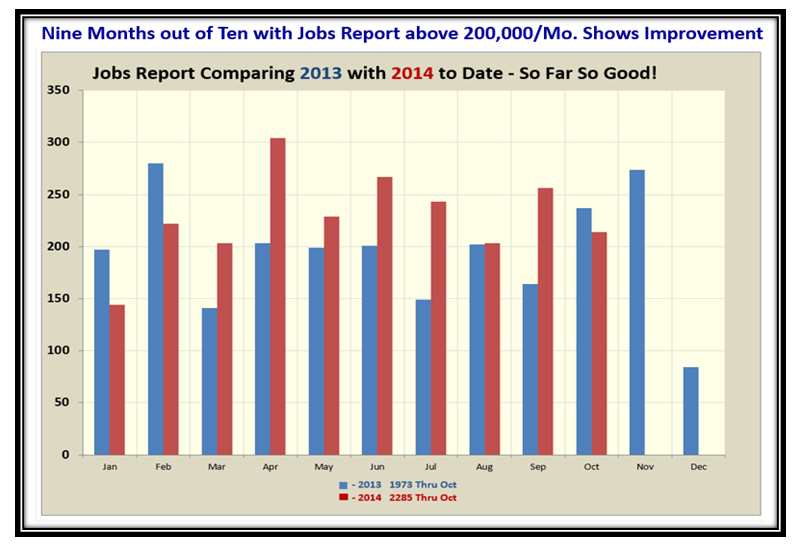
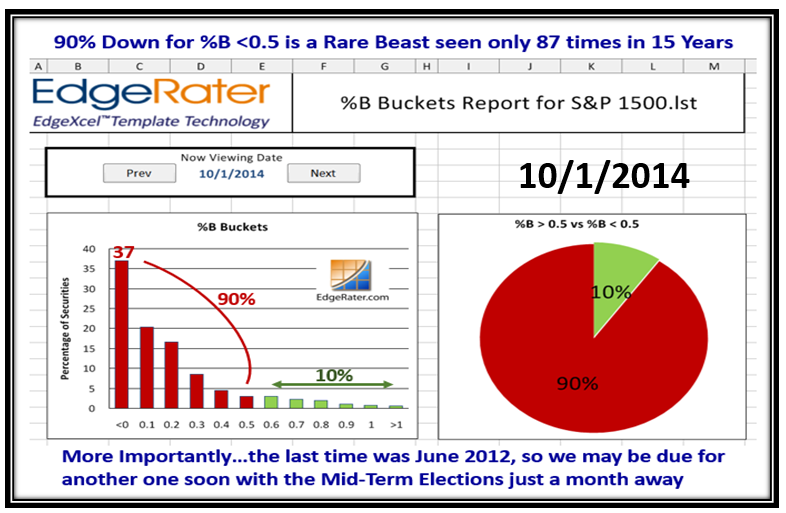
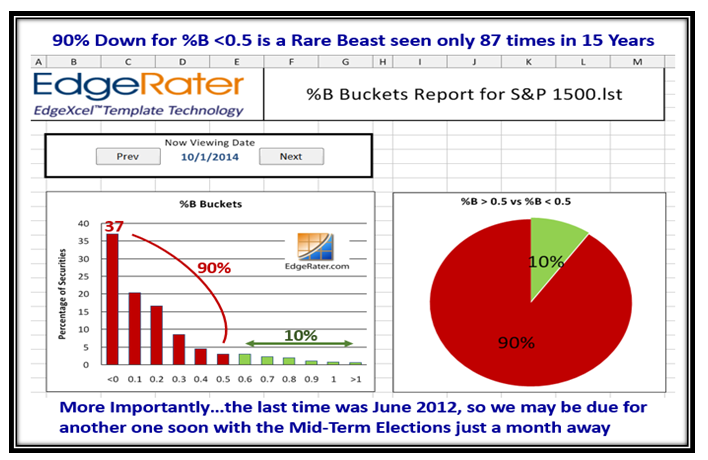
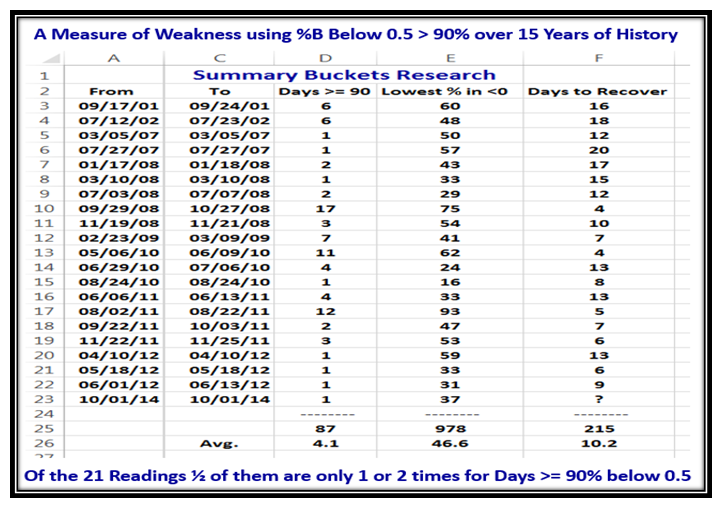
Finally the Market Indexes took a drubbing, first on 9/25 and again four trading days later on 10/01, which then produced a reading of “90” for the % of Stocks in the S&P 1500 with %B <0.5.  We have not experienced such an oversold reading since June of 2012, 28 months ago.  The last straw of an excuse to slam the Stock Market was the Ebola Breakout potential only to be saved  by the decent Jobs Report on Friday which once again produced ~ 250,000 Jobs in September.

I hope this Blog Note is timely for you as I have broken new ground on the 15 Year History of when the S&P 1500 gets slammed hard, where Grandma’s Pies and “Bucketology” are the key tickets for staying on the right side of the Market.   Of course we will cover all of this at the HGSI Seminar in Sunny Palos Verdes in two weeks time, where Ron and I look forward to seeing old and new attendees for three days of intense learning.

Grandma Picture

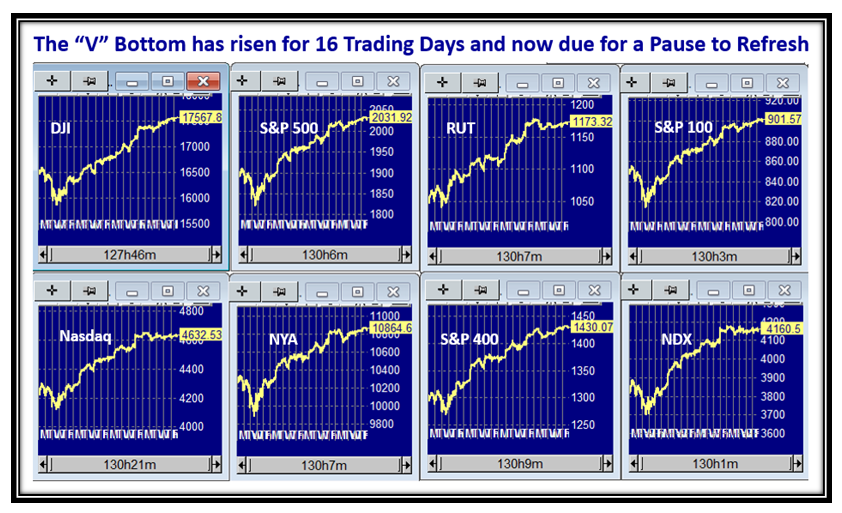
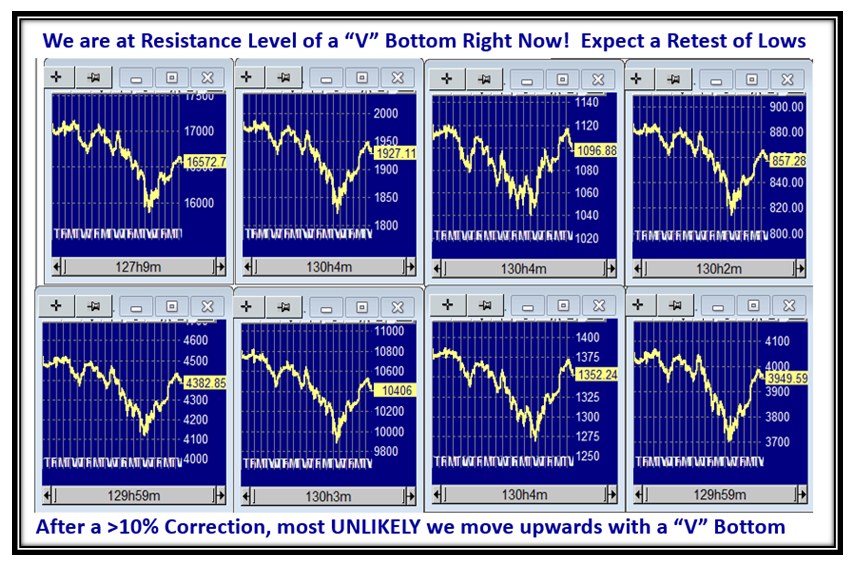
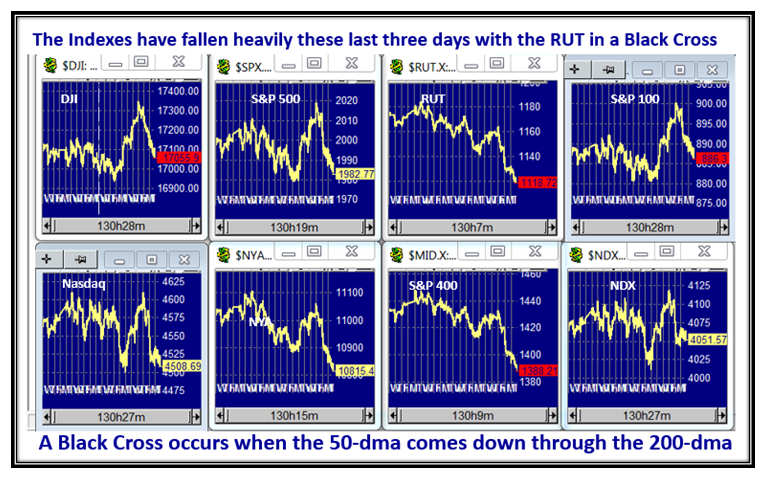
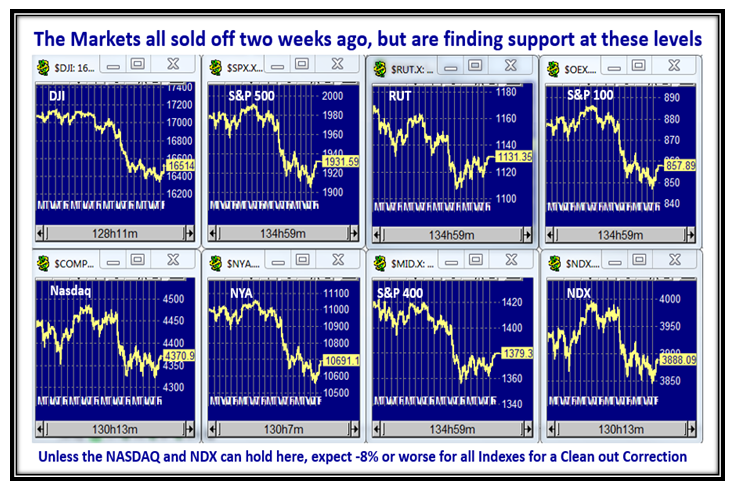
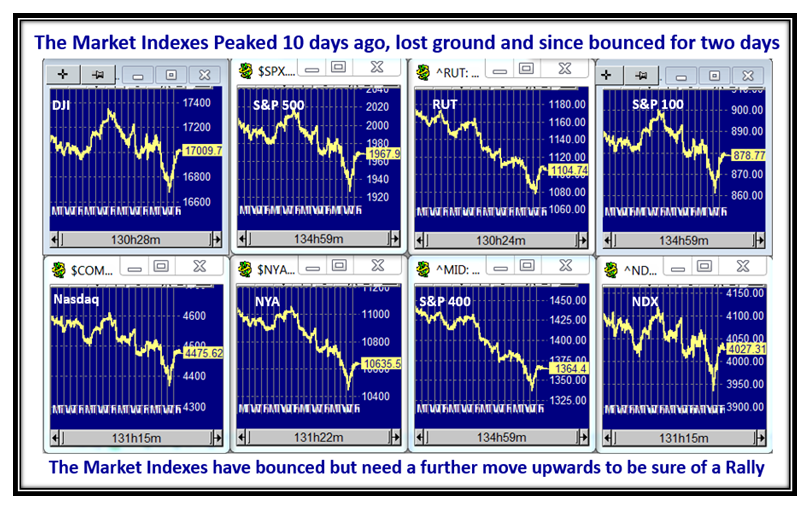
The Market Indexes peaked ten days ago, sold off with the Ebola scare and bounced back up from an oversold situation with the decent jobs report on Friday, which frankly saved the day for now for the Bulls.

Grandma Indexes

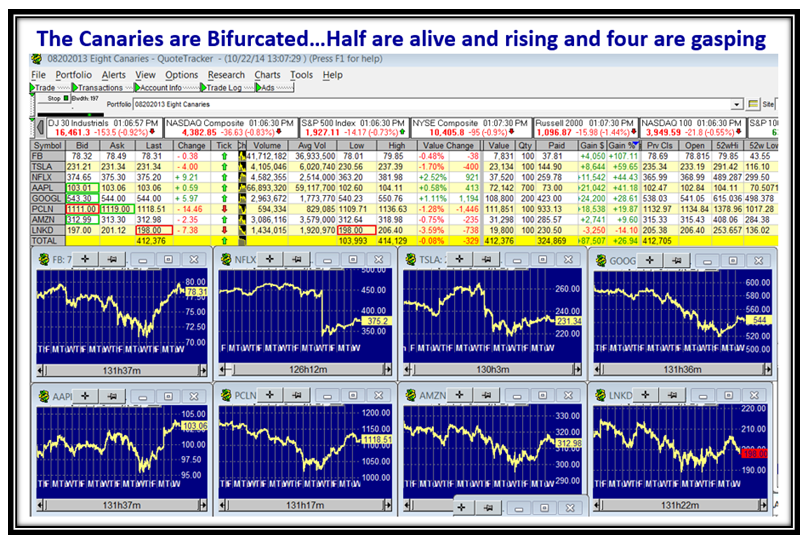
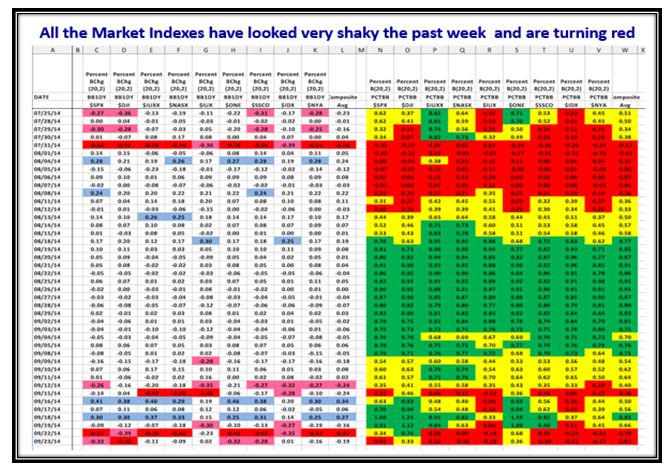
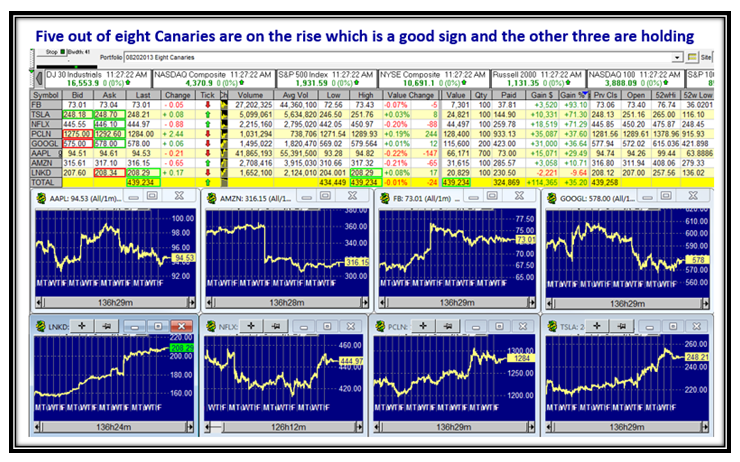
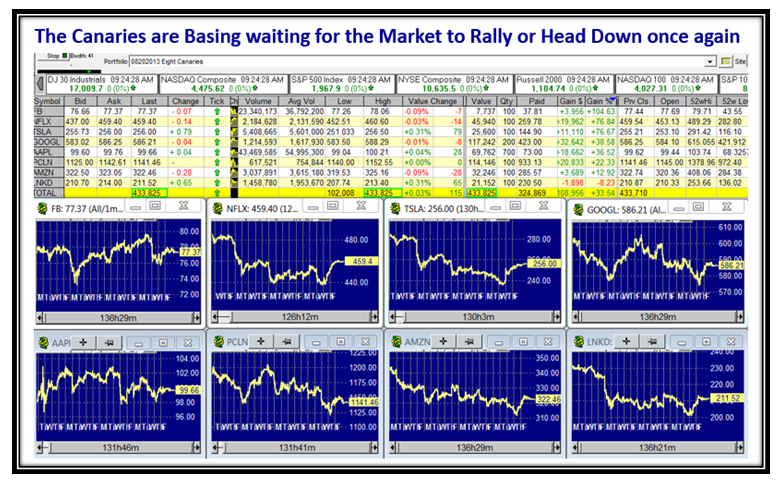
The Canaries are marking time and waiting for the Markets to show the direction rather than leading them upwards:

Grandma Canaries

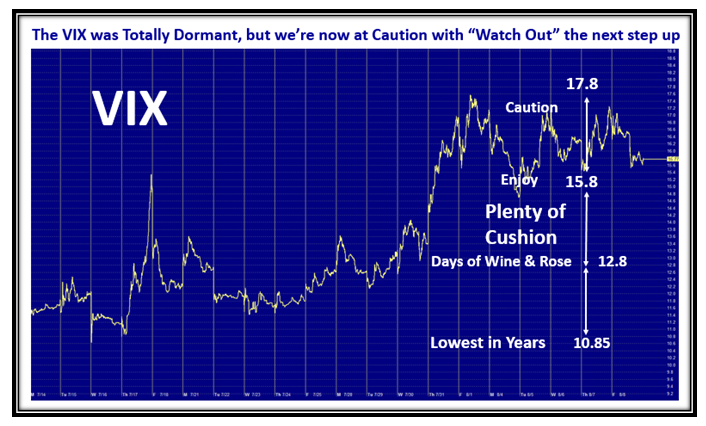
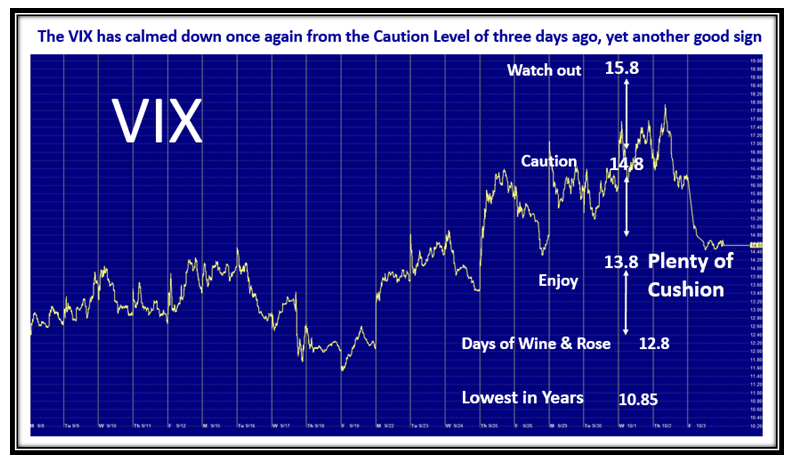
As expected, the VIX behaved counter to the Market Indexes, rose for ~10 days and then fell back to the comfort zone of around 14:

Grandma VIX

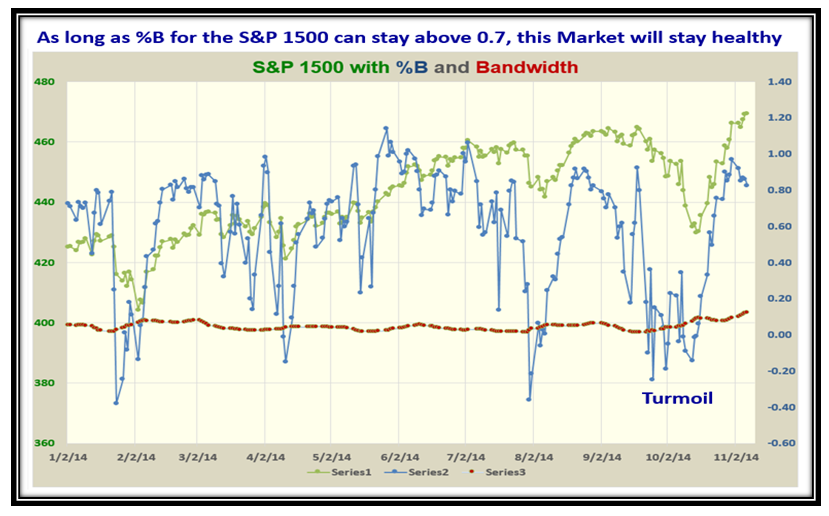
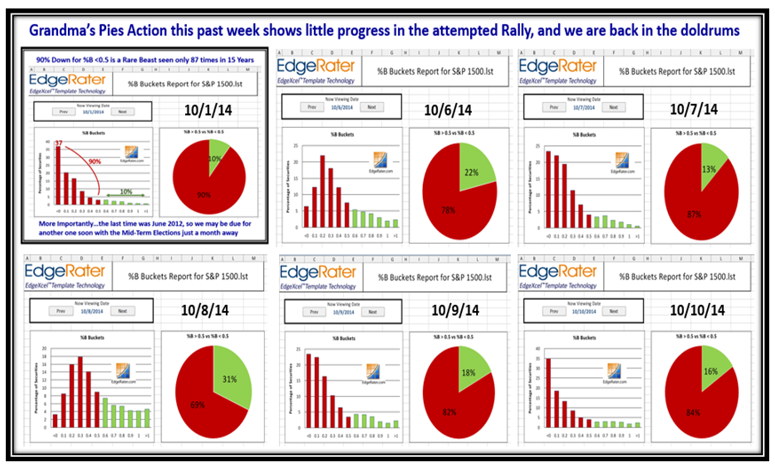
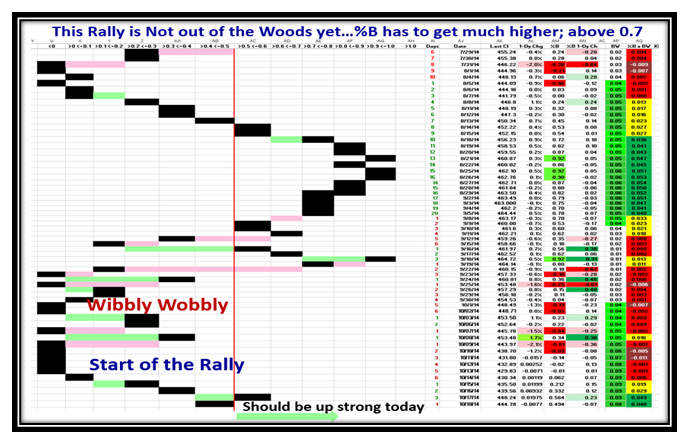
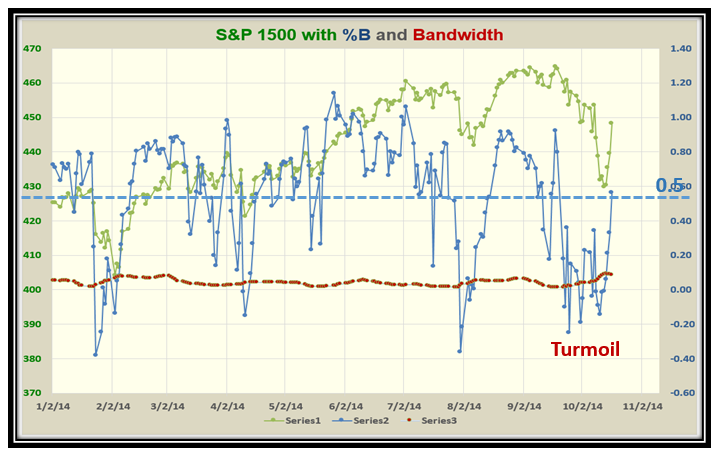
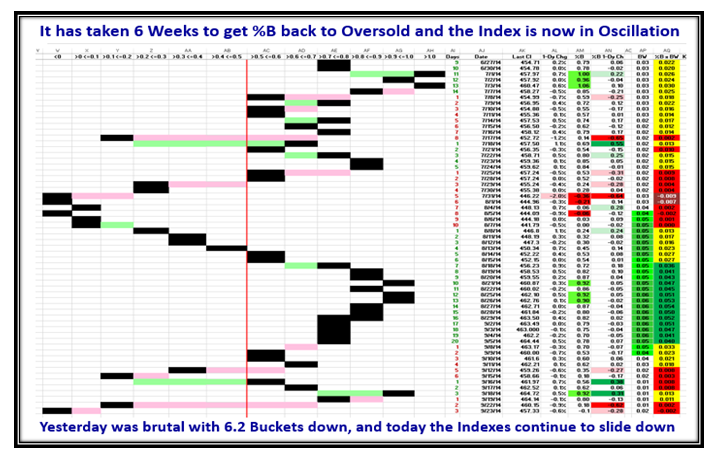
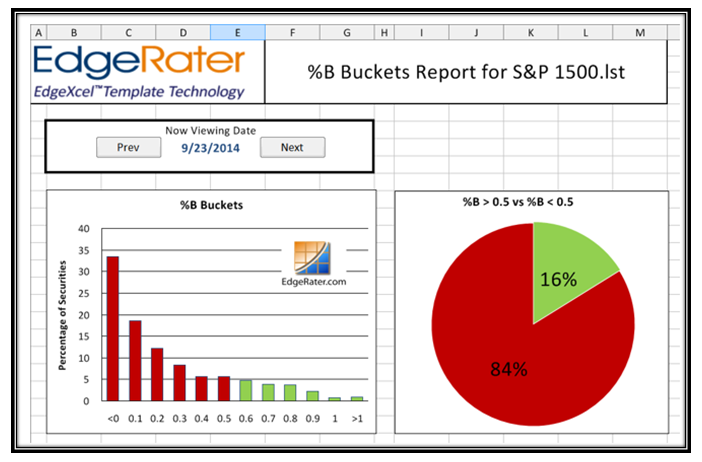
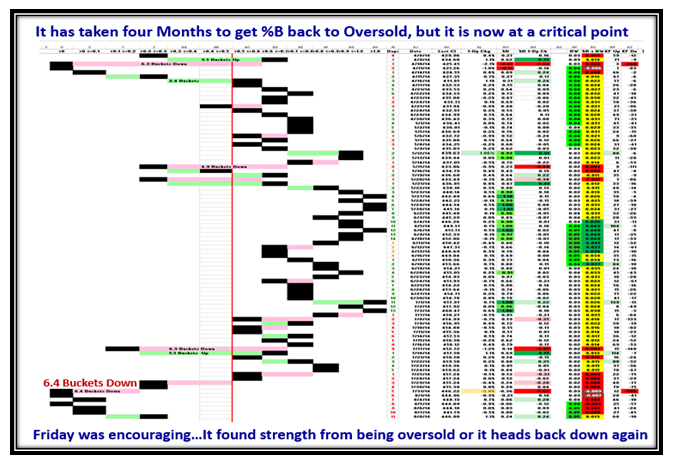
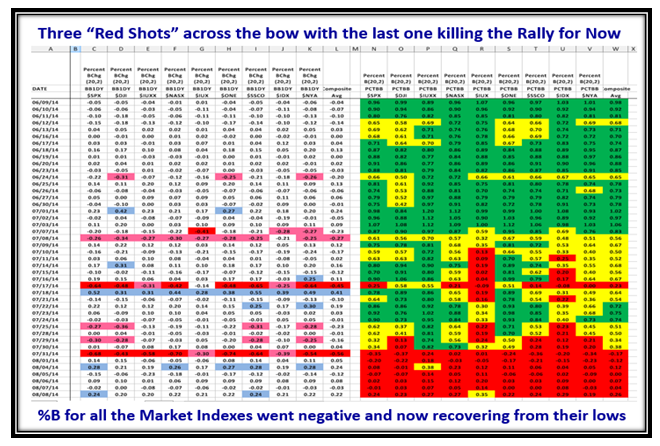
Note how %B for the S&P 1500 has meandered down these past ten days with a decent bounce on Friday.  We are by no means out of the woods:

Grandma Pat

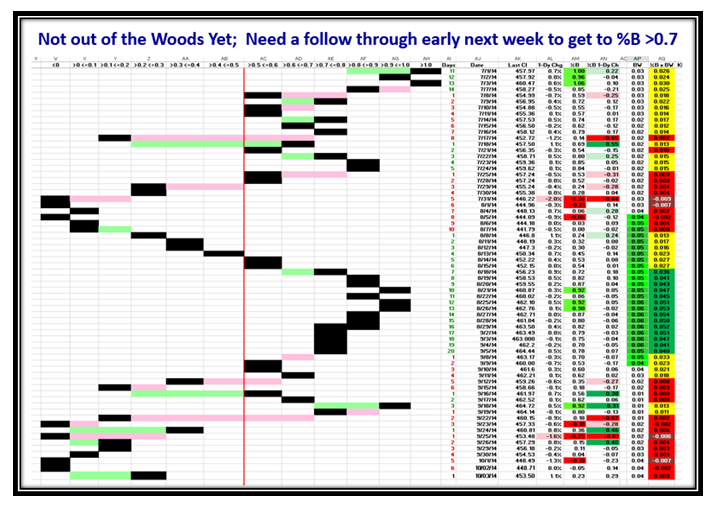
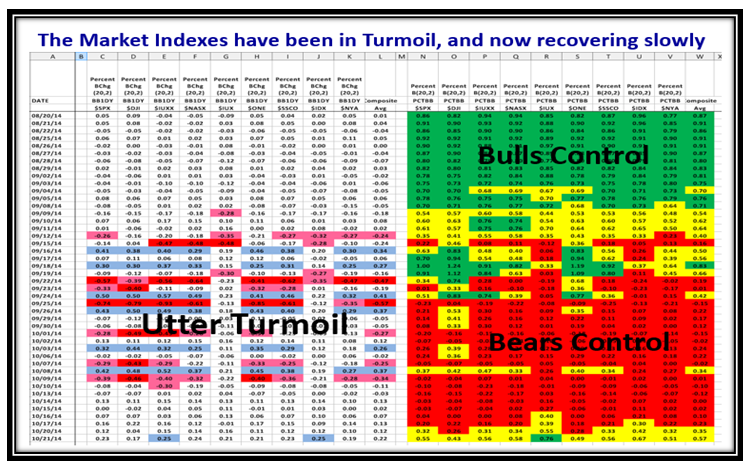
Bulls and Bears have had a good fight trying to get control…the Bears have it for now, but a further couple of up days are needed before the Bulls can have confidence that they are back in the saddle.  However, Oversold can also become more oversold should panic set in, so be very careful:

Grandma Indexes2

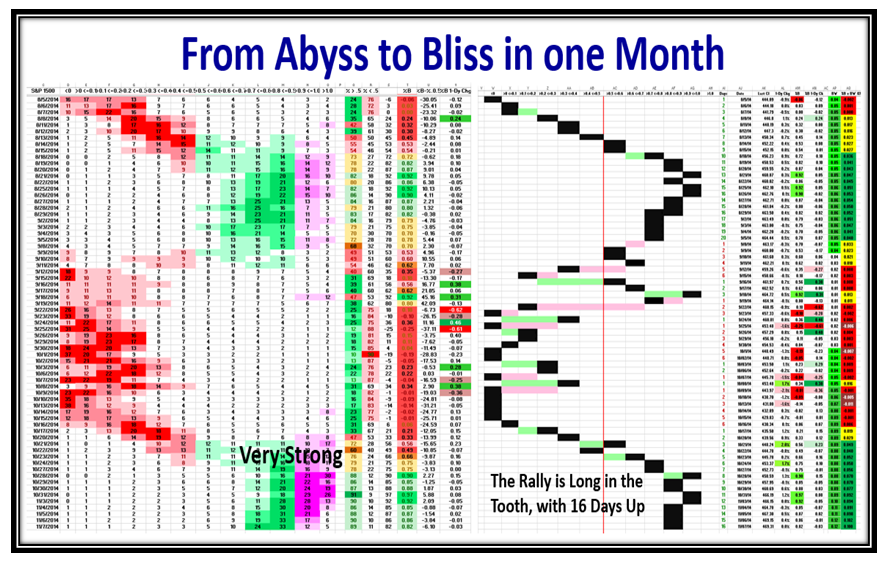
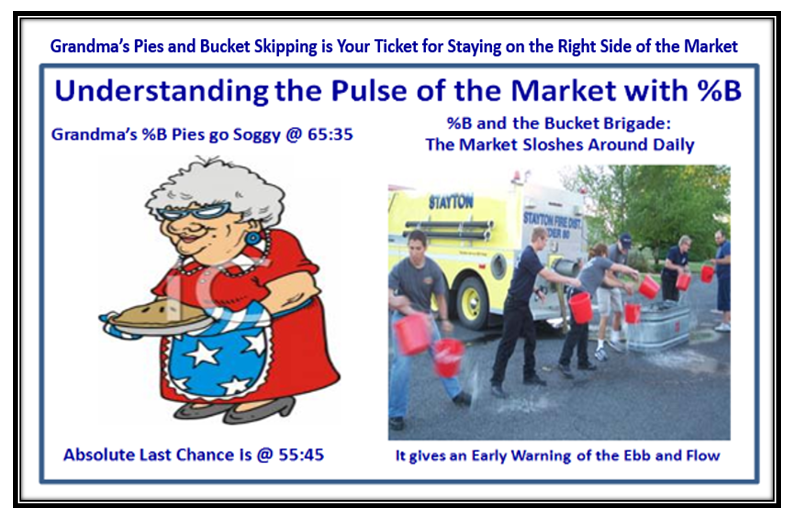
Here is Grandma’s Pies in all its glory showing you the split for the S&P 1500 stocks where 90% of them are below the middle Bollinger Band of 0.50, and only 10% are above.  My good friend Chris White has done a great job for me to show us at a glance the behavior from day to day:

Grandma Pie 90

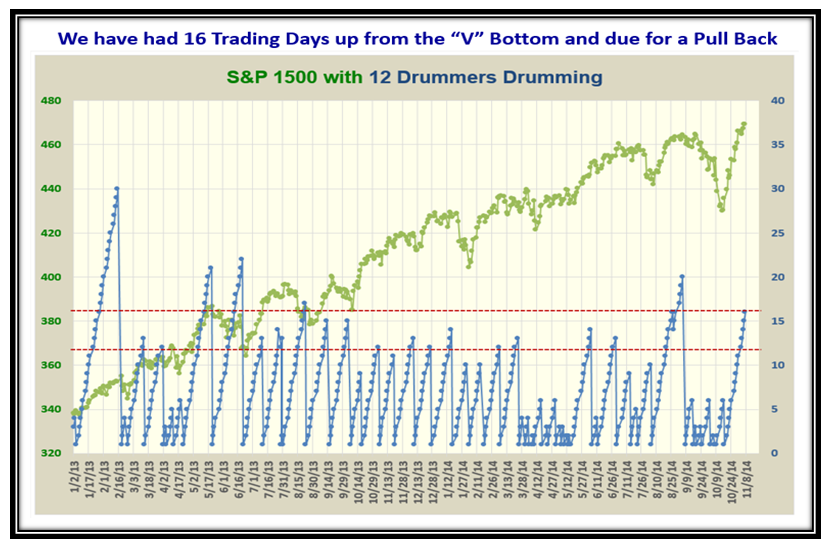
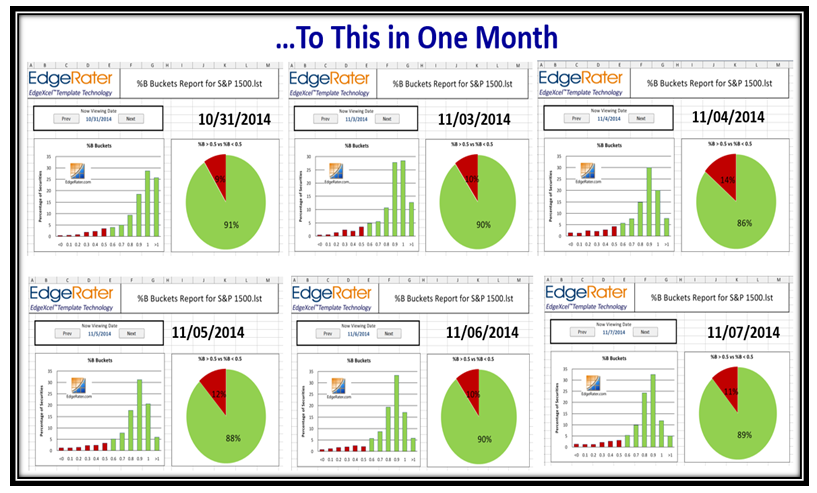
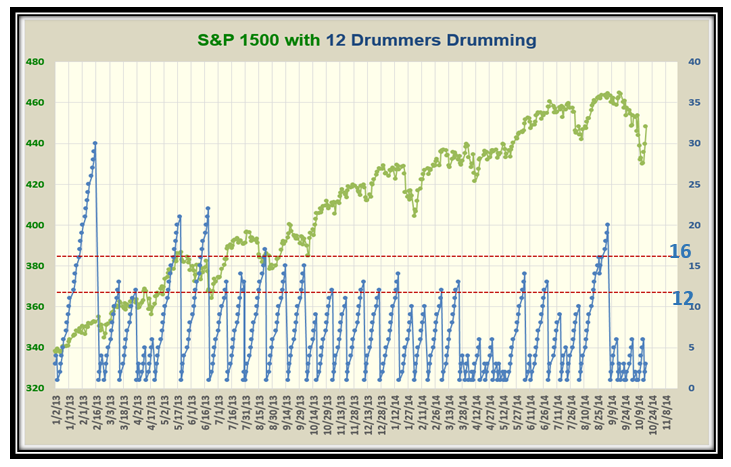
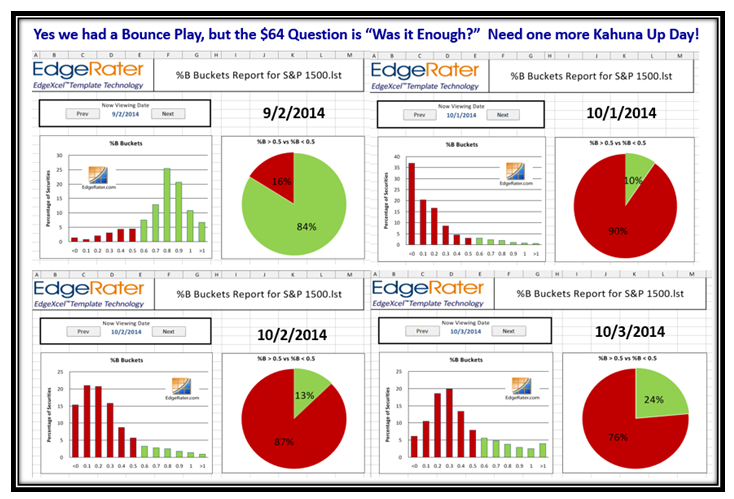
So you might ask, “What has happened since then?”, and here is that picture.  A reasonable Bounce Play, but hardly enough to feel comfortable:

Grandma Pies

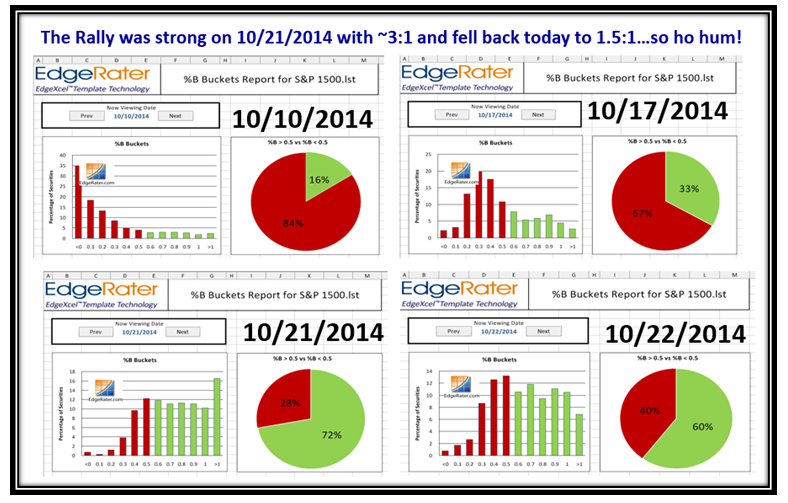
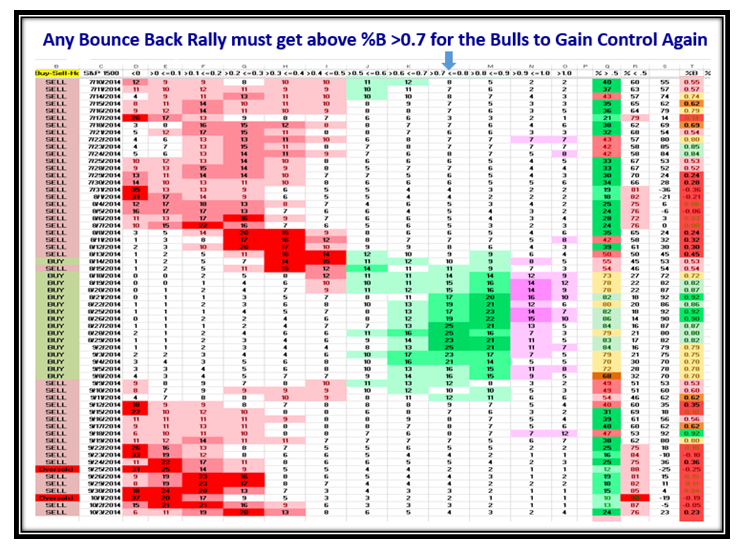
The Ball is currently in the Bear’s court.  To feel comfortable that the Bulls are back in control requires %B to have risen to where the arrow is, and then head higher:

Grandma Pat2

Those who have followed me for all these years will see that I have given you Manna from Heaven.  Newbies will have to fathom this out for themselves, but I will cover this for those who attend the Seminar in two weeks time.  Net-net, don’t expect recovery in less than a week!

Grandma Stats

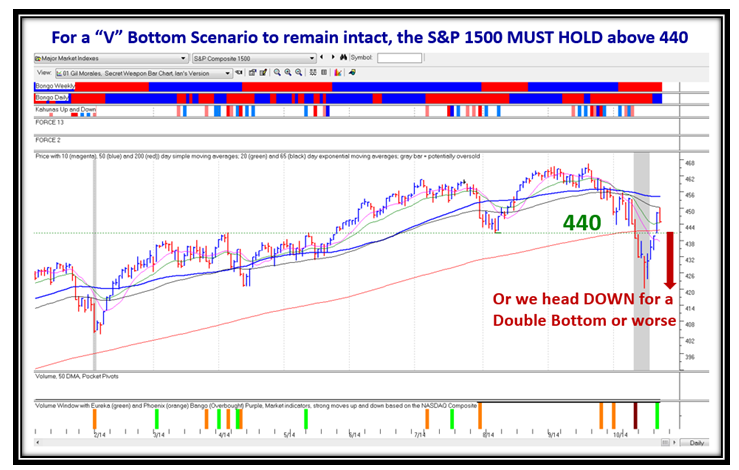
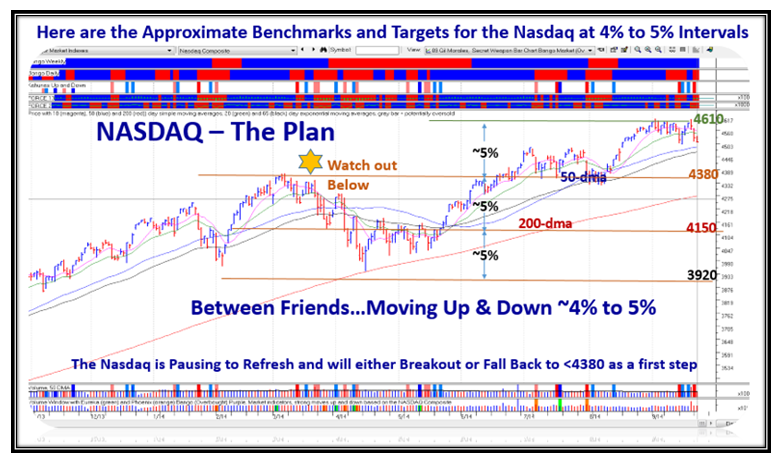
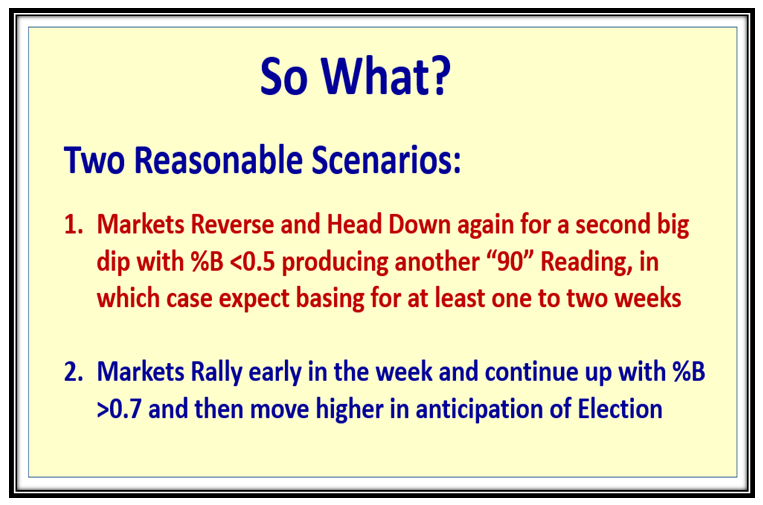
I’m no Soothsayer, but here are two possible scenarios for the immediate future based on the Fear of the potential Ebola Breakout on the one hand and the decent Jobs Report on the other:

Grandma Scenarios

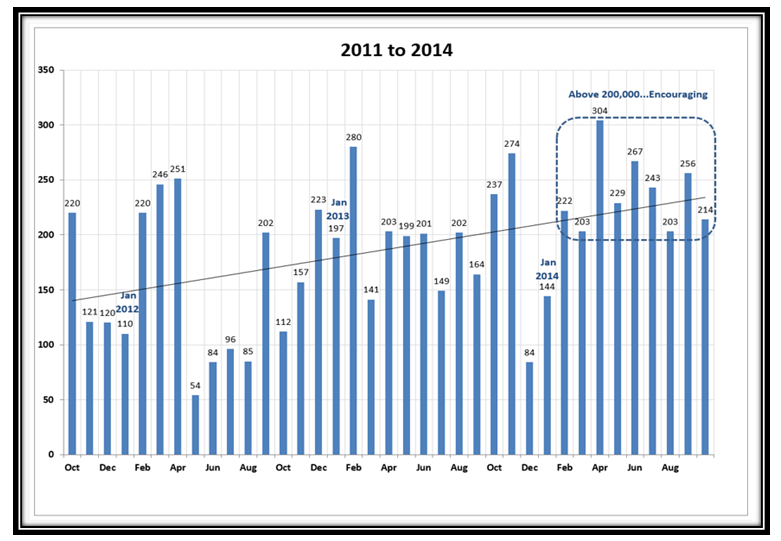
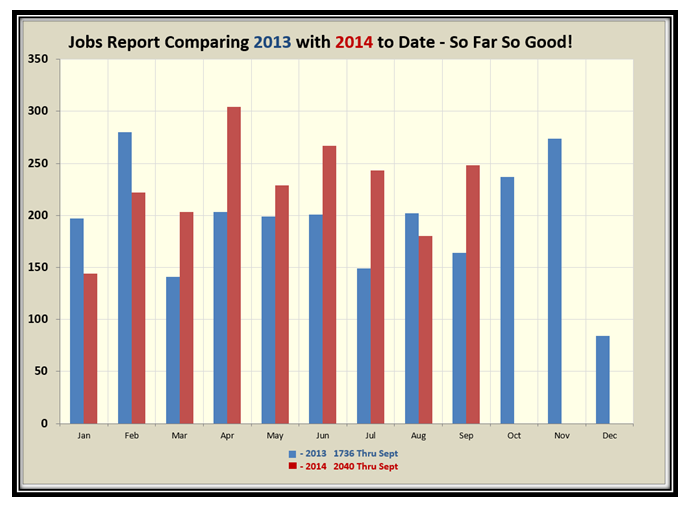
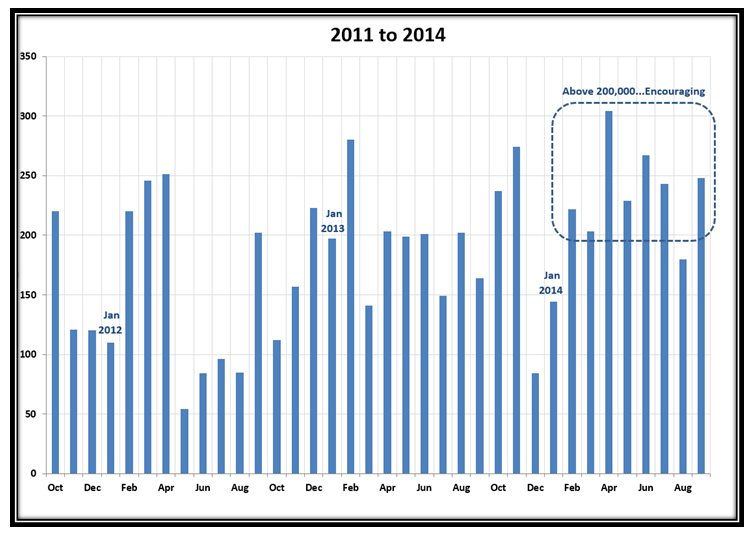
The next two slides show the latest results in the Jobs Report that came out this past Friday, with close to 250,000 for September:

Grandma Jobs1

Grandma Jobs2

Well, there you have it, the whole nine yards.  Enjoy and keep your powder dry.

Best Regards,

Ian.

The Rickety-Rackety Bridge to Nowhere

Tuesday, September 23rd, 2014

Yes, I am back and thank you for your patience.  As most of you know and been through it, I have had a harrowing time getting my Computer working again sufficient for me to give you most of the charts we like to analyze in these blog notes.

The last two days have established that the Small Caps are on the brink of giving up the ghost or are so oversold we should see a bounce play, and the Large Caps have at least given up substantial gains to cause the Markets to be in Oversold Territory.  Hence we have a Rickety-Rackety Market:

Rickety Picture

Here is the Chart of the Indexes that proves this market is all over the place, and just had a False Breakout:

Rickety indexes

We are nip and tuck as to whether we are oversold and will find support here or there is more downside to come.  If you compare the two charts in the next picture you will quickly see that inside two days we are now at a critical point, especially with the Small Caps:

Rickety Readings

Just look at the action in the last two days and it says it all.  6.2 Buckets down is not to be brushed aside with 9.0 buckets in all in two days:

Rickety Pat

Yes, we are Oversold, but I have seen numbers far worse than this so there is still room on the downside.  However a Bounce Play is on soon:

Rickety Pie

The Market Indexes have taken a turn for the worse, and are getting oversold as shown by the red on the chart:

Rickety Indexes 2

And Finally here is an overall Plan that sums up what the Market is telling us.  Watch that 4380 level carefully:

Rickety Plan

Best Regards,

Ian.


Stock Market: Hanging on by a Thread

Sunday, August 10th, 2014

Friday’s Bounce Back saved the Market from heading down further while the Market Indexes are hanging on by a thread at the crossroads.  The Market Indexes are trying to hold here at Support, but as those who have followed my blog notes for years will immediately recognize that with %B at the ~ 0.2-0.3 area we are hoping for a further move up, and yet can trundle down very quickly:

Thread Picture

It is touch and go, but as we see all the Market Indexes are trying to find support this past week:

Thread Indexes

Likewise, the Canaries are showing some renewed strength, and is a good sign to counter some of the gloom:

Thread Canaries

The VIX has been bouncing around just below going into oscillation.  Watch carefully for moves above 18:

Thread VIX

Past History shows we have reached the Depths of Distribution, and we need a quick reversal to the upside:

Thread abcde

The 6.4 Buckets down killed the momentum of the Rally, and we are now 11 days down, so should see a reversal soon, which may have already started with this past Friday’s decent move up:

Thread Pat

As we will see %B for the Major Market Indexes is between 0.2 to 0.3, and this is no man’s land where either the recovery continues to force %B above 0.5, the mid point, or we fall back again and the Market moves down:

Thread Pat2

The next two charts show the cliff edge that %B is on and confirms that Type 3 & 4 Investors need to be patient:

Thread Nasdaq

Thread S&P1500a

We all know that the Small Cap stocks have fared the worst of late, so I have used the Russell 2000 (RUT) as the Guinea Pig for showing what to look for before longer term Type 3 & 4 Investors should engage in this market.  The Index must get above the resistance of the moving averages before there is any hope that there is a longer term move up…we need an Eureka & Kahuna to appear as shown:

Thread RUT

Well folks, there you have it.  I couldn’t take my eyes off the TV watching Golf today, but I am sure you will still enjoy this.

Best Regards,

Ian.

Copyright © 2007-2010 Ian Woodward
Disclaimer: Commentaries on this Blog are not to be construed as recommendations to buy or sell the market and/or specific securites. The consumer of the information is responsible for their own investment decisions.