Ian Woodward's Investing Blog

Archive for the ‘Market Analysis’ Category

California Here I Come!

Sunday, October 2nd, 2011

It goes without saying that both Ron and I are working feverishly to give you another great Seminar in three weeks time.  We still have seats and I can assure you that we will raise the bar one more time.  I can tell from the lack of enthusiasm for the current market that many of you are turned off, but now is precisely the time for you to understand what to look for in both Down and Up Markets, so bring your better half along and you will learn a lot and have fun.  I am reaching out to my friends in the Kingdom of Tonga, Australia, New Zealand, England, Scotland, Switzerland, Europe, Israel and my good friend Kevin from Qatar to name a few who owe us a visit!  Let’s not forget all you who are faithful supporters here in the good old USA.

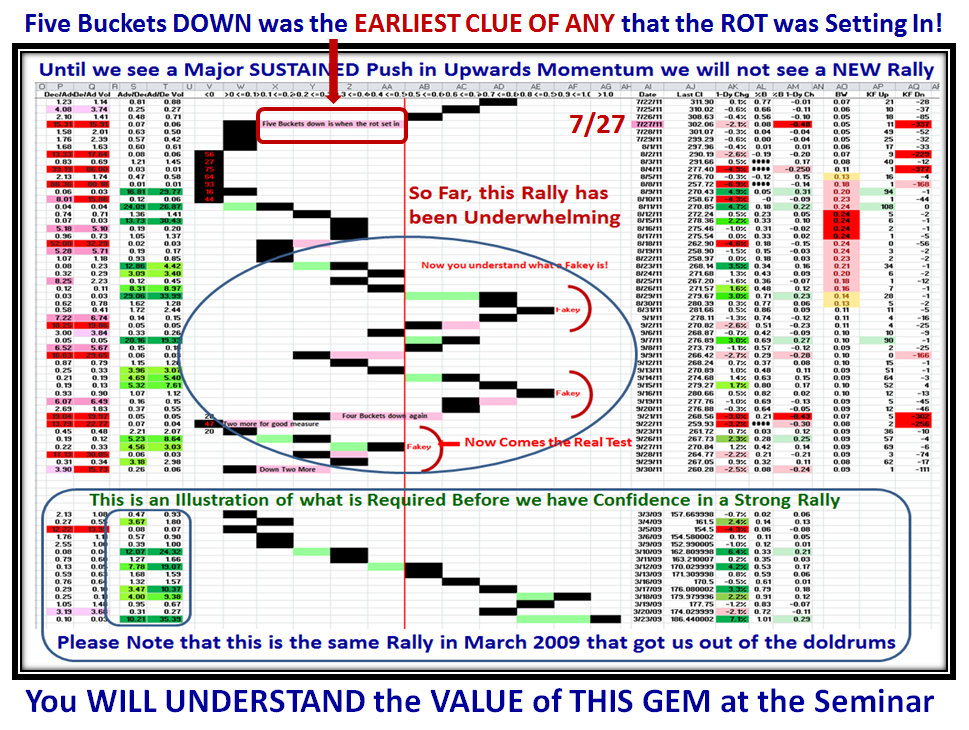
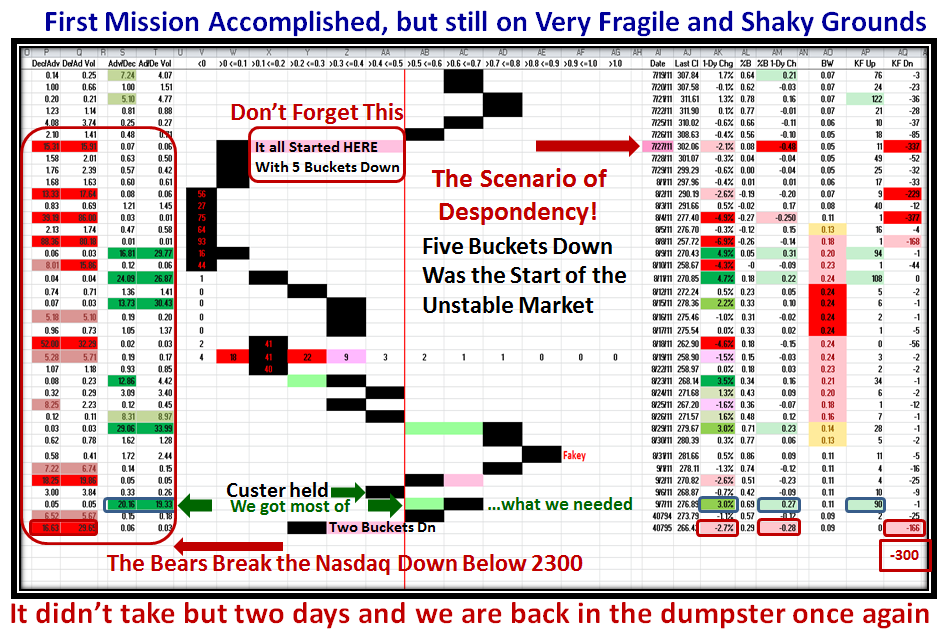
Now, if you don’t believe me that you will learn far more in person and be two years ahead of where you are now, then realize I gave you the clues of where this Market was headed and why back in my blogs of August 1 and then nailed it on August 4…go back and read that good stuff for yourself.  Here is the upto date picture of that clue:

I know, I know, that some of you are saying to yourselves “Ian, I can’t even read the chart, and this is far too confusing for me to understand”.  Not so say the Seminar Attendees…they know which way their bread is buttered.  But for those of you who don’t know it, we simplify all of this by then making it easy for you to follow with Ron’s part of the presentations that takes this and produces the easiest of pictures in the HGS Investor Software.  Please also understand that we will be addressing the latest Version 8 of the HGSI Software as well, so that you will see all the goodies on many fronts.  Add Chris White of EdgeRater to the list with the new tricks he has up his sleeves. Now let’s not forget Dr. Jeffrey Scott, who will as usual be sharing his latest insights with us and you have a powerful set of information to look forward to.  Let’s not forget the banter back and forth by the attendees in the room and all in all you will go away with knowledge coming out of your ears.   Yes, of course it’s a sales pitch, but we need your support right now.

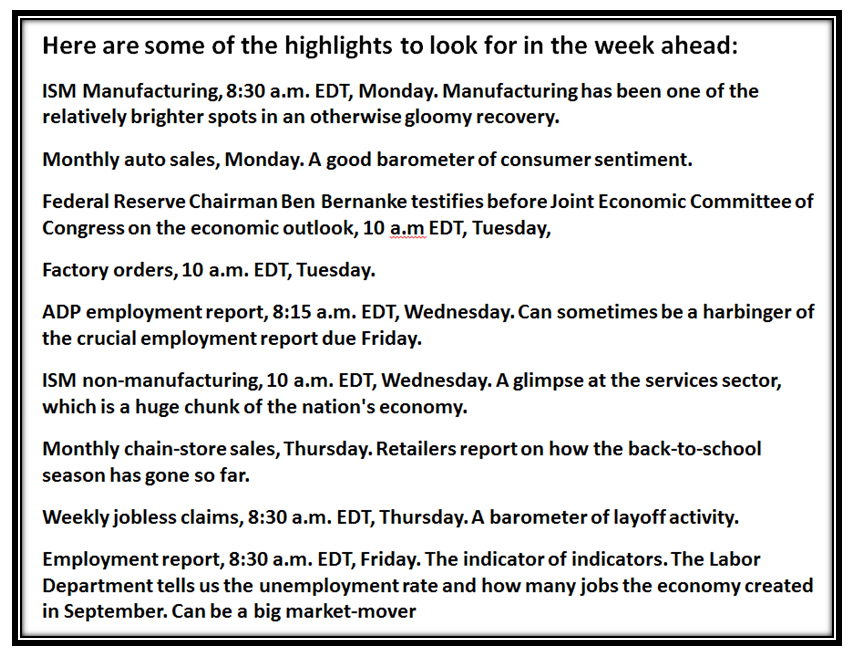
Now here is the Calendar of events for the next week, and  you will see the Employment report comes out on Friday:

I’ll leave you with one Ray of Hope!  AAPL will talk about their iPhone on October 4:

Best regards, Ian.


The Gold Bubble Burst but Don’t Count it Out Yet

Monday, September 26th, 2011

Bruce who is a fellow investor I have known since the days of chatting on Prodigy over 20 Years ago asked me today “Ian, I would be interested in your opinion on Gold and whether it might have bottomed. It often goes the opposite direction as the rest of the market, especially the dollar.”

I don’t pretend to be an expert in Gold, but in view of the alarming fall these past three days, I did a little research today to see if I can shed some light on the subject.  This precious Metal is tops with the Middle and Far East Markets, and particularly in India of which this is an example of a shop in a Bazaar in Mumbai, originally Bombay:

If we look at the SPDR Gold Shares ETF (GLD), we can immediately see that once the shares went into a steep climax run lasting almost two months and finishing in a double top, its days were numbered.  The precipitous drop came four days ago and may have been triggered by the Bubble in the price but also fueled by the uncertainty of the Greek Crisis and all the fru-frau regarding European Banks, and the Euro, which may have caused a flight to cash.  At any rate, it is surprising to see that Gold may even beat the S&P 500 and the Nasdaq to a Bear Market of -20%!

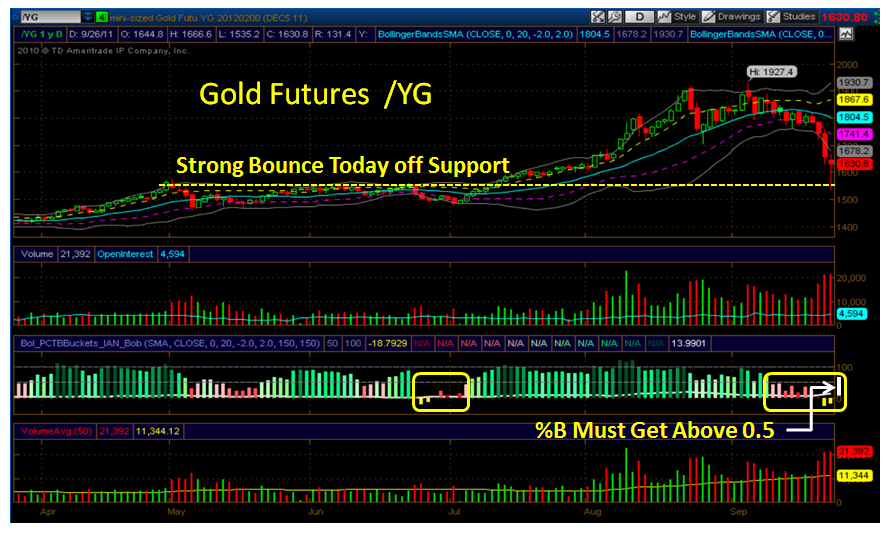
Although we woke up to a precipitous drop in Gold Futures overnight, the subsequent Bounce Play was encouraging.  The damage was done the previous two days when the price gapped down below the Lower Bollinger Band, and that is what must be watched carefully.  With a close to 17% drop from the recent high don’t expect a miraculous recovery…these kinds of shocks take time to work themselves out of a hole.  The clue for recovery is typically a retest of the Low and a “W” Double Bottom.  If the Index moves sideways inside the Lower Bollinger Band on the retest, that is a point in time when there may be a serious rally to the upside.

Looking at the recent behavior of the Gold Futures for clues to recovery, %B is down in the mire with a reading of -.1879 as shown on the chart below and I show you what to look for to get a quick recovery on the extreme right hand side where I suggest %B must get above the middle band of 0.5 in a hurry.

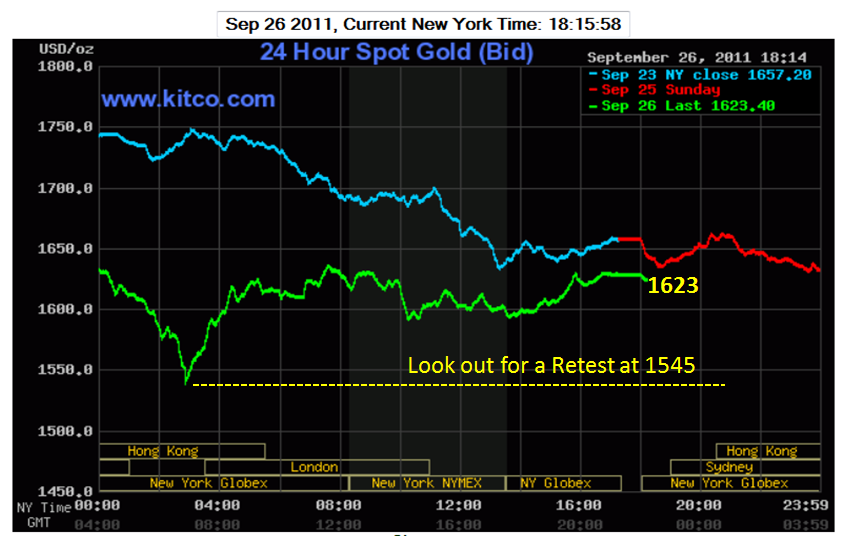
I found a good site in www.kitco.com which covers several precious metals with statistics coming out of its ears, and here is just one snapshot I captured which shows the one day performance of the Spot Gold, where you can immediately see that it got back to where it started the day, but gave up 100 points from top to bottom and back again.   Note that the entire move was accomplished in the first six hours, so it ran into resistance at the 1625 level…so look for a retest of the lows somewhere along the way.

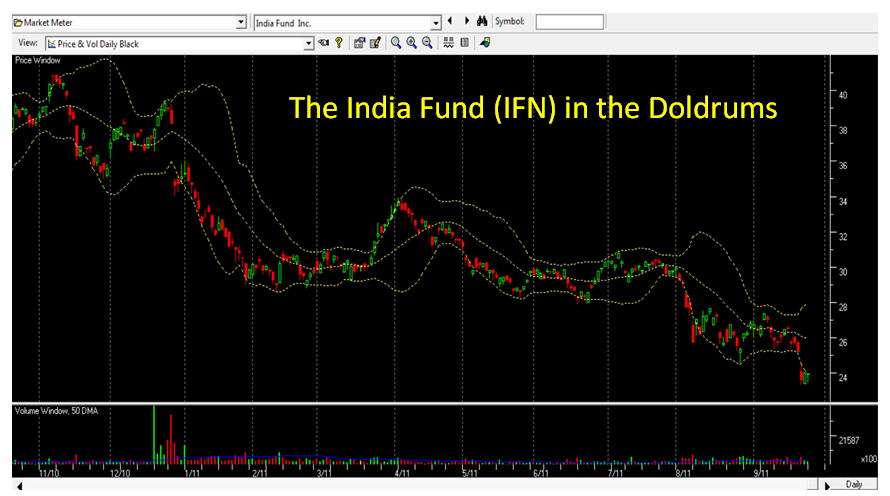
One other thought is to put yourself in the shoes of the Investors in Mumbai India.  In other words, it pays to watch the likes of the India Fund (IFN) and you will see the Far East which includes China has taken a drubbing this past year.  So it is no wonder that eventually this would flow over into the gold market.  I don’t have to tell you that the pundits have been touting Gold 2000, and with it the super hot commodity of the year, it can surprise us all and rebound quickly.

The temptation is to jump in with both feet, but when a Security is broken it is usually prudent to wait for a base to form or at least some sign that the worst is over before you barrel in.

Best Regards, Ian.


Stock Market: Doom and Gloom or Plain Sailing?

Sunday, September 25th, 2011

There is always a Market of Stocks, and although we have had a major blow to the budding Bounce Play with the two days massacre of the Stock Market last week, there are always opportunities in the short term when the Market is oversold.  However, Types 1&2 near term traders can have fun, but Types 3&4 must wait one more time to opt in.  This Blog Note shows the current status and then portrays the alternatives for how to ferret for opportunities while getting early clues of which way the wind is blowing:

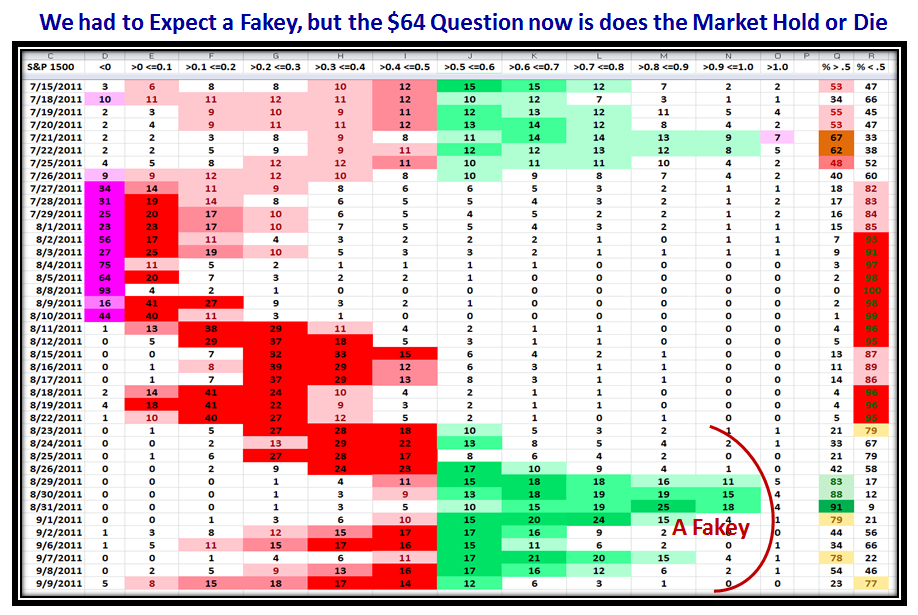
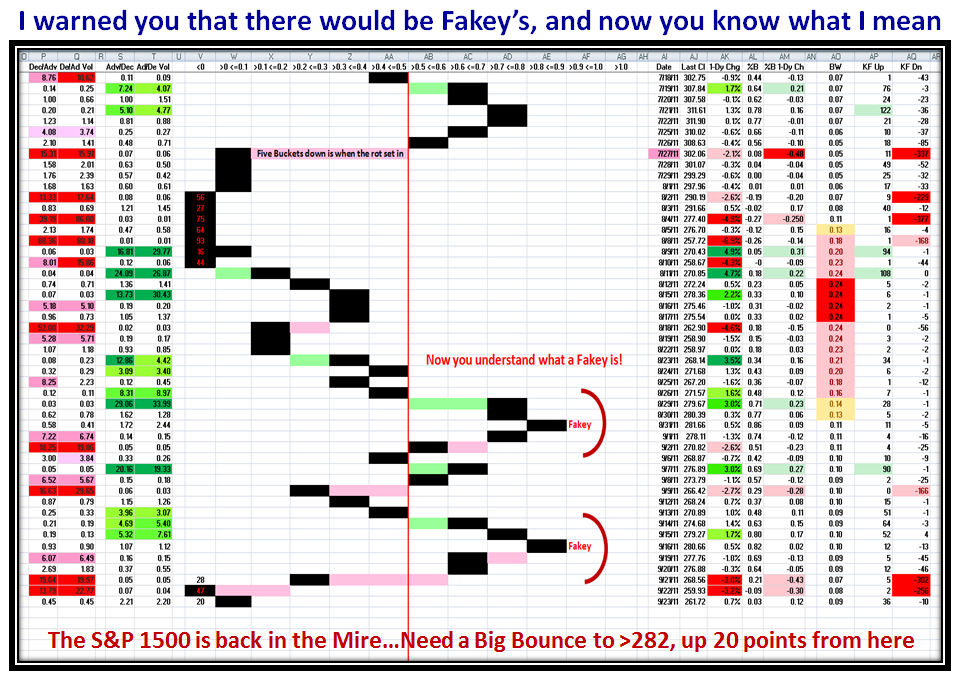
So let’s start with the bad news and show you that we have now suffered from two Fakey’s while ending down in the dumps of despair once again.  Those two heavy down days on Wednesday and Thursday just took the wind out of the sails of the Bounce Play.  Some Technical Analysts would suggest that we have now experienced a Double Bottom and that the Market is Oversold, so the near term opportunity is to the upside.  Others would argue that we haven’t seen the worst yet, particularly with little consolation from Helicopter Ben which started the rot down, and the uncertainty in Europe with the knife edge for the Greek Economy and Debt Crisis:
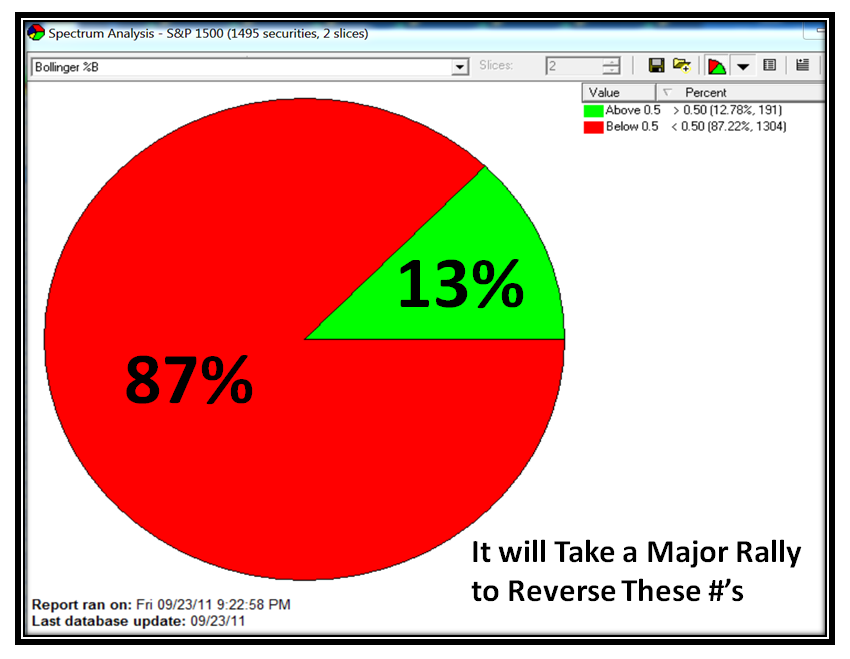
…And just to show you the damage in terms of the % of Stocks in the S&P 1500 that are above and below %B of 0.5, i.e. the Middle Bollinger Band, here is that picture, which will take a Major Rally to reverse:
At times like these, it is important to understand the Flight to Quality, and naturally we would expect to see that in either the OEX or the NDX.  This time it is Technology that is holding up the fort from a Market Index point of view and here is the NDX:
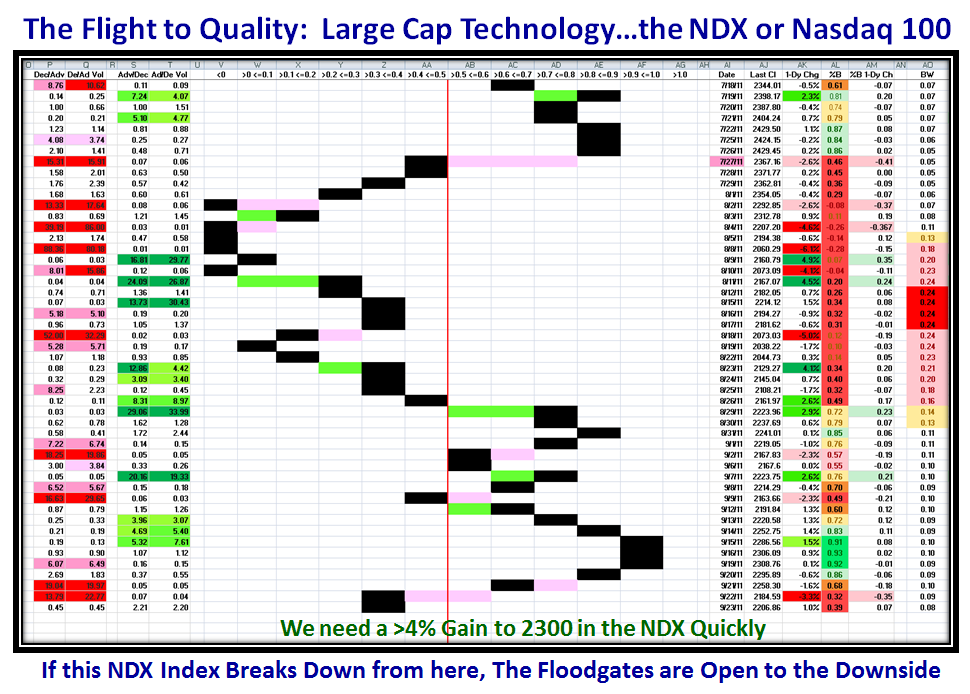
This shows a slightly brighter picture, but we still need a quick bounce play to get us back to respectability of %B above 0.7:
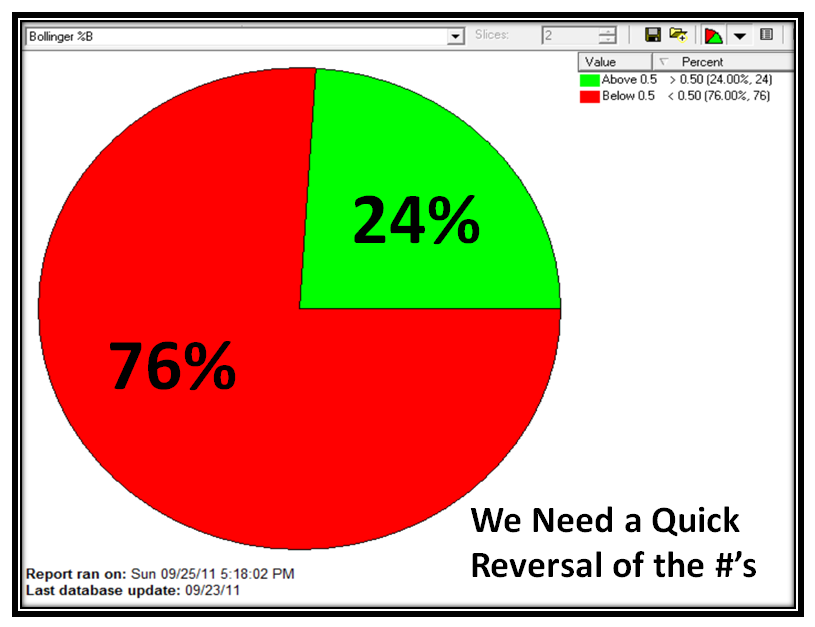
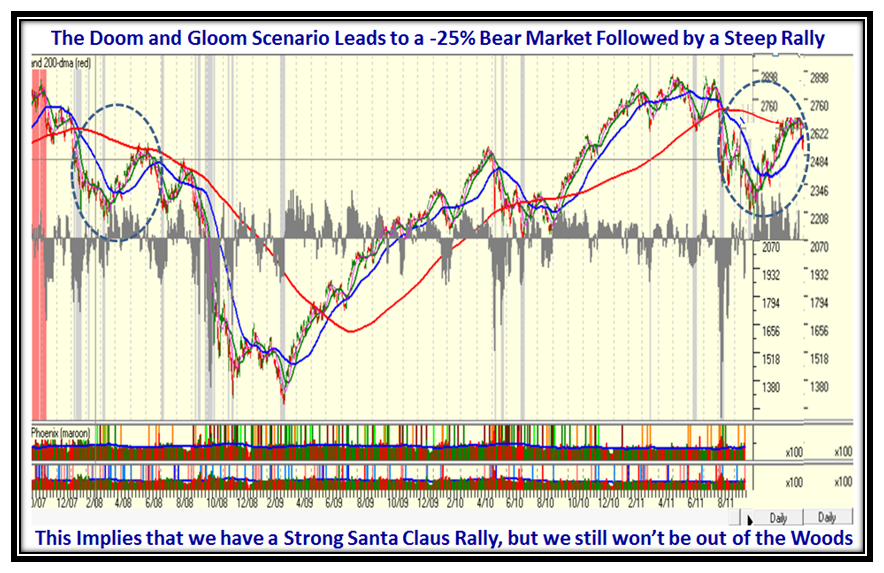
It’s not quite as sick as the S&P 1500, but that is what we should expect.  So now that we have a feel for the status, the next job at hand is to look at the Alternative Scenarios as I have taught you.  I warned you that the Death Cross was looking ominous and with that drop last week it has widened the gap between the 50-dma and 200-dma to the downside.  So now we know the extent of the challenge we face in getting back to a Golden Cross where the 50-dma comes back up through the 200-dma.  If we zoom out to a long term chart,  it doesn’t take two minutes to see that we are way past the dynamics of the Flash Crash Scenario and that the challenge looks more like the early stages of Black Swan as I show below.  I have superimposed the left hand side dotted circle on the right hand side, and it suggests two points, unless we have a miraculous recovery from these depths…which I will show you what that will take later:

1.  The expectation with this scenario is a further drop into Bear Market territory of around 25% (say), before we perk up for a Santa Claus Rally.

2.  It will take a strong Santa Claus Rally in his Red Car with no Grinch or Moose Droppings along the way!

This is the Low Road, Doom and Gloom Scenario:
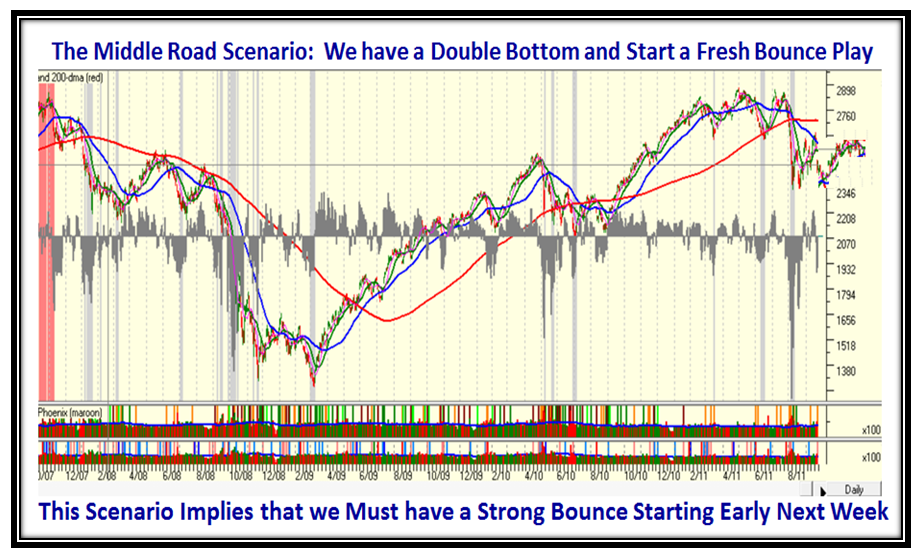
So let’s now take a look at the Middle Road Scenario, which dictates that the Double Bottom HOLDS and we bounce back with vigor this coming week to at least reach the highs we hit before the disaster of last week:
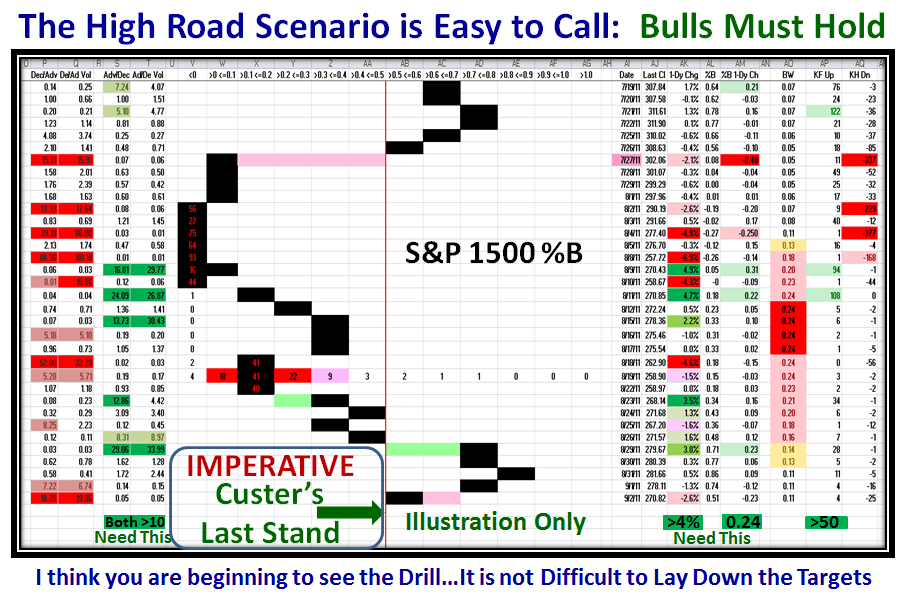
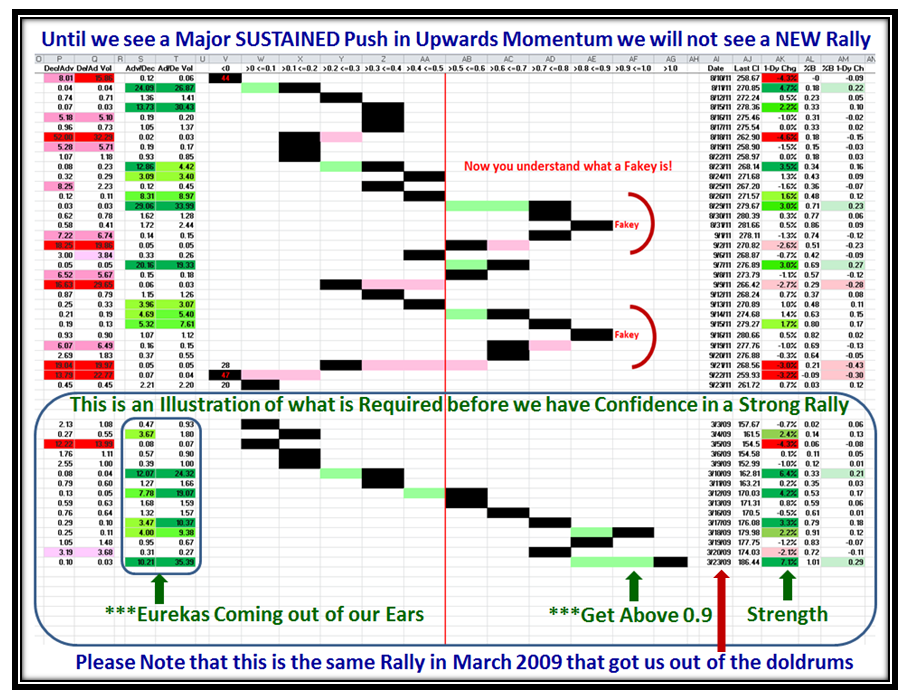
Earlier, I promised you what the High Road Scenario looks like.  If you are so optimistic as to believe that this double bottom is the clue for you to dive in with both feet, be my guest.  However, it is not difficult to identify the challenge that must be met and there is no better way to show that than to go back to the start of the Rally back in March 2009.  I have superimposed what that should look like on the S&P 1500 chart I showed you earlier and the bottom half of the chart below shows exactly what I am talking about.  As I say, “We need Eurekas and Kahunas coming out of our Ears.”  Unless we see this kind of performance don’t get fooled into dipping your toe in the water:
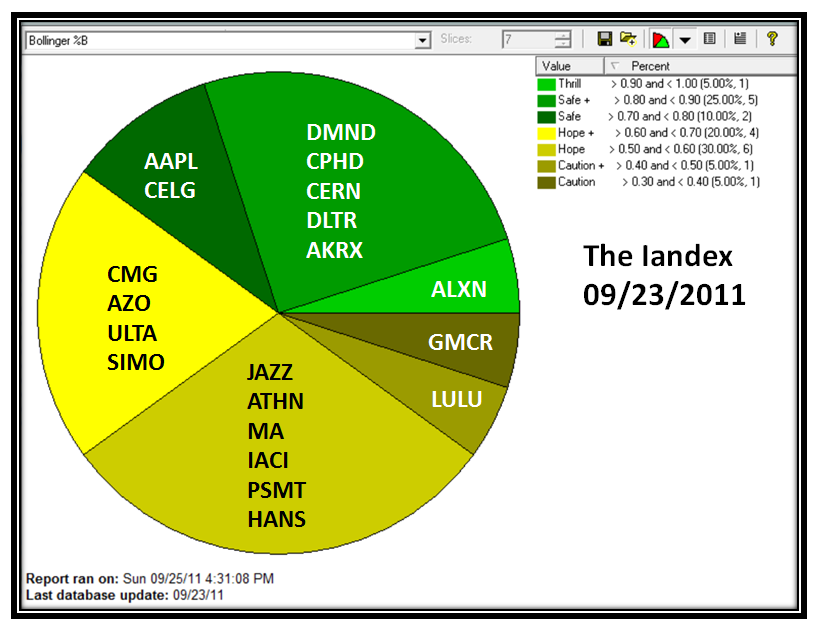
I’m sure at this stage many of you are saying “That’s all very well, Ian, but how can I keep an eye on Leading Stocks in Wolf Pack Industry Groups that will give us a clue of whether this market will start to blossom or will continue to crater.”  It’s been a while since I have done the “Iandex” Index for you which selects current Leaders in various Industry Groups that are currently above their 50-dma and 200-dma and can potentially lead us out of the mire or fall back to earth and die with the rest which are already underwater.
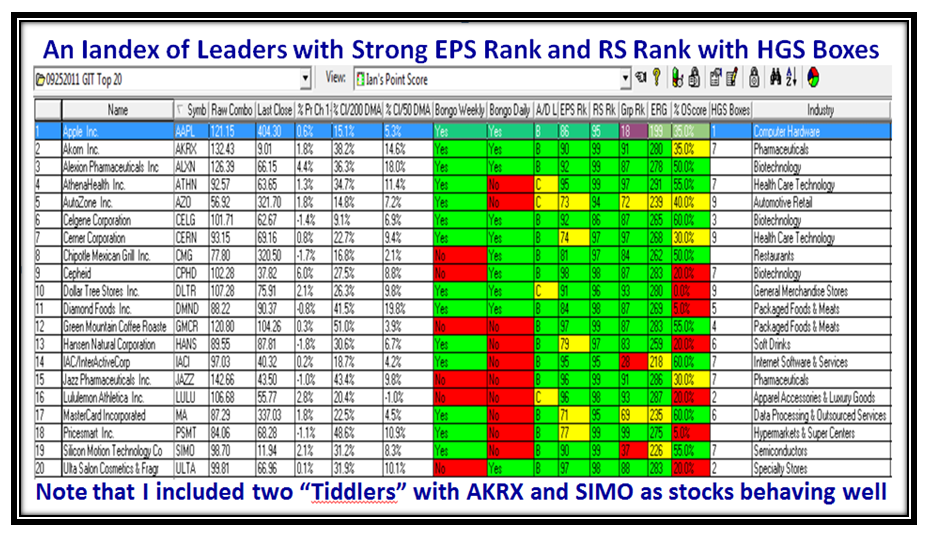
We are exactly one month from the HGS Seminar on October 22 to 24, so the performance in the next month of this Iandex will give us a good yardstick of where we stand by then.  Put these stocks into your HGS Investor Software and you can follow along and judge for yourself.  Remember that its main purpose is to see if the Market Craters, but if these Stocks hold up then the other purpose is to zero in on the Wolf Packs.  The first Chart shows the familiar Pie Chart as to where the Stocks in the Index sit now:
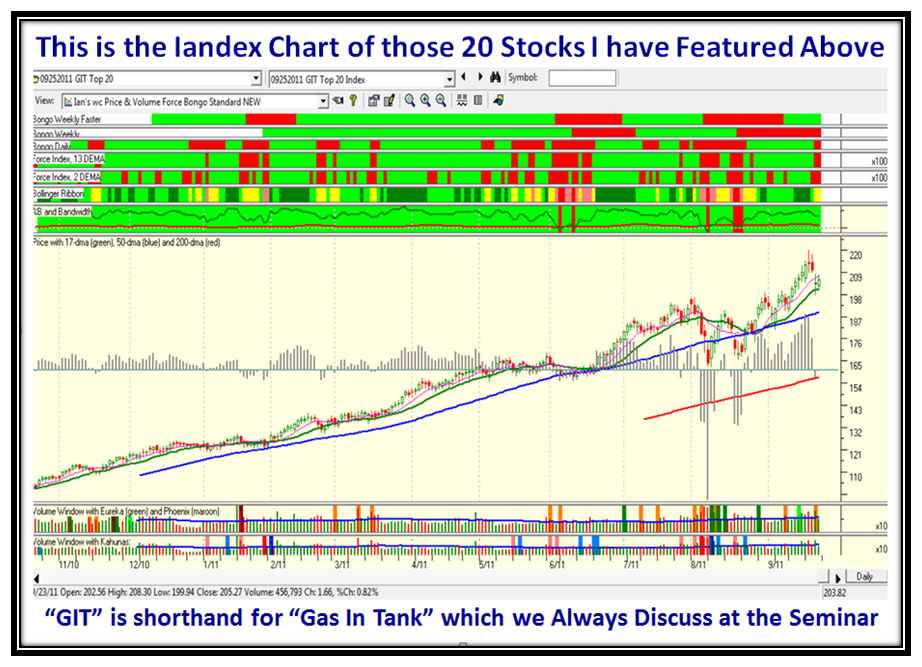
The chart below is the Index of these twenty stocks and one can see that as a group it shows current strength:
This Blog Note would not be complete without getting to the answer of the “So What?”  Always remember that Stocks are like Wolves…they Hunt in Packs!  There are currently Four Wolf Packs as shown below.  That should please some of my regular viewers who use this slogan to look me up!  Enjoy:
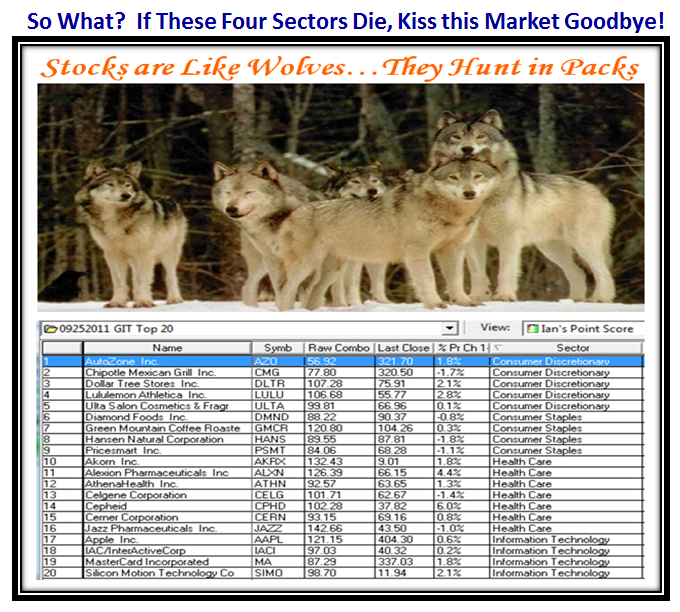
If these Wolfpacks survive, we have hope for a new rally; if they die, the party will be over for now.  Ron and I look forward to seeing all of you in just four weeks…hurry, hurry, hurry there is plenty to learn and master to keep your Nest Egg safe and growing.

Best Regards, Ian.

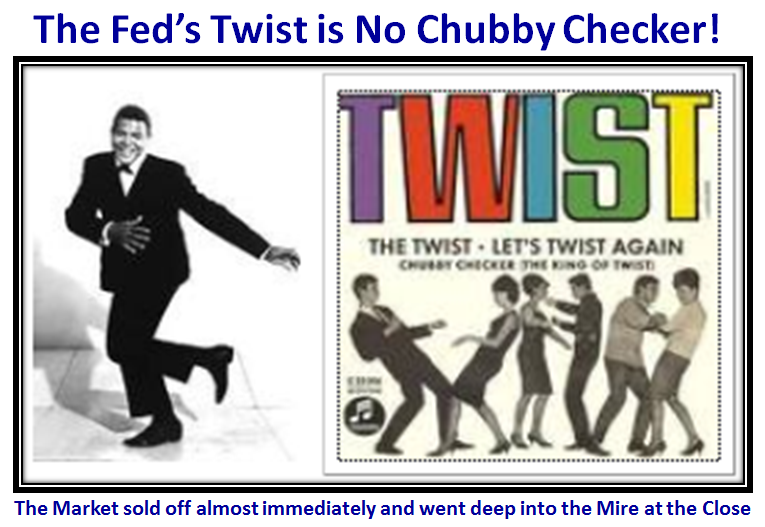
The Fed’s Twist is No Chubby Checker!

Wednesday, September 21st, 2011

I know you folks have been eagerly looking out for my take on the two items I told you to watch ten days ago and now we have both items behind us, the American Jobs Act and the Fed Meeting which ended today in a flop as far as the Stock Market is concerned.  I didn’t want to disappoint you so enjoy the charts which speak for themselves as I want to get this out early enough so that the East Coast supporters can chew on this before they go to bed:

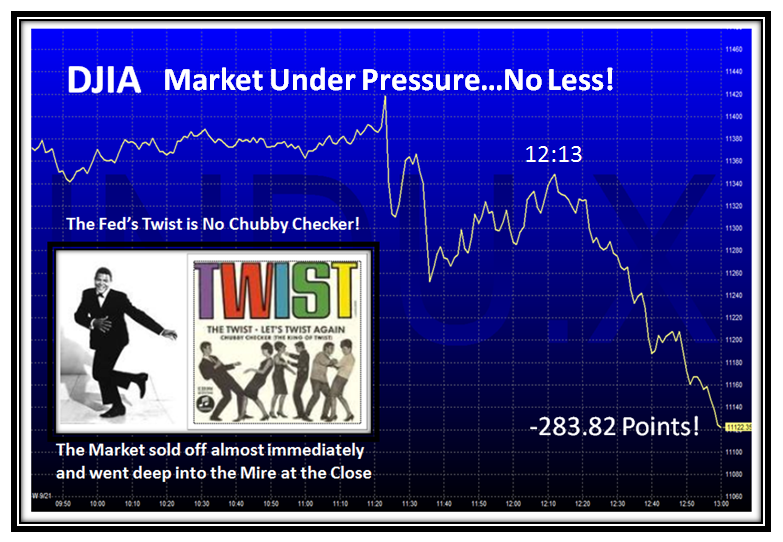
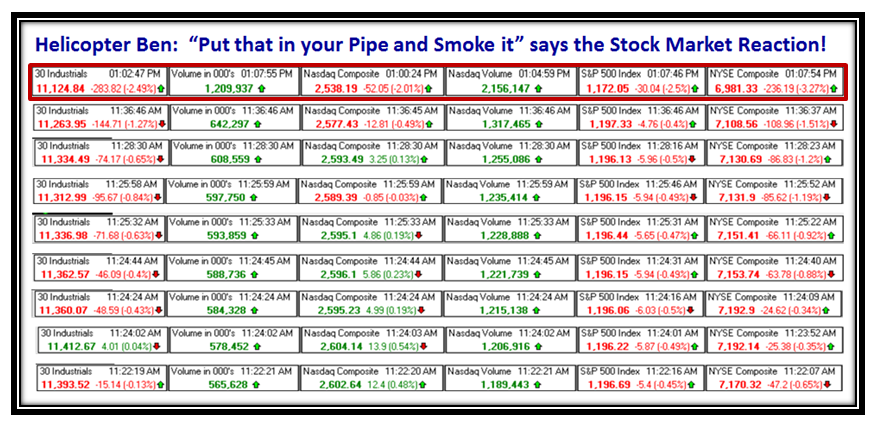
One of my favorite pastimes is to record the Market Action on the day of a FOMC announcement, so true to form, here is what Ron and I observed as we chatted on Skype at 11.15 am onwards:

It didn’t take but two minutes to see we were headed down, and it was a landslide all the way down to the close:

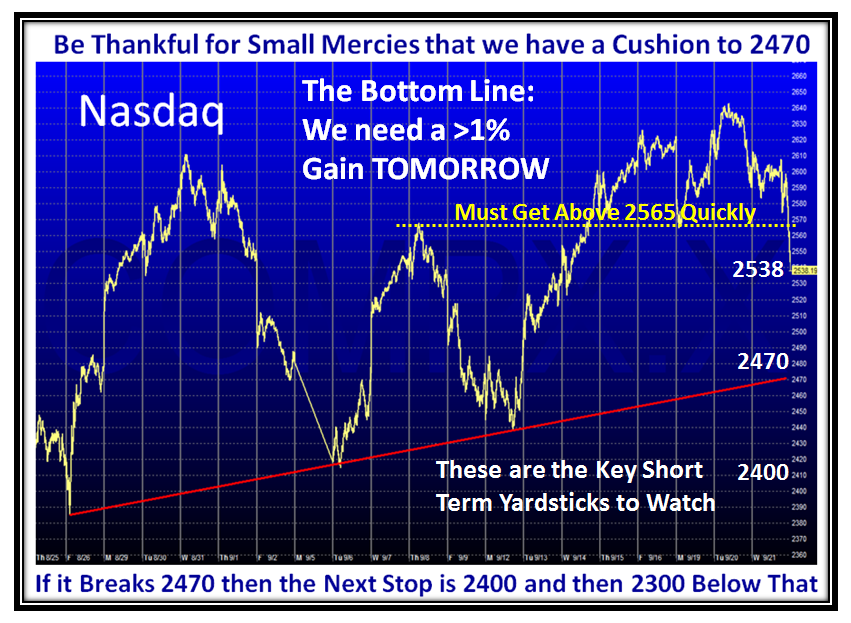
This Next Chart has all you need to know for the immediate short term these next few days.  Make no mistake about it, we are extremely fortunate to have a BIG Cushion from the lows of 2300 or so.  We need a >1% Bounce Play tomorrow:

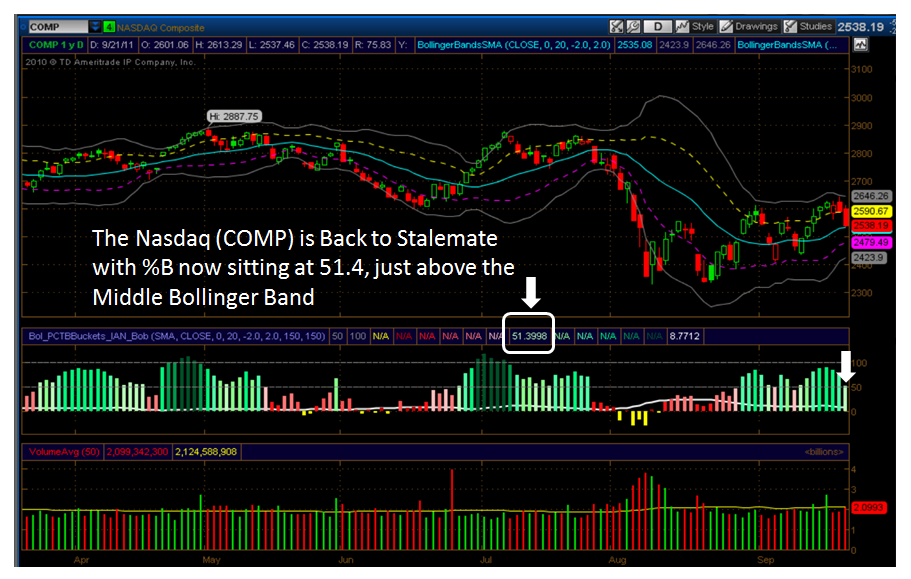
Now let me show you a different view relating to %B and Bandwidth as developed in Think or Swim by my good friend Bob Meagher who will be at the HGS Investor Seminar in just four week’s time, and will be only too glad to help you when you see him there.  This picture is in real time and the bar at the end of the chart for %B wiggles up and down with the market so that I can tell when we are due for a Bucket Skip to the upside or the downside.

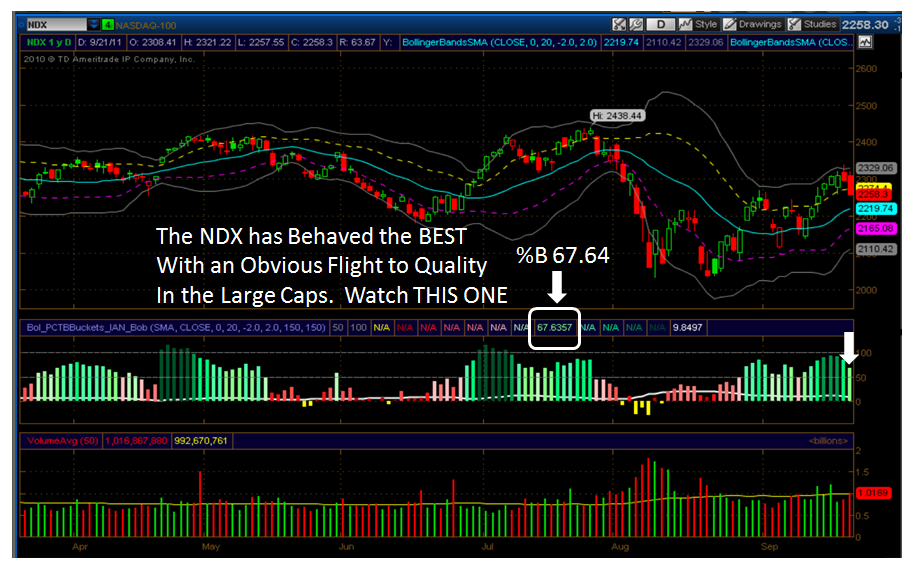
If you have been watching the various Market Indexes as I do, I am sure you will have noticed that the NDX has behaved the best with a flight to the Big Cap stocks for safety.  I strongly advise you to watch the NDX as it will be a true guide as to the health of the Market and if it can weather the storm created by today’s reaction to the Fed’s attempt at a cha-cha-cha on the twist.  Start dancing Helicopter Ben:

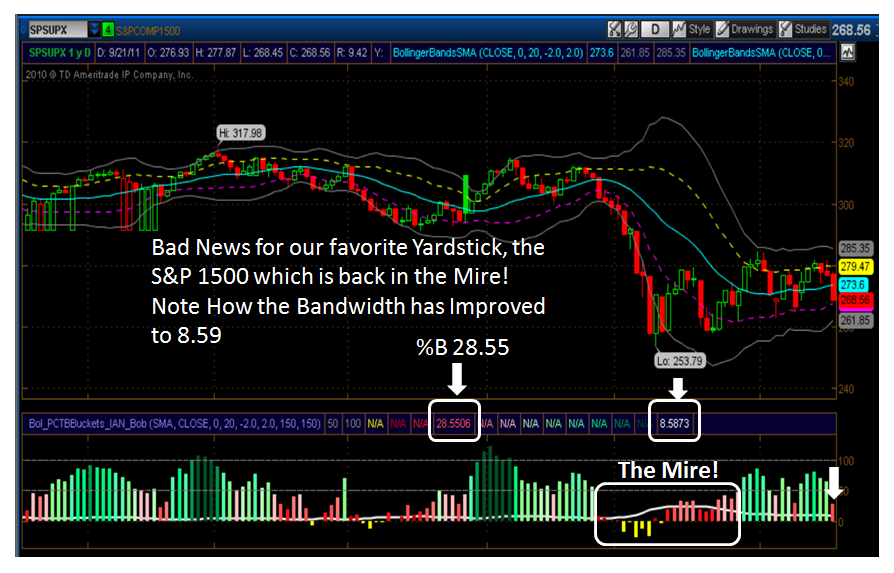
…And now for the bad news relating to our favorite surrogate for the market, the S&P 1500, which is back once more in the Mire.  Judge for yourself:

If we break down below the Lower Bollinger Band, the Bandwidth which has recovered nicely to <9.0 (8.59 to be exact), will quickly grow and if it heads back to 24 or more you know that we will be back to Black Swan days!

So the Game Plan is very easy.  If the S&P 1500 breaks 261.85…the Lower Bollinger Band, then you need to either short the market or run for the hills.

It is no secret that HFT’s (High Frequency Traders) rule the roost, so be mighty careful where Angels Fear to Tread:

What is the Moral of this Story and the lesson learned?  Always keep an eye on impending Fed Actions and Political Decisions that may affect the Market’s reaction, especially when the Market itself is very jittery and is primarily NEWS DRIVEN.  40% to 60% of your Portfolio’s movement depends on the Market, 20% to 30% depends on the Industry Group and the remainder is due to the Security itself…therefore, always watch the Market and Industry Group FIRST!

Best Regards, Ian.


Stock Market Focus: Greek Default and American Jobs Act

Saturday, September 10th, 2011

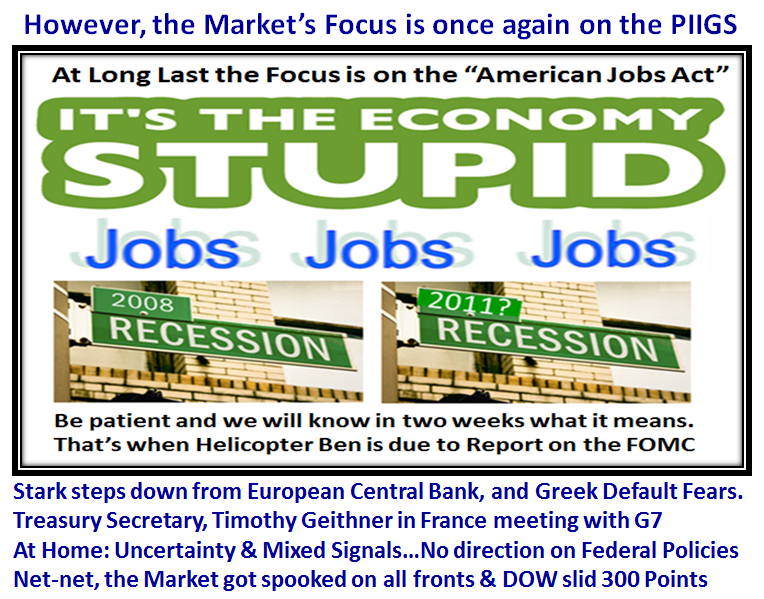
Yet again when all eyes were focused on the Speech by President Obama, we woke to another whamo from the concerns of a Greek default and all hope of a decent week were shattered with another 300 point drop in the DOW on Friday. The entire situation is on a Knife Edge, so watch out below:

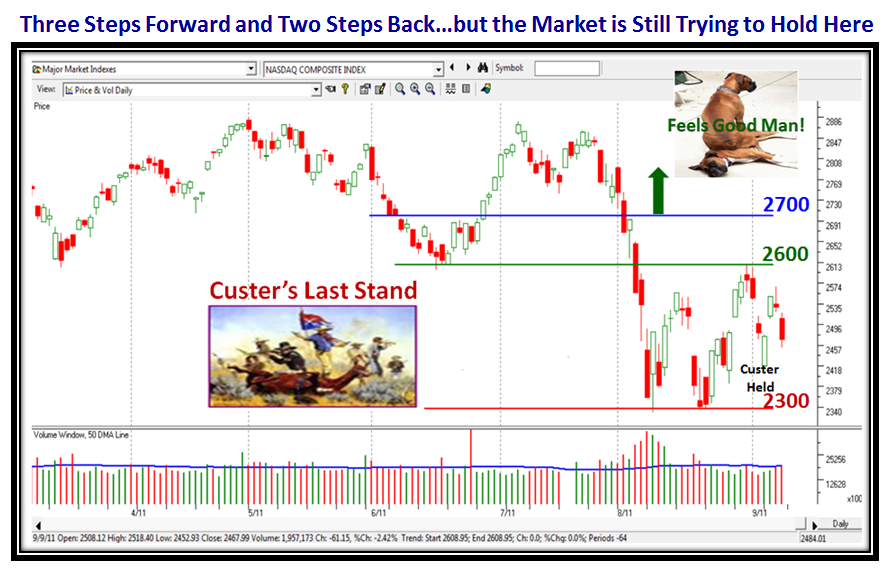
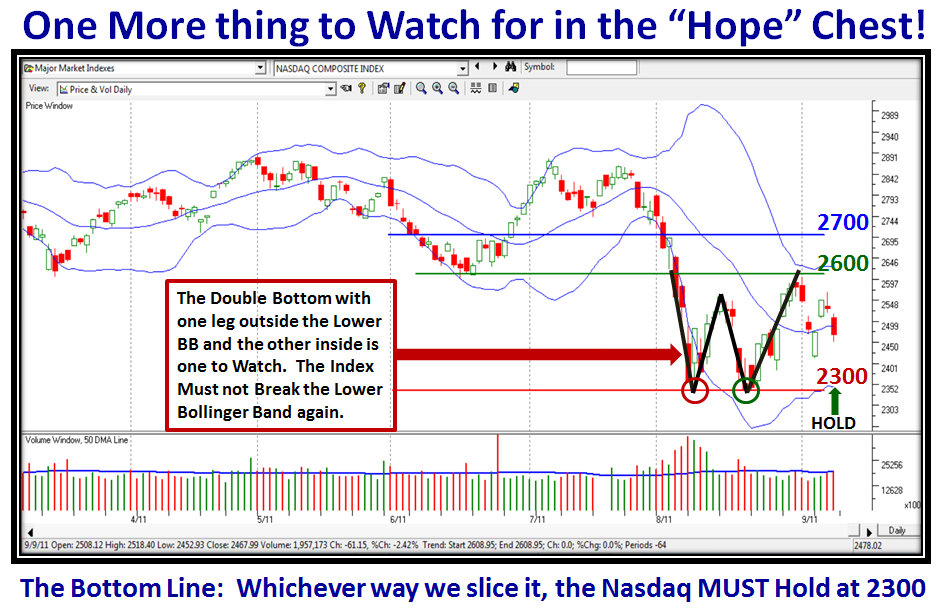
Don’t expect anything earth shattering from Helicopter Ben who also disappointed with no real news last week, so he is in hiding until the FOMC meeting in ten days time on September 20-21, which will coincide with the full roll out of the American Jobs Act Plan with more details.  However, that is an eternity for the Market and unless we see a surprise out of Europe to turn the Greek default fears around, the Nasdaq will have a tough time holding the line at 2300, which is now the crucial line in the sand before we fall further into the Mire:

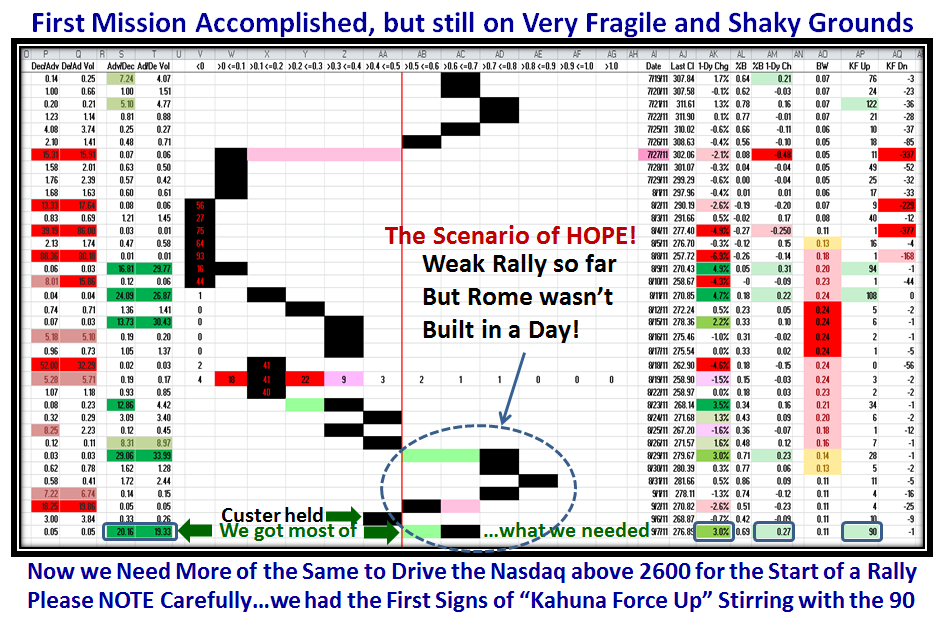
So now that you understand the Emotions driving the Market for the next couple of weeks, let’s review the bidding on what I told you must happen last week and how all of that panned out, first to the upside and then into the Mire on Friday.  Here, to refresh your memory were the targets I set:

…And, true to form, we got what we needed almost perfectly.  Everything looked rosy at the start of the week with Kahunas galore on 9/7/2011:

But then the Market lowered the boom on Friday with all that kerfuffle on the Greek default situation and we go into next week sitting on a knife edge:

One more day like Friday and we can kiss the so called “Market in Uptrend” goodbye, and the Bears will start their jig again on the short side.  So the bottom line of all the efforts of the last three weeks has turned out to be a Fakey, which was to be expected as we have learned since Flash Crash Days:

However, there is a sense that unless there is catastrophic news, this market is marking time, zig-zagging back and forth with an edge to the upside:

…And here for those for whom Hope springs eternal, is an idea which my good friend Maynard Burstein gave me a winky-winky on.  Keep an eye on it:

As I close this blog tonight, I spare a thought for the families of the victims of 9-11.  Out of that deep sadness came a spirit that united this country as it was never united before or since.  If only we could wave a wand and capture that feeling of comradeship again instead of the bickering we see is my sincere wish.

Best Regards, Ian.


Copyright © 2007-2010 Ian Woodward
Disclaimer: Commentaries on this Blog are not to be construed as recommendations to buy or sell the market and/or specific securites. The consumer of the information is responsible for their own investment decisions.