Ian Woodward's Investing Blog

Archive for the ‘Market Analysis’ Category

Stock Market – Short-Term Game Plan

Tuesday, January 12th, 2010

I am in the middle of feverishly writing the Newsletter due at the end of the week, but felt I could give you a Heads-Up to summarize the Stock Market Short-term Game Plan:

       pic

My good friend Chris Wilson is a Guru at Point and Figure Charting, so I think he will get a kick out of this simple chart which I hope says it all for a Short Term Game Plan:

   chart

Best Regards, Ian.

The Stock Market Tsunami Warning Signs

Saturday, January 2nd, 2010

In my e-mail bag, I had a good friend Bill Jagoe who attends our seminars, ask a series of questions regarding exit and entry for Type 4 Buy and Hold Investors, so here is my detailed response to him:

picture

In the weeks and months to come, I hope this blog note will serve all Type 4 Buy and Hold Investors by helping them stay on the right side of the Market, just as earlier blog notes did when it was time to exit back in 2007 and 2008, and then come back in 2009.

Question:  Could someone tell me how Type 4 investors should use Ian’s Mark Pharr Chart view?

Ah Bill…I sense the Type 4 Buy and Hold Investors are getting a trifle fidgety and want to have their ducks lined up for a proper exit!  You are in luck, as not only will I cover the Mark Pharr Chart but also the Bill Jagoe Chart as I will elevate you to the peerage in the History of Using Bollinger Bands (BB’s) for Type 4’s.  Here is a full explanation as promised in my bb note to you.

Let’s first put the Mark Pharr chart in context…in a similar vein to when Mark asked back in 2007 for a simple game plan to help him get out of the market at the right time.  I gave him five simple steps of expectations:

1.  A Large drop in %B of the BB’s of > -0.24, at least a small Kahuna down.  It happened.
2.  A drop below a reading of 0.60 in %B…it happened.
3.  A hold at a %B of 0.3 or it dies.  It died.
4.  The %B breaks down through the Bandwidth.  It did.
5.  An ultimate drop of >10%.  We wish it was only 10%, but that was the first drop back in 2007-08.

I am pleased to say that he took my suggestions and got out long before there was major damage.  Below I show one of the charts I used together with other references, which those of you who attended any seminars since March of 2007 can find on your Seminar CD, or on the March 18, 2008 Blog Note:

mark

As a summary of how Type 4 Investors have stayed on the right side of the market since then, here is what transpired after the Black Swan Caper, a disaster we would not wish to live through again:

swan

The HGSI Software has given us substantially more visibility since then and here is an updated view of a chart that used both a very long term 89 Periods along with the 40 Period as shown below.  Note I have added the famous Ribbons of Green and Red, which you will be able to use with fast response once the next release is out…which will be very soon.  For now, it doesn’t take a minute to visually see the “Days of Wine and Roses” in 2003 to early 2004 which is highlighted in the green dotted frame, just as we have right now, with the points of entry back then and more recently in July of 2009.

89

1.  ALWAYS, I repeat ALWAYS, trust %B going up or coming down through the Bandwidth as your PRIME Target for when to enter or exit.  Note that on a 40 Period Weekly chart the %B is currently at 0.8937 and the Bandwidth is at 0.3923, so at this time you have plenty of cushion before the %B comes down through the Bandwidth.

2. The second Golden Rule is that 77% of the time over 50 Years, the S&P 500 has corrected <8%; it is 70% for the Nasdaq.  So as a Type 4 Investor if you are prepared to take a chance that you have roughly 3 chances out of 4 that you will not lose more than 8%, then that is the second trigger.  More than that and you kiss it goodbye.  Otherwise you know the rest of the sad story having been through 2000-03 and 2007-2009, along with the rest of us.  It hurts when you lose an Intermediate Correction of 12% to 16%, and worse yet, a Bear Market Correction of >20%.  Your own Portfolio will be substantially worse than these numbers!

3. The advance warning for both of the above to occur is that BONGO WEEKLY will turn Red…thanks to the team of five HGSI Users who did stalwart work on the Bongo Indicators.  Bongo Weekly is slow to turn, so remember it is a godsend for Type 4 Investors, who are reluctant to be jack-in-the-box Investors and are prepared to give up some of their Profits until their stomachs can’t stand it any more!  However, given that the two patterns are similar at this stage of events, it would pay for Type 1, 2 and 3’s to also watch for a heads up on the Weekly Bongo turning Red, as that is a significant event that should not be taken lightly.

4.  By then, all the Ribbons on the “wc chart” will be blood red, and you will be sporting a score of -5 or worse, especially if we have a sharp jolt with a Phoenix and Red Kahuna down (> -0.40).

5.  The Slow Stochastics shown on that View will break 80 and then 60 in a hurry. It is currently at 99.55…highest yet in six years.  However, note how it stays up for very long periods and it takes a lot of deterioration on all the other items before it snaps.

6.  Wilder RSI will break 50 to the downside. It is currently at 58.32 with the Nasdaq Weekly view.

7.  I promised you a Bill Jagoe Chart which will elevate you to the peerage along with Mark Pharr in the annals of using Bollinger Bands.  After much soul searching, the problem we have with the current long term BB’s of 40 and 89 Periods is the “Black Swan Caper”, rendering it too loose to give sufficient warning EARLY enough, should things go south in a hurry.  So, I offer you the 40 and 20 Period BB’s which bring both the Middle Band of the 40 Period and the Lower Band of the 20 Period together and that coupled with the Nasdaq crossing down through them would suggest the party is over…at least for a 10% correction if not more.  These are currently at 1966 and 1981 with the Nasdaq Index at 2269 on a Weekly Chart, while the Middle Band for the 20 Period is at 2132.

By now you know my process well enough that I’m NOT Saying this WILL Happen, but it MUST Happen to Exit.  The Red dot is when the Nasdaq crosses over both the 40 Period Middle Band and the 20 Period Lower Band by using the old trick I have taught you to overlay past history from 2004 on the current chart as shown in the next two slides!

fanfare

extended

a.  Given the natural tendency for Bulls and Bears to always hold or break at even numbers, the battle will be first fought at 2200 which is only 3% below the current Close.

b.  If that is broken, expect the next battle at 2132, which is 6% down.

c.  The last resort will be around 2000, or essentially 12% down.

Obviously in the scheme of things, the first two targets are tolerable to a a Long Term Type 4 Investor, and I am sure they will start to scratch their heads at 2100, which is 7.5% down.  The rest depends on individual stomachs for Risk/Reward tolerance and proper Money Management.

Lastly, I have focused on the downside scenarios.  However, as we well know, the other two scenarios are sideways or up, and we shall have to wait and see what the New Year and the Earnings Reports bring.   Once again here is my New Year’s wish for all of you:

puppy

Best Regards, Ian.

Using Chaikin’s Money Flow for Snakes and Ladders

Tuesday, December 29th, 2009

A Happy and Prosperous New Year from the HGSI Team to you with a gift for the New Year. In my last blog which gave you a smorgasbord of goodies to watch in the New Year, the one that stood out like a sore thumb was Chaikin’s Money Flow.  So with my Partner Ron Brown’s help, we came up with the following four snapshots which should keep you on your toes in the New Year.  I modified the 9a Key View on the HGSI Software Charting Module to include two other periods besides the standard 21-Period.  They are the 13 and 34 Period.  Ron and I felt that the 50 period was too slow and didn’t add any information.  Just make two new windows and change the 21-period to 13 and 34 respectively and color code them differently as shown below and you are done.  Make sure to select “histogram”. 

Shown below are both Daily and Weekly Views for the NYSE and Nasdaq, making four snapshots in all.

           nyse daily

           nasdaq daily

           nyse weekly

           nasdaq weekly

The bottom line messages are straightforward:

1.  Since the Nasdaq is the Strongest watch it first; then the NYSE for a breakdown below zero

2.  With a correction to the downside, Chaikin will go Negative on the 13-Period first, then the 21 & 34

3.  Early Warning after Chaikin turns negative is the %A/D Ribbon turns Yellow and then Red

4.  Chaikin Targets for the Upside Scenario are above 0.30 and preferably 0.50 for a continued Rally

Best Regards to you all, and may all your trades be strong is the sincere wish of your friend, Ian.

A Review of Stock Market Internal Factors

Sunday, December 27th, 2009

As we enter the New Year, I felt it important to show the current status of the various
Internal Stock Market Factors we review from time to time and to show the strengths
and weaknesses at this juncture.

picture

The Saw Tooth Game Plan I introduced nine months ago is still intact and up 69%:

saw

This Rally is now 69% up for the S&P 500 since the Base Low in early March 2009, so
with the Year End Bonuses at hand, the “Composite Man” may soon be ready to take
a breather and force a correction in the New Year.  The Rally has been in three Phases
as shown below, with the current phase more volatile than before.  As you will quickly
see we dodged a bullet around November 1, when the Internals all faltered, but they
have revived since.

nyse

The IBD Total number of stocks peaked in 2007, and after a precipitous drop of ~2000
stocks, it has rebounded by 1000.  It needs to now add an additional 300 stocks for
this Rally to continue.

6000

The Advance-Decline line is very healthy; infact it is too steep to maintain.  Watch!

ad

The McClellan Summation Index has bottomed and again showing signs of strength:

sum

As one would expect, the stocks above the 200-dma is ~90% and it needs to stay up.
Any sharp drop in the New Year can cause concern for about a 10% correction if the
2004 timeframe is any guide.

200

The Number of Distribution stocks %E has been dormant for a long while and any rise
above 6% should be watched for a quick distribution as shown below:

e

The Leadership Stocks had a Major Rotation at the end of October and is still at a low
value of 13%.  It needs to rise rapidly to show that there is indeed new leadership:

a

However, %A+B is strong at ~60% and needs to stay up above 65% for the rally to hold:

ab

Thanks to an Idea I got from a friend Billy in Belgium, this chart uses a Reverse Score
to evaluate the ABCDE statistics.  It needs to stay above a reading of 2.37, and again
we had a serious shot across the bow in late October when it plunged to 1.90:

reverse

The New Highs are Strong at >400 and the New Lows are dormant as we would expect:

highs

The Up:Down Volume Ratio is weak and needs to get back above 1.2 in a hurry:

updown

If Chaikin’s Money Flow is any indication, the Big Guns are not participating…Beware!

chaikin

Here is the overall assessment for the Internal factors shown above.  It is a strong
report, but there are weaknesses, particularly in %A Accumulation, Up:Down Volume
Ratio and Chaikin’s Money Flow.

in

All Best Wishes for a Happy and Prosperous New Year.  Ian.

Phoenix and Kahunas Volleyed and Thundered

Friday, December 18th, 2009

It’s that time of the year again, so Season’s Greetings to you all, thanks for your continued support and all Best Wishes for 2010 from the HGSI Team…George, Matt, Ron and Ian.

santa

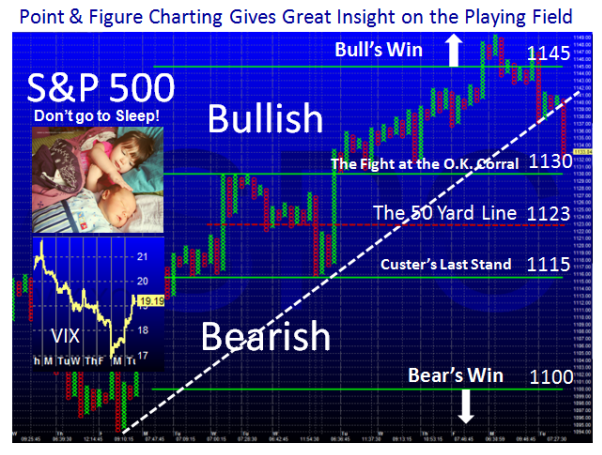
After another ho-hum week, the Bulls and Bears are still at the 50 Yard Line in this tug-o’-war.  You have the weekend to digest my gift to you at this festive season.  It kills several birds with one stone, particularly after registering the third Phoenix Signal yesterday in the last month, with no response from the Bulls to counteract it.  Please don’t interpret this at this stage as anything but caution, as the basic internals have not changed significantly.  The note is in three parts:

1.  How to read what has transpired over the last nine months to understand the signals working together.

2.  The Current Status

3.  What to look for and anticipate MUST happen for a move in either direction, though in this case I have only covered the downside criteria.  I am not saying they will happen, that is in the lap of the gods, but at least you’ll recognize it when you see it. 

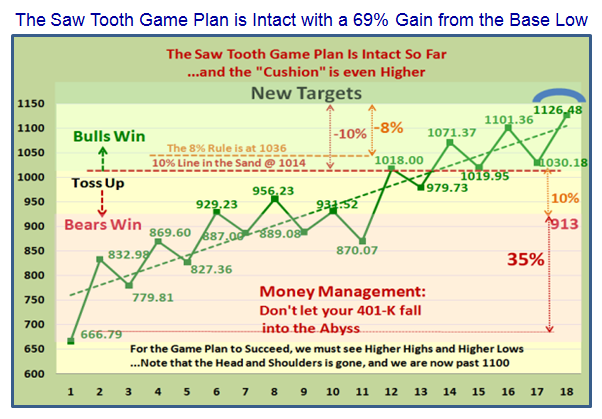
The upside scenario is simple:  Get above 1111 on the S&P 500 with gusto; until then concern yourself with what I cover below on the downside.  
kahunas

The Last Nine Months:   

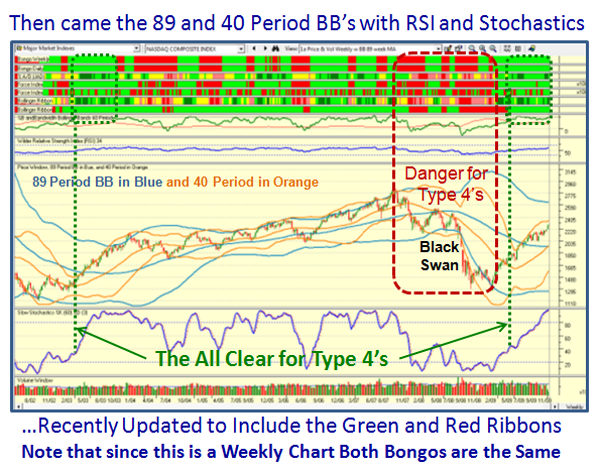
Here is my latest interpretation of Phoenix’s at this level when the Market is at or close to a High as opposed to being at a Low, when indeed a Phoenix coupled with a Bingo on the same day would signal capitulation.  We know when that occurs, and is followed by a Eureka either the next day or a few days later that there has been exhaustion to the downside.  It is time to look to the upside, be it a bounce play or a full blown rally. 

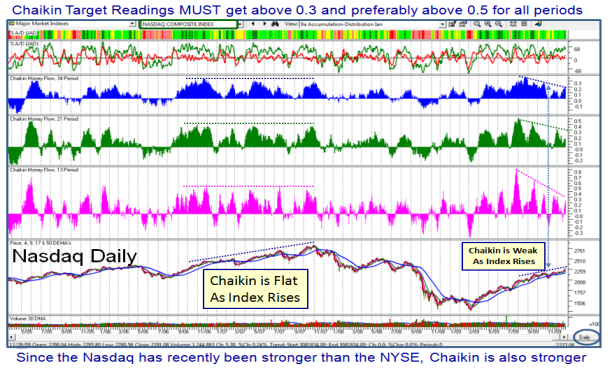
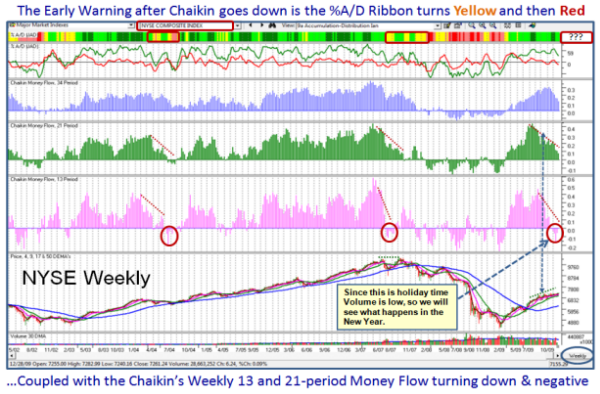
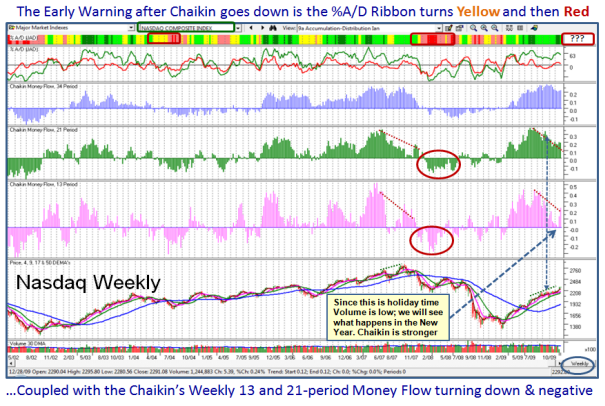
I hope by now that you have understood that I am using a combination of Richard Arms and John Bollinger through my impulse indicators measured at the EXTREMES of their formulas to show which way the wind is blowing.  In other words when they “fire”, they are rare beasts and one should sit up and take notice.  Hence, I use the NYSE with the “wc” chart to see the relationship between Eureka, Phoenix and Kahunas, but will toggle to the S&P 500 and Nasdaq for confirmation:

Let me first set the stage by saying we all recognize that to all intents and purposes, the market for the last 30 days has been in a very tight range between 1089 and 1111 on the S&P500.  The line in the sand is at 1100 as the point of demarcation between Snakes and Ladders as described in my recent blogs. 

1.  Three Phoenix signals in a row without a response from an Eureka spell the Bears are gaining control with no serious response from the Bulls.

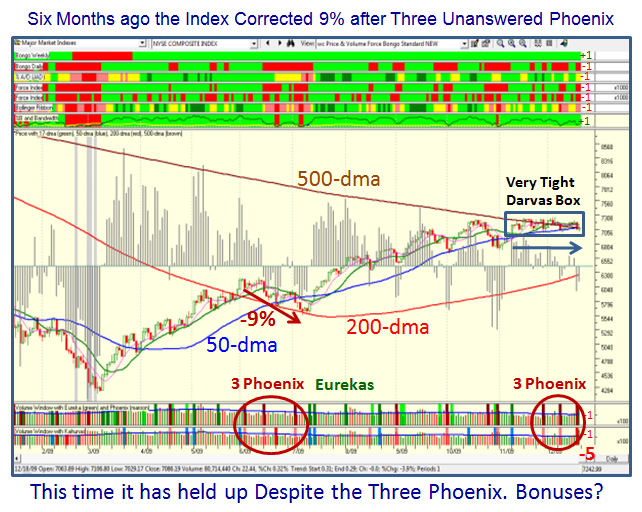
2.  The most recent example was the period from 6/3/09, 6/15/09 to 7/02/09, where we had just achieved a 42% Rally off the bottom on the S&P 500…so it was no surprise we had a correction of 9% during this period for both the S&P 500 and NYSE, and about 9.3% for the Nasdaq. 

3.  During these past nine months it is the only period where there were no Eurekas in between, suggesting the Bulls were not defending with vigor, and the Bears ruled the roost.

4.  Since then, we have noticed that every Phoenix has been trumped by a Eureka, or even two in a row within two or three days which have signaled the Rally is on again and the Bulls were flexing their muscles.

5.  …Until we get to the Dubai Caper on 11/27 which started the first shot across the bow with a Phoenix, and the market had already been in the tight Darvas Box I mentioned above.  The second was 12/8/09 (Dave doesn’t show one on 12/8 because he should have set the ARMS portion of the Phoenix to 2.43), and the latest today on 12/17/09.  What has held the Rally together is the unusual yo-yo that the market has played for the past seven weeks ever since the last Eureka on 11/9/09.  However, yesterday’s Phoenix is accompanied with a big Kahuna to the downside and on heavy volume, being expiration week.  It is also understood that much of this volume was due to CITI.

The Current Status:

Just stare at the extreme right hand side of the chart using the “wc” view and the NYSE:

A.  We can quibble about the exact count, but most will give me a score of at least -5, which is a strong shot across the bow. However, that is hardly any different than the last two occasions we had a Phoenix.

B.  The two remaining greens are the Weekly Bongo and %B which is still just above the Bandwidth.

C.  Sooner rather than later we will know if this Market will break to the downside or continue up, but all are waiting for “When will that happen?”  

So here is what to look for on the Downside:

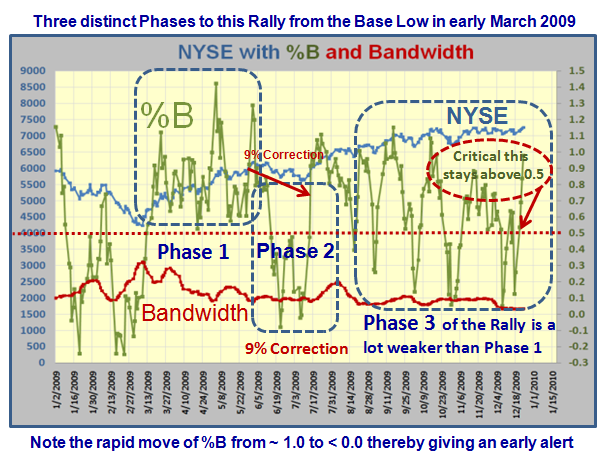
1.  The %B will go down through the Bandwidth and turn from green to red. The reading is 0.15, so it should be the first to go.  If the drop at this stage is >-0.35, with another Kahuna to the downside, we will have the key one day signal that this Rally is over.

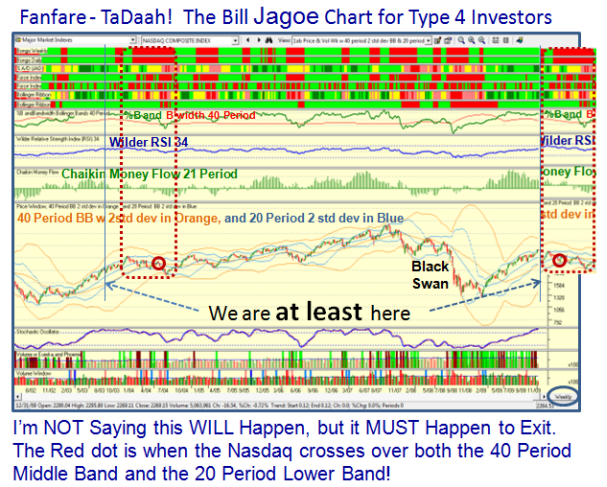
2.  The NYSE Index is just below the 50-dma and for that matter the 500-dma, and any move down further, coupled with the S&P 500 crossing below the 50-dma, i.e., below 1089 with gusto will do the trick.

3.  Bongo Weekly at last turns negative and that will really open up Dave’s beady eyes!  Stay calm until then, but it is a late signal.

4.  However, the real zinger will be when the %B reaches a reading of -0.2 or worse, as that has only happened nine times before in the last 12 years, three of which led to the 1987 crash, and two during the 2008 Black Swan dive. 

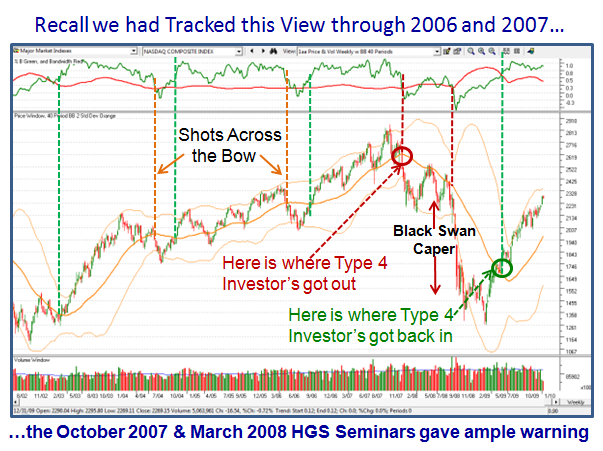
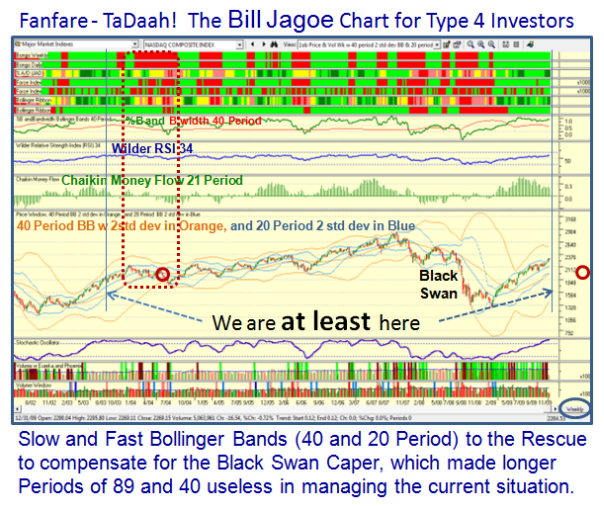
5.  Now please understand that when the Bollinger Bands are as tight as they are now, i.e., Bandwidths of less than 0.03, it is an unusual state and last happened for any length of time around the late 2006 to early 2007 timeframe, before there was a sharp drop of about 5% in a week.

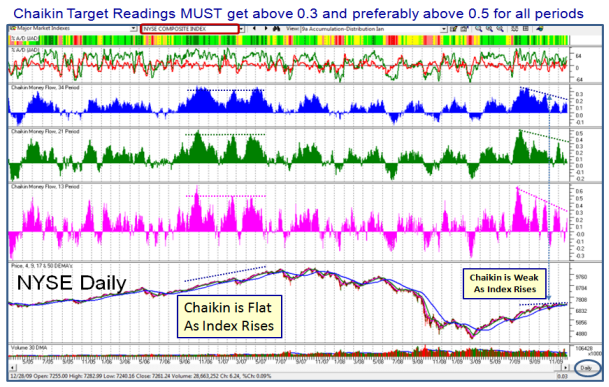
6.  Don’t expect any Bingos to appear before the RSI on the NYSE gets below 30…the reading is up at 47 at the moment, so we would have to see a total deterioration of the Index for that to happen.

The Three Scenarios to the Downside:

A.  No worse than an 8% correction

B.  A 12% to 16% Intermediate Correction, and you will feel the pain

C.  A complete Nose Dive for another Bear Market Correction, and you already know what that feels like.

I say to you “Follow the Signposts with the wc chart”and you will stay on the right side of the Market.

Best Regards, Ian.

Copyright © 2007-2010 Ian Woodward
Disclaimer: Commentaries on this Blog are not to be construed as recommendations to buy or sell the market and/or specific securites. The consumer of the information is responsible for their own investment decisions.