Ian Woodward's Investing Blog

Archive for the ‘Market Analysis’ Category

Wall Street has Spilled Over into Main Street

Wednesday, November 19th, 2008

dam

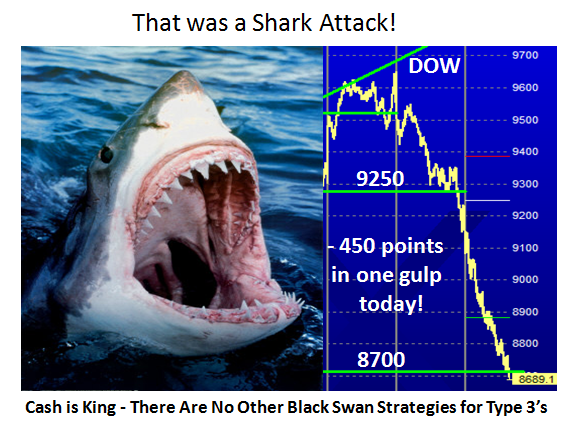
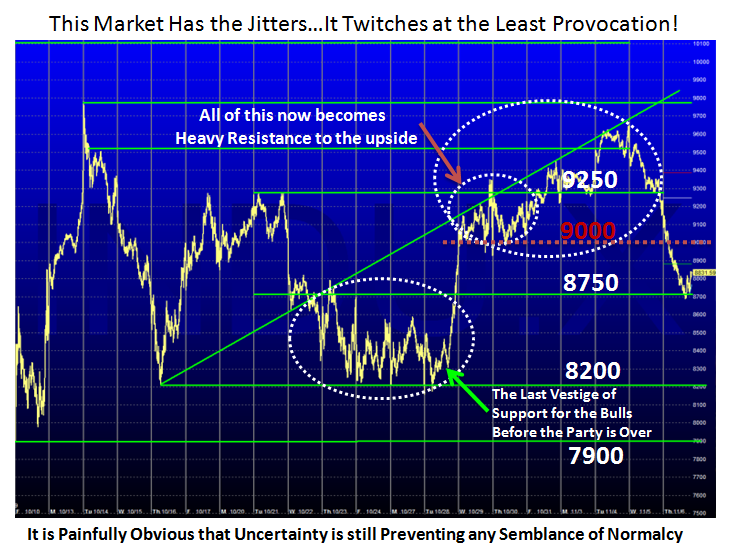
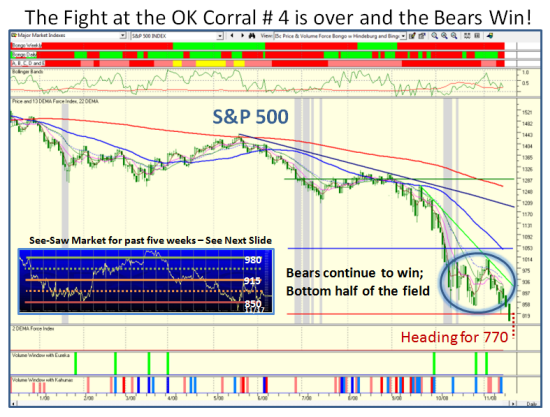
During the past several months I have tried to steer you through the mine fields and give you ample warning of the Lines in the Sand at critical points in time.  Past Blogs have featured key skirmishes between the Bulls and Bears at the O.K. Corral and we have just finished Round #4 which the Bears have once again won.

chart

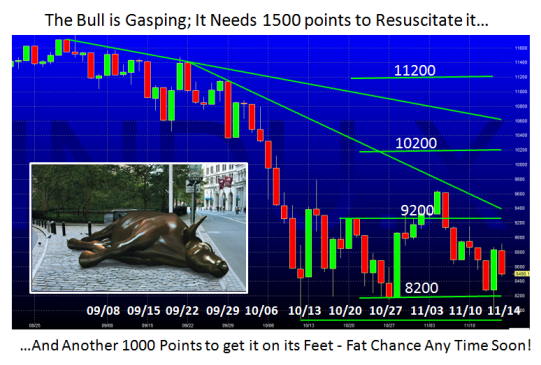
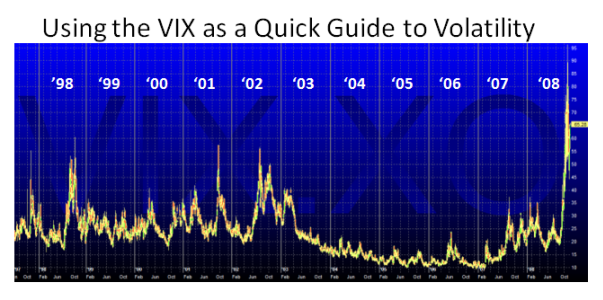
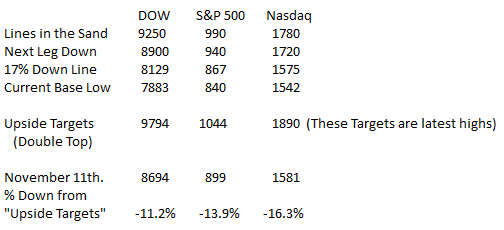
In recent blogs I have shown you the boundaries in which the “Ball Game” was being played to keep the picture down to its simplest form.  The chart below needs little explanation as you have seen this from time to time in the past.  What is important is that the Last Line in the Sand is broken and it will take a Thanksgiving Gift, A Santa Claus Rally and a “Hail Mary” Pass to head back into the Zone again as shown above and below:

chart 2

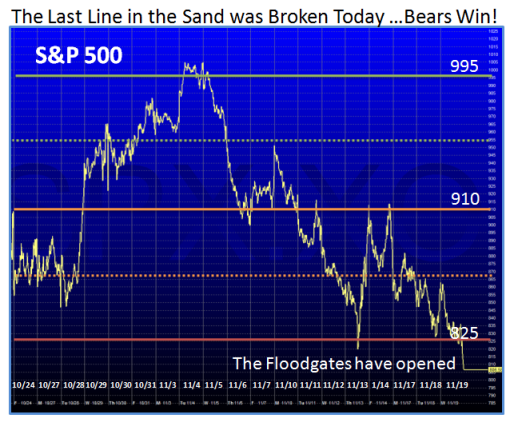
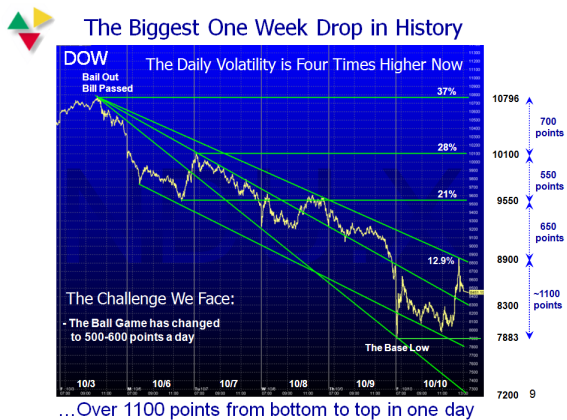
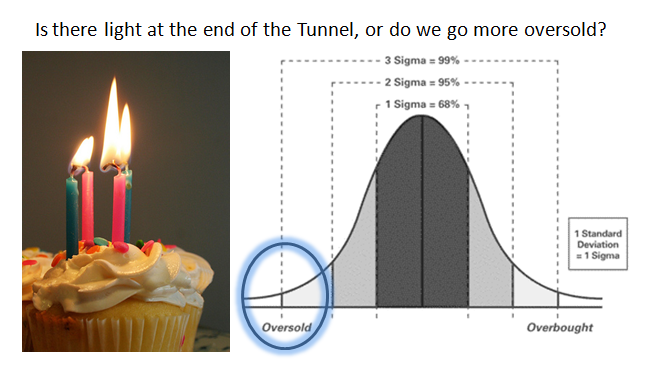
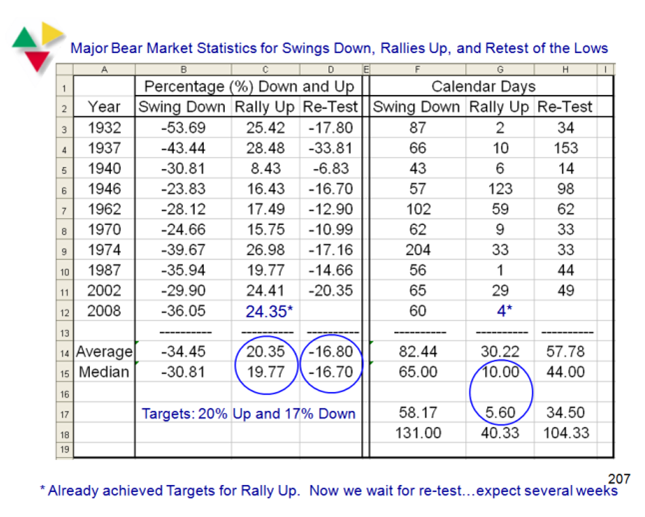
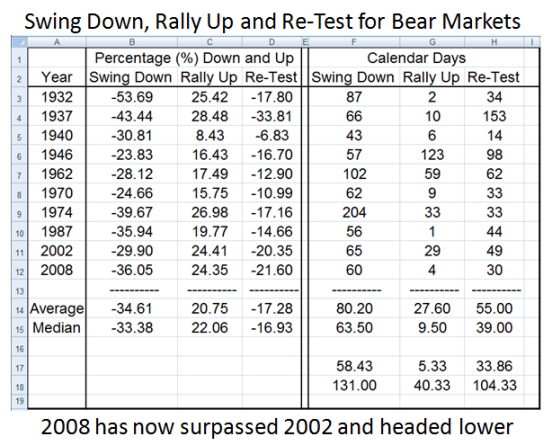
Worse yet, given past statistics of Bear Market Swings Down, Rallies Up and Re-Test Statistics we find ourselves in the dubious spot of having beaten all of them to the downside except the one of 1937, and heaven forbid we head on down that low:

swing

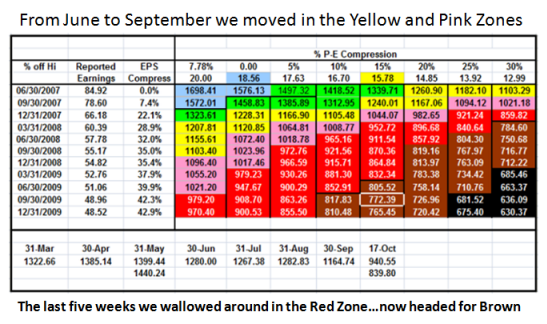
At the recent High Growth Stock Seminar completed in late October just four weeks ago, I presented the following chart as evidence that Wall Street had now impacted and spilled over into Main Street by describing the effect of the downgrading in Earnings Estimates as we go forward into 2009.  The chart below is a picture I put together to show the effect of both EPS estimates (past and future) on one axis with P-E on the other to show the net effect of what the S&P 500 can support as an Index Price.   Sad to say we have wallowed around in the Red Zone of late in these past five weeks and have now broken down into the Brown Zone as shown on the chart below.   I suggest we are now headed for 770 (between friends) on the downside, unless we get a humongous Bear Market Rally:

spreadsheet

I wish I could be the bearer of glad tidings at this festive season, but it is better to know the plain facts and the logic that supports them than for me to pull the wool over your eyes.  It goes without saying that we start the entire process again of Capitulation, Reversal Day and Follow Through Day(s) with Eurekas and Kahunas to support the Bull enthusiasm and that can take another six to nine weeks.  In addition we need New Highs on the NYSE to come out of the woodwork and New Lows to dampen below 50 before we have a glimmer of a proper Bear Market Rally.   When Base Low Stakes are uprooted, we now wait to see the above before we can even begin to suggest we have found “A Bottom”, leave alone “The Bottom”.

Best Regards, Ian.

In the “Good Old Days” Life was a Lot Calmer!

Friday, November 14th, 2008

picture

My good friends are in the swing of things and send me pictures I might use for the blog, which keeps me on my toes.  Please keep them coming.  Here’s one that fits very well with the times.  Can you imagine giving up all that gain we had yesterday with another down day of over 350 points on the DOW today?

dow chart

The chart shows we have been in a trading range of 1000 points or so for the past five weeks.  The Market is trying to put in a bottom, but every half hour or so there are alternately both Bull and Bear traps and of course it gets a trifle tedious.  I haven’t drawn the downside target, but the symmetry suggests 1000 points down from 8200 which would take us down to 7200 in a jiffy…maybe two days of heavy selling.

The upside moves are more constrained and it will take a Santa Claus Rally to get some steam going to get past 9200.   As I showed the other day we are in such oversold territory that all Technical Signals call for a Bounce Play, but essentially the extent of the bounce is little more than short covering, only to start the same process all over again. 

The mood is obvious in that there is so much Uncertainty that there is no Conviction by the Bulls other than to snap up a few bottom fishes when they feel the stops for the shorts a few points below the previous low will give a snap back until the so called rally if any runs out of steam within a day.  Meanwhile the nimble can switch back and forth between the likes of the QID/QLD and are happy campers as they are nimble and stay glued to their screens.

However, although the Darvas Box is over 1200 points around the NYSE high and Low these past five weeks, there are a few “Sherlock Holmes like” glimmer’s of clues that we may be gradually trying to repair at this level.  I come back to my trusty chart of the 20-dma 1, 2, and 3-std deviations on the Bollinger Bands to show you what I mean:

nyse

Best Regards, Ian.

“Whither Goeth Volatility?”

Wednesday, November 12th, 2008

picture

Question: Mike Orlyk Says:

Ian – I am trying to understand your statement “seeing 300 to 600 point swings a day as commonplace on the DOW, 50 to 80 on the Nasdaq and 25 to 40 on the S&P 500″ in context with the remainder of the blog.  Are you saying to expect such swings until a bear rally finally manifests itself?

Also, within the past swing down/rally up/re-test shown in your spread sheet was the volatility, at least on a percentage wise basis, equivalent to what we are seeing today?

Thanks,  Mike

Reply:  I am saying that the Days of Wine and Roses regarding Volatility are long since gone and we will not calm down for a long while to come.   I doubt if the wild swings will change when we start a Bear Market Rally.   It is far more likely that it won’t calm down until we see a NEW BULL MARKET Rally, which to my mind is at least 6 to 9 months or even a year away.

The only Measuring Rods I can offer to answer your other question is to take you back in time to May through July 2006, when we first noticed a string of six Eurekas in a row which we ultimately found in hindsight was due to excessive volatility and no fault of
the Eureka Indicator.  After a long hiatus, So far we have had three Eurekas in quick succession, so you can immediately see a similar pattern.

june

The second Yardstick I can offer you was in the March Seminar where I showed a chart of a Day in the Life of a Day Trader and at that time the swings were 150 points a day:

 march

It goes without saying that was chicken feed to what we have now where the Volatility had increased four times at the time of the precipitous drop we had a month ago. It is half that now in terms of daily swings, but at the next sign of a crisis we can experience
going back to 600 to 1000 points a day or two days at most.

dow

Of course the VIX pundits know all of this only too well and point to the VIX chart as a quick confirmation that times have changed and that is the quickest way to get a feel for the picture over time.  To my beady eyes it suggests at least a “twofer” compared to the
2000 to 2003 timeframe: 

vix

So what has caused all of this?  I think I mentioned at least three items, one of which is the rage in playing double and now triple ETF’s and the second is the “No Uptick” rule for shorting.  The third is the natural jittery market conditions due to Uncertainty.  That
item is always the killer.  Bears romp around while the Bulls stay in hiding.

I’m sure the pundits of 1987 can wax eloquently on volatility of the crash, but I was still working for a living back then and was not into such esoteric items when my 401K took a dive that set me back a couple of years at least in one week flat.   Fortunately my sons are in better shape this time around with the “ole man” to guide them.

My point is don’t expect calm waters until 2010 if past history is anything to go by.  Therefore it plays into the hands of the Type 1 and 2 Moment and Day Traders for a long while to come.  Type 3 Swing Traders will look for the key signs covered in the Newsletter by Ron and I for a Bear Market Rally.  Type 4 Long Term Buy and Hold types can hibernate for a while until we see a Golden Cross of the 50-dma coming up through the 200-dma.

Best Regards, Ian.

It’s Very Clear our Volatility is Here to Stay!

Tuesday, November 11th, 2008

light

With apologies to George Gershwin  and an old favorite tune many moons ago which Gene Kelly danced with Leslie Caron on the banks of the Seine, I’m afraid our Volatility is here to stay forever and a day!  Times have changed and we will need to get used to seeing 300 to 600 point swings a day as commonplace on the DOW, 50 to 80 on the Nasdaq and 25 to 40 on the S&P 500.  Likewise, 20% knee jerk moves within a few days both up and down should also be expected to be commonplace.   It will be a while before this volatility subsides. 

The following is a spreadsheet of the nine other Bear Market occasions where the “Swing Down” has been greater than 20%, followed by a Rally Up and then a re-test of the Lows .  The picture below is worth a thousand words and confirms the expected odds:

stats

I have shown the % Gain/(Loss) and the calendar days for each step down, up and down again.   As you can see on the left hand side, the average and median numbers are so close to each other that the probabilities of these numbers occurring are high.  On the right hand side, the days are all over the place, but if you look at them carefully they fall into two camps, short and long term. 

Another point to notice is that the re-test is invariably less than the Rally Up, which suggests that we have probably found a bottom, unless there is some other major global surprise that raises its ugly head.  The Bounce Play occurred in two days flat and the re-test started on October 14, 2008.  It is now a month since that high, so we are on track to seeking a bottom soon.

The above statistics are for the S&P 500.  Note I am using 17% down based on the above for the re-test of the Lows; anything worse than that suggests 2002 like numbers of >-20%:

The Key Lines in the Sand to the Downside are:

table

We can see that we are just 6 points away from being 17% down on the Nasdaq, and no more than one day’s worth for the DOW and S&P 500.  As we can see, the DOW has behaved the strongest in this past month with the Nasdaq the weakest.  It has been 29 days since the re-test started and as one can see from the table, three of the readings are 33 or 34 days for previous re-tests, so we are on track!   We must hope that this will not end up with another crater to the downside, and that we will see no worse than a Double Bottom for now before we head back up. 

The $64 question is “Are we close to the end of the gloom and doom or do we head down further with more misery in store before this market can recover into a Bear Market Rally?”

The market started to drive up last week where two Eureka’s accompanied by Kahuna’s showed some signs of recovery underway.  Once that trend upwards was broken to the downside as we witnessed these past three days, the whole process must start again, so we must look for a Reversal Day as the first step in the recovery process.  We first look to Capitulation with a Spike in New Lows which is currently at 324, but could get as high as >1000, then look for a Reversal Day, and a Follow Through Day thereafter.  The short answer is to take it a day at a time for the moment as the market is still too jittery to give a clear indication of the start of a bear market rally.

Best Regards, Ian.

This Stock Market has the Jitters!

Thursday, November 6th, 2008

shark

We got our answer today…the DOW could not hold at 9250 and down she went for another 443 point day to the downside.  It has become a trifle monotonous to see the same story unfold these past four weeks, with any hope of a Bear Market Rally now very suspect until we get through all the overhead supply that the last week has provided:

dow

The picture speaks for itself and this game plan is solid as to where the fight at the OK Corral is at.  At this stage of the Game, the only thing for Type 3 and 4 Investors is to sit in cash and be thankful for small mercies as this is too treacherous a market for one to throw your hard earned money at.  As I have said before Types 1 & 2 are enjoying the volatility and when  one can make 15% in a day on the FXP and 8% on the QID, that is money for jam.  Now we have the birth of triple ETF’s so those of you who are high rollers can enjoy to your heart’s content if you have the stomach for it. 

It seems we caught the proper mood at the seminar, and we will just have to wait and see if we can climb out of this mess.  Recall the overlay charts I cobbled up to show you what a double and triple bottom could look like and you will realize that we are faced with six months to a year of ebb and flow before we can even begin to think of a decent recovery.

Today’s action has broken down the attempted rally which has fizzled into a Broken Bounce Play.  As I show in the diagram, all the good work of the previous week which I covered in the last blog has been wiped out and that congestion we see between 9000 and 9250 now becomes stiff overhead supply.  We have to start all over again with Capitulation, Reversal Day, Follow Through Days, Eureka and Kahuna signals to the upside before we even get a glimpse of a new beginning.  At least we can say that we now understand the Bango Process, and you are the richer for having taken the time and expense to learn what to look for.

Now that “the buy the rumor sell the news” phase on the Election is behind us, the Market remains uncertain and that is what is causing the jitters.  It will not rest easy until the incoming administration identifies two key positions, Treasury Secretary and the Fed Chairman, and then watch out either way depending on whether the Market likes the selections or not.  Of course those are not the only concerns but in any event it seems obvious that this bottoming action will be a long drawn out affair and at this stage of the game, the odds favor the Bears.  After all the yardstick suggests we are but two days away from breaching the bottom.   Five percent days up and down have become commonplace, whereas a month ago we were marveling at it. 

Warren Buffet can afford to throw a few million here and a few there and a few more out the window and not flinch, but he must know something that you and I don’t know.  My suggestion is to let the market tell you what to do based on proven Stakes in the Ground and Measuring Rods, unless you are a soothsayer or have deep pockets like him.

Best Regards, Ian.

Copyright © 2007-2010 Ian Woodward
Disclaimer: Commentaries on this Blog are not to be construed as recommendations to buy or sell the market and/or specific securites. The consumer of the information is responsible for their own investment decisions.