Ian Woodward's Investing Blog

Archive for the ‘Market Analysis’ Category

Round #3 at the OK Corral is Almost Over

Tuesday, March 4th, 2008

Over several months since the market peaked in October, I have kept account of the critical fights for territory between the bulls and bears, and now we are into round #3.

where

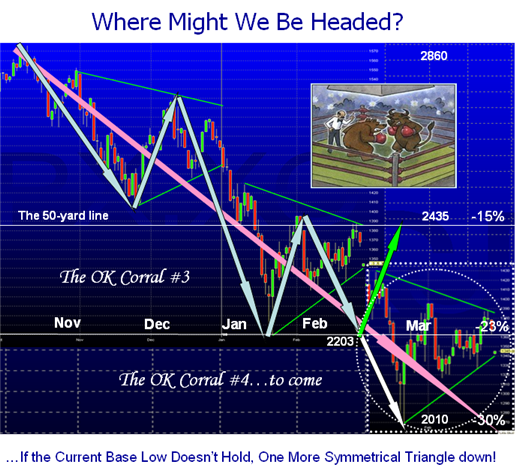
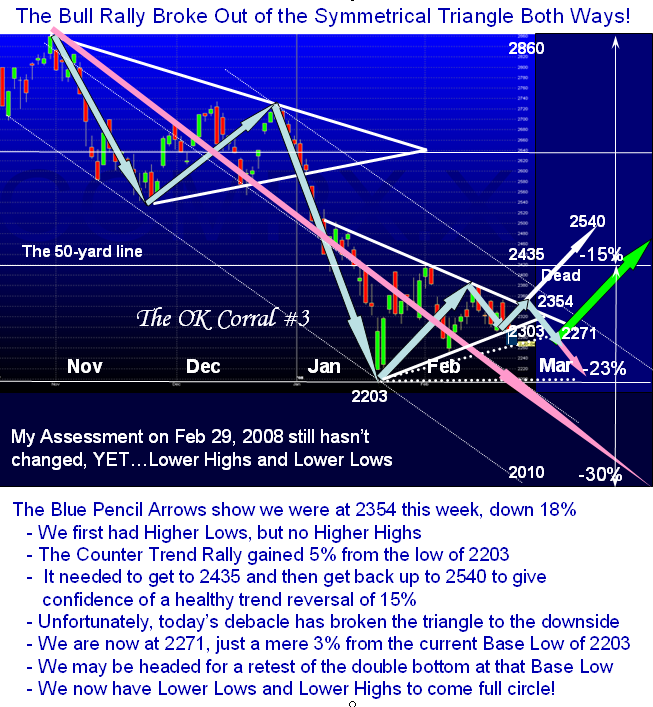
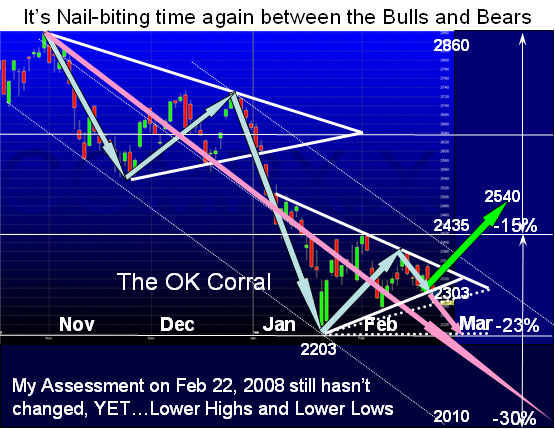
Round #3 of the Fight at the OK Corral between the Bulls and Bears is fast going to the bears despite the encouraging contra trend rally we experienced. It was still too weak to hold and having broken the triangle to the downside it seems we are headed down again to test the low at 2203. 


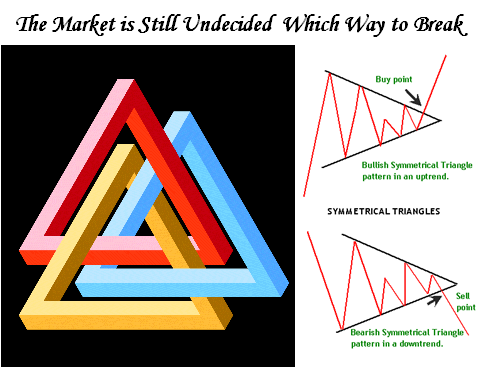
It is now very apparent that with today’s action that the odds are high that we will retest the previous low on the Nasdaq at 2203, as we are now just ~ 50 points off that low.  I felt it important to expand the playing field to include a HYPOTHETICAL third leg of a symmetrical triangle as shown in anticipation that at least we are familiar with what it might look like…should it come to pass.  Of course I am game playing, but there is little harm in having a game plan that bounds the Bulls and Bears Scenarios.


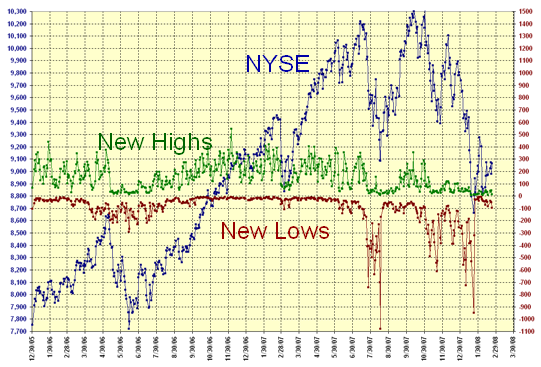
Bear Scenario:  Today was an extremely high volume day with 2.7 Billion shares traded on the Nasdaq, with 298 New Lows and only 14 New Highs on the Nasdaq.  With that low New Highs it will take a big positive surprise to turn the sentiment around, and deliver over 150 New Highs to kick start any form of rally.  The Nasdaq eked out a positive gain in the last half hour when Charlie Gasparino once again fed his latest understanding of the hope of an Ambac bailout which yet again took the DOW up to close just down 45 points and bring the Nasdaq back to positive territory having been down over 25 points for most of the day.  INTC’s bleak outlook, GOOG down below the $450 mark and Ben Bernanke speaking at a community banking forum in Orlando, FLA., indicating more foreclosures are expected as the sub-prime lending crisis gets worse, all weighed heavily on the Market all day.


Based on Past History of the Nasdaq Bear Markets since 1973, we already had a -23% drop when we last hit 2203 five weeks ago on January 22.  This drop was the second lowest since 1978 which had -20.37%.  The Average over the 13 Bear Markets is -36.5% so if we are to head down, it would not seem unreasonable to suggest that -30% would be an appropriate next leg down (white arrow).  That would put it only in the lower third of past results, and if and when we get there we can review the bidding further.  A 30% drop would put us close to 2010, which is the Base Low of July 21, 2006 when we first had a taste of the extreme Volatility we have today.  That is depicted by the White Arrow on the chart.


Bull Scenario:  Given that the hope of the Bulls is that capitulation will occur at the double bottom of 2203 and they can muster enough good news to propel them back up on a Bounce Play one more time, the best they can expect at the first instance is a quick repair to 2435 (green arrow), the 50-yard line I show on the chart.  What is significant in the psychology of the market about 2435, you might ask?  You will recall on January 10, 2008, Helicopter Ben gave a speech where he said that the Fed would “Take Substantive Additional Action” and the Stock Market yawned and went rattling down from there as shown on the chart.  That drove the chart down into the second symmetrical triangle.  It has yo-yoed for the past 5 weeks and has completely run out of steam, so the only other potential good news would be an extraordinary rate cut of 50 basis points prior to the March Meeting.

Best Regards, Ian. 

Plop-Plop, Fizz-Fizz, Oh What a Relief It Is!

Monday, March 3rd, 2008

plop

My good friend David Galardi says in his comment on the last blog that short-term Type 1 and 2 traders are suffering from too many anti-acids and bland foods these days, but the Types 3 and 4 are relaxing on the ski slopes and sitting in their fox-holes. The three Scenarios in play are: 

  1. Back down to test 2203 on the Nasdaq to form a double bottom and then maybe another attempt at a rally. 
  2. The Bears win the fight at the OK Corral #3 and we head down below 2203 to my next target at -30% on the Nasdaq of 2010. 
  3. An immediate turn-up today or early this week based on more rumors and/or real news that suggests yet again that all is well.  It wasn’t too encouraging today, but they brought the market back at the end so they may be able to rally it for a few days. This beast is like a lump of jelly these days and I need say no more. 

Different Stomachs enjoy different times: 

  • a. Very short-term players equally adept as you on playing the market both ways.  They know their trump card is “Nimble” as you know too well, have the stomach to play the reward/risk throw of the dice, and are making good money on both sides of the market.  They are the Type 1 & 2 traders who are now becoming even more adept in trading in moments, not hours or intra-day.   
  • b. Those who have already preserved their Capital and are sitting on the sidelines waiting patiently until we see better signs that the market has truly bottomed.  They accept the tongue in cheek scenario of using the Thick Blue Pencil Technique I use on a few previous notes to cut through to what the market is telling us now.  They are the Type 3 & 4 Investors who usually cannot or do not wish to get their hands burnt one more time on a hot stove, as one of our supporters tells me, and prefer to ski and sharpen their thinking for when the coast is clear. 
  • c. Those who are refining their T/A techniques and are finding new avenues to challenge them and use the Yahoo HGSI bb as a great sounding board to determine whether their Gann, EW, Reif, etc can be sharpened further on what has to be a challenging Volatile situation that most will admit have not seen before now and has become the norm.  It’s a friendly place to try out their skills, but heaven help them if their forecasts are not within acceptable tolerance levels, despite the last two moves by the herd, one up and one down based on nothing other than rumor. Amazing that these days a hard earned week’s profits are killed in an hour based on faulty rumor.  But that’s the nature of the beast and the times we live in. 

Only less than one month to the Seminar on March 29 to 31, so hurry up and sign up for the last few seats still available.   Best Regards, Ian. 

What Goes Around Comes Around

Friday, February 29th, 2008

what

  1. Who’s He?  He’s the CNBC commentator that specializes in the brokers, banks, and financial industry.  He’s the one that announced ABK “might” get a capital infusion to save their AAA last Friday 30 minutes before the bell which caused the big 10 minute complete reversal that gave everyone a sigh of relief.  He also went on this morning to announce the deal has hit a snag.  What lets him and CNBC off the hook is the words “might” and “snag”.   So much for gurus and it again goes to show that this market is so jittery that it has now become a “Catching a Pop or Short on a positive or negative news story” type of Market.  The constant reporting of rumors that subsequently prove to be incorrect by CNBC requires indignation and scorn for that kind of sensational journalism, yet they are the only game in town. 
  2. Unfortunately, it also causes havoc with the Technical Analysis to say nothing of your pocketbook, as certain targets are made or broken based not on solid Market Data; but micro-managing price and volume and time periods made by the herd based on phony news is what it has come down to.   
  3. In my blog of a week ago, I said “The good stuff on Symmetrical Triangles is still intact for yet another T/A element to watch for next week.  Unless there is again some follow through tangible information that breaks early next week on this subject to continue to drive the Bears to cover their shorts and possibly force the pattern to the upside, the odds still favor a move to the downside with Lower Highs and Lower Lows.”  Just as well I gave you the reasons to be cautious and also the Late Breaking News viewpoint that my good friend Mike Scott cautioned me on the whims and fancies of symmetrical triangles.  At the expense of being repetitive, Types 1 & 2 Traders can enjoy the Volatility to their hearts content; Types 3 & 4 should be patient, prudent and pounce when things look better.  If you haven’t read the blog on Tea Leaf Reading, that’s where you will find all the good words of wisdom which hopefully will save you money. 
  4. Here’s a repeat of the symmetrical triangle picture, and it still says my bias is to the downside.  We are currently at 2271. I have updated it to show that the challenge to retest the Base Low of 2203 is a lot easier than to head back up to 2435 and then 2540 by comparing the green and thin pink arrows.  Please also note that once at -23% at the Base Low, the odds are equal going to 2010 as it is to 2435, the 50-yard line of where I suggest the ball-game is being played, until I see a positive turn around from the current fight at the OK Corral, round #3.

chart

Best regards, Ian.

The Decision on Round #3 of the OK Corral Fight is Imminent

Saturday, February 23rd, 2008

This week every short term trader has been mesmerized by one question which had Bulls and Bears still wondering which way this market will break…up or down.  As part of their repertoire of tools rhey had the old favorite of Technical Analysis Symmetrical Triangles as the center of attention.

round 3

With Triangles uppermost on our minds, let’s review the bidding one more time, where I have now expanded the playing field from the High on October 31 at 2860 to a low which would take the next down leg to 2010 on the Nasdaq, as shown below.  This would imply a 30% correction:

ok  As the headline above says, it is once again Nail-Biting Time for Round #3 at the OK Corral to stay with the theme I set in an earlier blog.  Last week I showed you my assessment as we have watched the saga from February 8 to 15 and Now Feb 22.  Victory was snatched one more time from the Jaws of the Bears where with only about half-an-hour to go to the close on Friday, just like clockwork there was a surprise EVENT relating to bailing MBIA out of their Credit Loan Crunch problems.  That news drove the Dow up over 100 points and the Nasdaq about 40 points and left a long spidery leg with a Hammer for the day.  Technical Analysts were licking their chops that at least the decision on which way the market was headed was down, but at the close the question of which way next week is still in the balance. However, this is the fourth Friday in a row where it has closed up…net, net we do not have conviction one way or another to drive this Market with explosion to the upside or to the downside.  If it breaks to the upside we drive for 2540 and if to the downside, we retest the Base Low at 2203. 

The good stuff on Symmetrical Triangles is still intact for yet another T/A element to watch for next week.  Unless there is again some follow through tangible information that breaks early next week on this subject to continue to drive the Bears to cover their shorts and possibly force the pattern to the upside, the odds still favor a move to the downside with Lower Highs and Lower Lows.   

  1. The bias to the downside is reflected by the number of NYSE New Highs being only 15 and New Lows 97 on Friday…not good.  The weakness to the upside is exacerbated by the fact that since December 27 we have not had a single day with more than 68 New Highs over 57 trading days.   

  2. From past readings of failed rallies in Bear Markets, the longest that the rally has held is 18 trading days from the Eureka signal and we are right at that period.  This coming week is critical.

  3. The 200-dma has peaked and started to roll over.

  4. % B of the Bollinger Bands has broken down through the Bandwidth, again signaling weakness.

chart

Late Breaking News:  My good friend, Mike Scott, reminds me “that the closer to the apex of the triangle that the market or stock gets the more likely to get a head fake…A short false move prior to the real move.  This tends to sucker punch a lot of traders and those with stops placed close into the formation.”  Next week will be interesting to see how this unfolds.

Best Regards, Ian.

One Good Turn Deserves Another

Monday, February 18th, 2008

weatheronwallstreet.blogspot.com

weather 

On a lazy Monday morning when the Stock Market is not open, I felt I should pay a compliment to a fellow blogger “Buddy” who has my site on his Links and Resources, and return the favor by pointing out his blog to you.  It is a neat site, and what I envy is that his notes pierce to the heart of the matter, are short and crisp and just made for those in a hurry to get the feel for the Weather On Wall Street.  Put this site on your rosta of sites to visit and enjoy his insight.  Don’t mean to steal his thunder, but here are three headlines that sum up the weather in his eyes:

  1.  Short Term: Neutral…..watch for break up or down from triangles.
  2. Intermediate Term: Bullish
  3. Long Term: Bearish 

 …and he gives a short synopsis of why and what to emphasize.  It’s what I call “Good Stuff”.  Keep up the good work, Buddy. Best regards, Ian.


Copyright © 2007-2010 Ian Woodward
Disclaimer: Commentaries on this Blog are not to be construed as recommendations to buy or sell the market and/or specific securites. The consumer of the information is responsible for their own investment decisions.