Ian Woodward's Investing Blog

Archive for the ‘Market Analysis’ Category

This Roller Coaster Market is Insane

Wednesday, December 12th, 2007

Roller Coaster

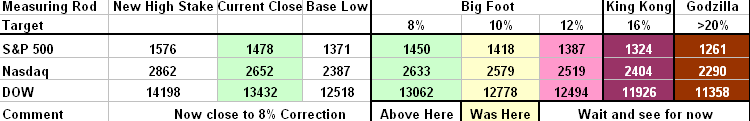
The DOW climbed a modest 41.13 points to 13473.90, after a session of wild roller coaster intra-day swings as the Market Gurus and investors tried to digest the Fed’s plans to add liquidity to money markets and also profit warnings from major banks:

  1. The DOW jumped more than 250 points at the opening bell, which took the wind out of the sails of the Bears initially and then gradually, had a day-long descent.  Trading was very volatile in late afternoon, with the Index going down more than 110 points below its opening level before finally settling up a modest 41+ points.
  2. J.P. Morgan Chase, and B of A were cut from buy to hold and Wachovia was cut from hold to sell.  Bank of America fell 2.7% after it warned of tough sledding to come, including larger write-downs on collateralized debt obligations and a fourth quarter that will be profitable but “disappointing.” Wachovia shares fell 3.4% after it said it sees higher provisions against credit losses and further mortgage-related losses.
  3. Import prices surged today and the weak dollar is causing inflation beyond tolerable limits.
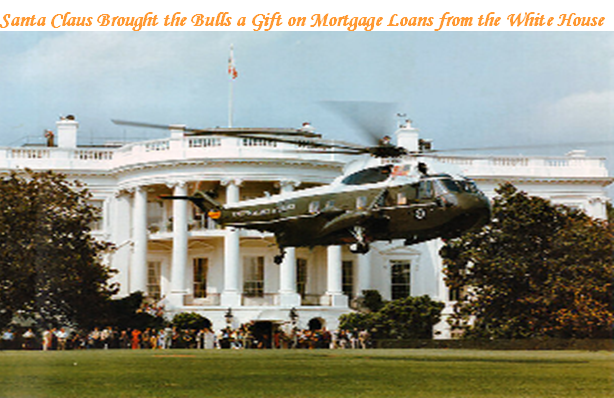
  4. It is plainly obvious to the common person that the FED is trying to pull every trick out of the bag in dribs and drabs depending on how the market reacts to their medicine.  What that does is make investors more suspicious that this Global Sub-Prime loan crunch has many more shoes to drop.

This has to be a trifle frustrating to the Bears who once again have been thwarted unless they were exceedingly nimble and made their buy and sell decisions in nanoseconds instead of seconds, skipping over milliseconds and microseconds these days!  That’s meant to be a tame joke, but it is not laughable as I am sure genuine Investors are in a state of shock and disgust.

I will go back to my foxhole and enjoy my Nephew’s visit from England and leave you as frustrated as I am, as even the Crisis Counseling Phone is out of order!

The only smile I can offer you is that the Post Office unveiled a 41c stamp of Frank Sinatra with that infectious smile and wearing his fedora hat.  It will be out in late spring, 2008.  What other blog gives late breaking news like that?  Best regards, Ian.

The Stock Market was Disappointed with the Rate Cut

Tuesday, December 11th, 2007

Greetings to my friend from Greece, Thrassos, who writes tonight: “Hello again from Greece Ian! Quite a day today and looking forward to hearing what you have to say on the near future. Best wishes for the season”, and so not to disappoint him as Helicopter Ben did to the market today, here is my assessment of today’s events:

scary ride 

A nearly 300 point drop on the Dow told the FOMC Chairman they were more than a little disappointed with the 25 basis point drop in the Fed Funds and Discount Rates.  The statement of continuing concern about Inflation exacerbated the flight from stocks to safety in bonds, and the Bears were out in full force for their long awaited taste of some red meat.  The feeling is that the Fed is behind the curve and has underestimated the threat to the general economy from the sub-prime loan debacle and of course the housing slump.   

As a result no Industry Groups were spared in the downdraft, with the Home Builders, Financials and Retailers hardest hit as one would expect.  What looked like a rosy recovery and a bridge to a strong Santa Claus Rally appears to have fizzled unless there is some quick turnaround in the psychology of the market as we head into the last three weeks of the year.  Although the Bulls can take some comfort that the Market Indexes had a healthy move these past ten days, sufficient technical and psychological damage has been done that the rally is now reeling on its heels, and the mood must immediately turn to being or staying defensive.   

To give you some idea of the quickness of the turnaround, the Ultra Short ETF of the NDX, i.e., Nasdaq 100…the QID went from a paltry 4 Million Shares to nearly 27 Million within 1&3/4 hours.  Likewise, the Inverse Chinese Ultra Short ETF, the FXP shot up around 10% in the same time period, so all is not well for the Bulls.  Frankly, the Bears have patiently waited their turn to garner some of the spoils and have been thwarted several times in the last few months just when they felt they had the Bulls on the ropes.  To rub salt in the wounds, the Volume was very heavy on this distribution day which saw heavy selling of over 2.2 Billion shares on the Nasdaq. 

In times like these, return to the basics and rely on the Stakes in the Ground that we have always used as the basis for establishing a bullish or bearish posture.  It was only a couple of blogs ago I dusted off the yardsticks and was pleased to show that we were a mere 5% from the highs set in late October.  Now we are below the 50 yard line having given up a hefty 2% on all Indexes today and we have cut through the 200 day Moving Average on many of the Indexes.  The next week will tell us if this was an over-reaction to a disappointment or whether the downdraft will continue in earnest. 

Targets  OK

As one can see from the above diagrams, it is not a case of panic stations yet or throwing in the towel, but the only near term help for the bulls is that the correction halts at the natural right shoulder level around the 1446 level which is the 23.6% Fibonacci line as shown on the bottom chart.  That would be tantamount to 8% down from the original recent high. 

We will soon see if the Bulls have lost the stomach to fight any longer and that lethargy will set in to the point of saying “Let’s get this correction over and done with and have a thorough clean out when we can then start a new bull rally once again.” 

One last glimmer of hope for the Bulls is the statistical fact that in the four-year Presidential Cycle Folklore over the past 60 years we have had 3 Bear Market Lows that occurred in Year 1, 10 in Year 2, 1 in Year 3 and NONE in Year 4!  I repeat NONE in Year 4.  That is a record waiting to be broken.  Let’s hope it is not this time in the coming year.  Best Regards, Ian.


Will Helicopter Ben make this Stock Market Soar Tomorrow?

Monday, December 10th, 2007

soaring

A strong supporter and concerned customer wrote “I missed Ian’s blog this weekend.  Hope he’s busy or traveling, rather than sick.”  Sunni 

Hi Sunni:  Thanks for the concern and I am glad you may be having withdrawal symptoms…I am just taking a little R&R: 

  1. The Carpel Tunnel said lay off a bit, and chastising me for doing too much typing 
  2. The Newsletter is due this weekend and I have to save some goodies for that 
  3. The Game Plan is intact and all is well so far:     
  • Despite volume concerns which are natural…skittish waiting for tomorrow, holiday season, etc.,      
  • 4-dma up through the 9, 17, 200 and 50-dma in that order spells strong move in ten days     
  • 110 points in 10 days is over a 7% recovery for the S&P 500     
  • The Index has poked its head above the 405-Freeway downtrend-line, above the 50-dma and has achieved a 61.8% retracement on the Fibonacci levels…All tough resistance, so things are looking up. 

Never Count your Chickens before Helicopter Ben makes his decision tomorrow…then with luck, fly high. Hopefully you have been making good money these past ten days as I have…but as you have said in the past you have to keep one foot near the exit signs.  On a personal note, my Nephew is visiting from England and I hope you folks will understand if I lie low for a few days. Best Regards, Ian.

Santa’s Gift from the White House

Thursday, December 6th, 2007

white house

We have had a few visits from Helicopter Ben to save the day in November, and now we have Santa Claus bringing the Bulls a gift on Mortgage Loans from the White House in December.  President Bush outlined a plan to help struggling homeowners avoid losing their properties, including a five year freeze on low and introductory mortgage loans.  Treasury Secretary Paulson said the effort isn’t a “silver bullet”, for the housing crisis but should provide some relief. 

The upshot of all of that is with a proper follow through day yesterday on the Stock market Indexes, we had another rip roaring session today to send the Indexes back up into respectable territories from their recent lows.  Since my last blog on Sunday where I laid out the Game Plan for the recovery from a Base Low in three steps using the 405-Freeway as the lynchpin to success, we trotted down calmly for two days at the start of the week to pause to refresh and yesterday and today have been blockbuster moves in the Stock Market.

freeway 

That was my early Christmas Present to all of you last weekend, and here we are like magic sitting right at the 405-Freeway on all three Major Market Indexes (between friends).  I show the previous move on the S&P 500 so that you can see there can possibly be a slight hesitation similar to the yellow dotted oval last time, before the Indexes can push their way through that overhead supply depicted by the line I show; especially since there have been two powerful moves these last two days.  It goes without saying that the bear’s scenario is “Don’t count your chickens before they hatch” and “There is many a slip twixt cup and lip!”  So let’s review the bidding: 

  1. It all hinges on two important pieces of news starting tomorrow with the Jobs Report and on Dec 11th when the FOMC Meeting delivers their much awaited decision on lowering Fed Funds Rates once again.  Whether it is 25 or 50 basis points or none at all remains to be seen. 
  2. Bad news on either or both of these two items can get the bears dancing and prancing once again, but good news of course will provide the booster rocket to propel the market for a decent Santa Claus Rally.   

In the meantime, the work that my friends have done suggests with a big winky-winky that stocks with ERG 270 is where the action is since the market started its correction on Nov 1, and I will show you that in the Newsletter next week.  When the market is jittery always go for those with the strongest credentials in ERG for the smoothest rides.  For sure you need Stocks with EPS Rank >90 and Rel Str >90 and preferably Group Ranks greater than 70 if not higher.  Some Wolf Packs such as the Transportation – Shipping are a trifle tired, and others trying bottom fishing for the umpteenth time with the Home Builders are still trying to find a bottom.  The Chemicals – Specialty are white hot, the Energy Alternatives run hot and cold and it is good to see that after a shaky week or so in the Technology Stocks they seem to be rebounding nicely with the likes of GOOG, AAPL, GRMN as well as fresher ones such as VIP, SIGM, PTT are worth a look based on their strong Fundamental credentials 

With regard to the Rebound, we can see that there has been substantial repair in the market Indexes this past week as we are essentially only 4 to 5% from the Oct/Nov highs. Notice that these stakes in the ground remain the same, and all one has to do is move up and down the scale as the case may be based on the Markets action.  Doing it this way gets your stomach in sync with the Fear and Greed Syndrome and which side of the market you should be on. 

  targets 

Net-net, Stakes in the Ground, Frequent Measurements, Base Low, 405-Freeway are all part and parcel of guiding you to victory in mastering the Stock Market during corrections.  Best regards, Ian 

$64 Question – Glass Half Full or Half Empty?

Saturday, December 1st, 2007

It goes without saying that the question on everyone’s mind this weekend is what the “Cartoon Says”!  It happens to be very correct right now as the Bulls and Bears are not quite at the 50% retracement level, the 50-yard marker.  Beggars can’t be choosers, but the Bulls will certainly take their position this weekend compared to last weekend when they were on the ropes.

$64 Question

corral

John Murphy has written an excellent piece of what to look for in the Markets and I am sure one can Google it and find the article which seems to be floating around the bulletin boards the last day.  Anyway, a strong supporter Rick wrote and asked if I would take a look at some of his points and maybe throw my two cents in the ring this weekend…which I will attempt.  One concern that John Murphy has expressed is the 13-ema coming down through the 34-ema, and I decided I would show you a chart with my normal moving averages not to confuse you, but to show the point where the 13-ema crosses the 34-ema. It is the dotted circle with the black arrow showing the crossover point.  Note how similar this is to the 9-dma crossing the 17-dma…the pink line down through the green line.  

As you will recall from our past work we always want the faster moving average crossovers to be driving up through each other but most importantly we need to see the 50-dma flat or pointing slightly up when this occurs.  As we can see from the chart, the 4-dma and 9-dma have both turned up but the 17-dma is still pointing down and none of them are anywhere near to breaking UP through the 50-dma which is flat.  Those of you who are tempted by all the “fru-frau’ around you of our friendly Financial Newspaper making the unusual call which flummoxed their readers that we had a follow through day as the signal to jump in with both feet got taught a lesson; especially if you fell for the trap that was set on the Nasdaq and the NDX in particular first thing on Friday Morning. They telegraphed the move which had the market makers dancing an Irish Jig, especially as my good friend Mike Scott reminds me that one of the things that bother him is “our friendly newspaper using moving indexes. That is indexes that change weekly or more often to determine a rally start. 85-85 and Top 100 are both like that and constantly change.” 

Another point that John Murphy makes is that the S&P 500 needs to clear the 100-dma line which means it must get above 1492.  As you can see from the chart below that would mean it must get above the blue line…the 50-yard marker.  I would much prefer to see this Index above the 50-dma and sitting at the 61.8% retracement level to feel comfortable as the 50-dma is still pointing down.  If you look one stage back when we were all biting our finger nails after the August 16th bottom, note how the Index had to grind its way back and forth before it could get itself above the 50-dma.  Don’t be surprised if the S&P 500 Index retests the 1440 level, especially as it has not got above the 200-dma as yet.  Although the four day bounce has been impressive, it takes a lot more oomph to drive through all the overhead supply. The second important point I have taught you is that the Index must drive above the “405 – Freeway”, which is shown on the chart, i.e. the downtrend line from the highs.  At this stage it is a long way to Tipperary!  I might remind you that this is all basic HGS 201!   Go back to the basics and pull out that PDF and digest the slides around the Base Low and what the steps in the process are for it to clear the Overhead Supply.  Alternatively, for those who are new readers, browse back through some of the previous blogs to find similar discussions of what to expect for steps to recovery. 500

So let’s review the bidding: 

  1. The Market Makers gapped all major market Indexes up first thing on Friday morning and the likes of the Nasdaq and NDX didn’t see that level again all day and finished with red candles.  Most of the Gorilla favorites such as GOOG, AAPL, RIMM, BIDU, etc all got hit for the rest of the day to finish down…a sign that buying these beasts on dips has worn a trifle thin now and is left to the day traders to play with in their sandbox.  Fortunately, my friend Mike Orlyk thought better of it and stayed out after reading my blog on Thursday night.  Those of you who want more assurance before you venture in, do yourself a favor and go back one paragraph and read it over and over again for knowing when it is safer to start to engage in the euphoria.  The Early Bird catches the worm but watch out for the Hawk above.  Sure there are all sorts of opportunities, but fit the stage the market is at to YOUR STOMACH and not someone else’s.  Right now this is a Day-Trader’s market, period.
  2. As it turns out most of the movers were in the bottom-fishing category of the Home Builders and Financials, and for good reason due to the news on an anticipated rate cut, but more importantly a deal that is being worked out supposedly with the government to keep the Adjustable Rate Mortgages from being adjusted up.  This helped the Constr-Resid/Cml, Finance Mortgage Svc, Banking Regional etc.  I know most of you watch my associate, partner and good friend Ron Brown’s free weekend movie but if you don’t you can get a good feel for all of this far better than I can do justice to it in this blog.  Try this url to enjoy 20 minutes of fun and pulse of the market:  http://www.highgrowthstock.com/WeeklyReports/.  It takes you to the “Available Market Reports” and you can then download the Dec1, 2007 movie.
  3. Understand that much damage has been done and we need to be more patient regarding the recovery compared to the previous phase that led to the August 16th bottom.  Just look at the chart above and you will see there is a lot more overhead supply to overcome this time and the mood now is more of selling into the rallies rather than starting a fresh full bloodied rally. Fortunately with each passing day we bridge closer and closer to the FOMC meeting on Dec 11th.  Since all the signals reassure the market that Helicopter Ben stands ready and able to cut a further 50 basis points, we may eke out a Santa Claus Rally of some sorts, but that is all wishful thinking right now especially as that is the predominant talk around the office cooler by everyone who don’t know a Cup and Handle from a High Tight Flag.
  4. I am grateful to my good friend Mike Scott who provided me data to show how the underlying internals of the market have faired through this correction.  All internals on the market obviously show we are badly oversold so it was not surprising that we should expect a decent bounce play given the latest fresh news.  Understand that:
  • The % of stocks above the 200-dma is a paltry 35% having risen from a low of 27%
  • The % of A+B accumulation to the total is 33.5% having risen from 23.9%.  It should normally be at well over 50%.  Those with “A” accumulation is a meager 5%.
  • The % of “E” stocks is at 13.3% having dropped from a very negative 22%.  Most rallies start from such oversold level    
  • Mike also provided me with the information on the McClellan Oscillator and Summation Index and it is encouraging to see that both have turned up with the former now into positive territory.  However as you can see by the empty circles we need to see the Mc. Osc stay up above the zero line and the Summation Index rise rapidly with large separation of postings to get above the zero line for a bull rally to continue.  It is currently deep in negative territory.  He goes on to remind me that the FOMC being caught between a rock and a hard place leaves them with three choices “stagflation, inflation, recession…what a choice.”

              sum

On re-reading what I have written, I can’t help but feel that I am giving a gloomy picture, but I would rather layout reality than a lot of fluff of how good it is going to be.  The market will do what it wants to do and nobody can tell you with any certainty that they are Soothsayers.  After all, we started from a worse low and more panic on August 16th so we have to keep these things in perspective.  The bottom line of my message is that there may be a short term rally in the making, but the longer term is far less re-assuring.  My thanks to many of you for chirping up with helpful suggestions and information.  Many hands make light work.  It’s always “Your Call”.  Best regards, Ian.

Copyright © 2007-2010 Ian Woodward
Disclaimer: Commentaries on this Blog are not to be construed as recommendations to buy or sell the market and/or specific securites. The consumer of the information is responsible for their own investment decisions.