Ian Woodward's Investing Blog

Archive for the ‘Market Analysis’ Category

Don’t Count your Chickens before they Hatch

Monday, October 22nd, 2007

Chickens

We had a decent snapback today after the downdraft of over 100 points on the Dow at the start, so the first round goes to the bulls after Friday’s big drop.  But don’t count your chickens before they hatch.  We have achieved the first leg which was a positive day on the next day after a big correction, but we still have to achieve the market being up by the end of the week.   

At any rate, it is encouraging that for starters the Market preferred Scenario #2 of the two I gave you yesterday and that suggests we are still intact for this being similar to 2000 rather than 2001 and are still possibly searching for a higher top.  More importantly, we need a bridge to the FOMC meeting on October 31st. and we got a shot in the arm after the market closed with the stellar EPS Report from AAPL.  In addition, as you would expect, the Gorilla Index confirmed the direction was up and three of the key horsemen of GOOG, AAPL, RIMM and GRMN were positive with RIMM being the only one down.  Watch those four is the clue. 

Here is the updated picture for the 2000 scenario compared to 2007, with one “Question Mark” replaced with a positive number “0.33%” for today, and one question mark for the end of the week.  We badly need a positive week and AAPL may have given us hope. Best regards, Ian. 

 spreadsheet    �

Frying Pan into the Fire or another See-Saw Event?

Sunday, October 21st, 2007

frying pan

Late Breaking News! There will be a New Release of the HGSI Software this evening at around 6.00pm Pacific Time and George Roberts will be sending out a notice to that effect.  He says “Keep in mind that anyone running Vista will get an error message from our installer when they do the download instructing them to go to the website and do a manual download.  We have Vista improvements in this release but the first time out I have no choice for existing Vista users.  There will be plenty of warnings about this.”  Please read the instructions carefully.

So let’s come down to earth as to what are the two items front and center in the tug-of-war between the Bulls and the Bears.  The two most important items on the platter are the EPS Reports and the FOMC Meeting to come on October 31.  The former has been mixed with the Caterpillar Report throwing a pall on the market as of Friday, despite the upbeat reports from GOOG, YHOO, AAPL etc.  As Art Cashin put it, we might be importing inflation with the two edged sword of a low and still decreasing dollar value while the Multinational Companies benefits of seeing their overseas profits go straight to their bottom line.  However, it doesn’t seem to have done much for Caterpillar.    It seems the potential impact of EPS reports to come is blunted now and the key event is on Halloween with the FOMC meeting.  Whether the Market Bulls can stave off another drop before then remains to be seen but that seems to be the only hope. Let’s review the Fear and Hope items: The Fear factors outweigh the Hope items at this stage of events: 

  1. The Financial Loans woes haven’t gone away and not likely to anytime soon
  2. The dollar continues to slip with concerns of a “run” on the weak dollar
  3. The Price of Oil continues to climb to that imaginary goal of $100
  4. The Beige Book Report showed that the US Economy has slowed
  5. Housing continued to take its toll and is expected to remain subdued
  6. The Hang Seng market continues to rock and roll into bubble territory
  7. The internals of “A” accumulation stocks is less than Distribution “E” stocks
  8. Taking that point further, there has been a dramatic drop in the leaders, i.e., “A+B accumulation stocks in the past week or so
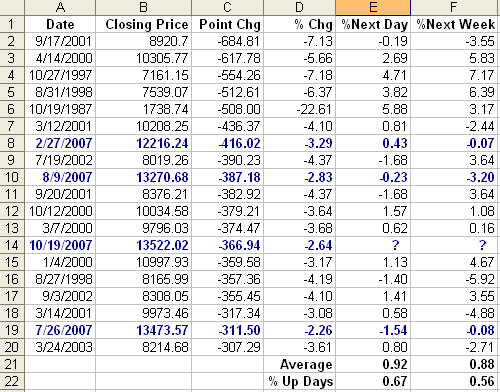
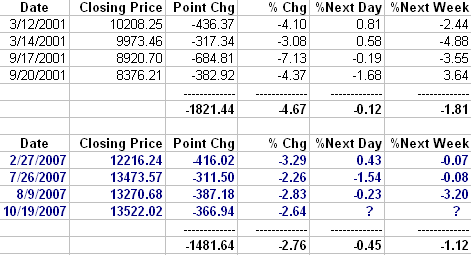
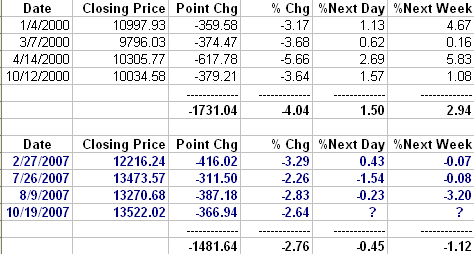
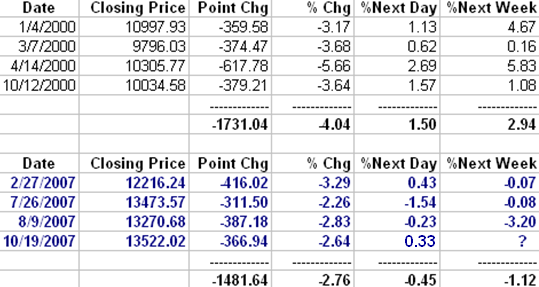
  9. For the Folklore types, years ending in “7” have been disastrous for the month of October in 110 years.  Only one of the 11 instances going back to 1897 was positive for the DOW. The average return has been -8.5%.
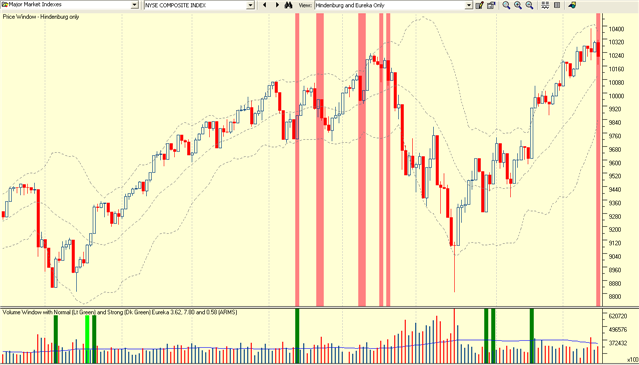
  10.  For those watching the RSI on the NYSE, any reading below 40 spells more trouble to the downside.  It is currently at 44 so any down day will kill it.  Since the NDX (Nasdaq 100) is the strongest Index, watch the Gorilla Index.
  11. One month and one day after the Fed cut the Fed Funds and Discount Rate by 50 bps, both the S&P 500 and the Dow are now below the levels they were trading at prior to the Fed’s September announcement, but the Nasdaq and NDX are still above.  The S&P 500 and DOW have both “broken” their 50-dma. We have a split market based on the above.  Technology leads.
  12. …and the litany of woes go on

The Case for the Bulls is primarily one of hope: 

  1. There is a 70% chance the Fed will be forced to reduce rates again on Oct 31
  2. We have just had a decent correction and the new rally is only 8 weeks old
  3. That correction has wiped away the folklore cloud of no 10% correction in over four years for the S&P 500. 
  4. We have had an explosive rally wiping out all the losses of the correction
  5. We had a false breakout but this dip is small in the long term perspective
  6. The S&P 500 P-E is still at very reasonable levels of around 18
  7. 4th Qtr earnings are expected to be strong, therefore justifying a higher S&P Price with most Forecasters indicating it to reach 1600 by year end
  8. If we get past Halloween and the FOMC has a treat for us instead of a trick, the Santa Claus rally will take us into new highs and any major correction will have to wait until early January

All of that is nice to know, but the proof of the pudding will be in the eating on Monday…then your stomach and your Portfolio will tell you what to do.  So let’s look at the steps in the process between now and then: 

  1. Tonight before trotting off to bed look at the “World Markets”.  Their reaction to the US markets will be very apparent and you will know whether we are in for another stormy day.
  2. First thing when the market opens, the likelihood is it will open down since all Market Indexes finished at or near their lows.
  3. If your Portfolio is blood red, you may be tempted to lighten up early.
  4. My suggestion before you do so is to see how the Gorilla Index is behaving
  5. If they are giving up the ghost, the party is over for now. If not we have a chance of a bounce day.  I didn’t say bounce play, I said bounce day.

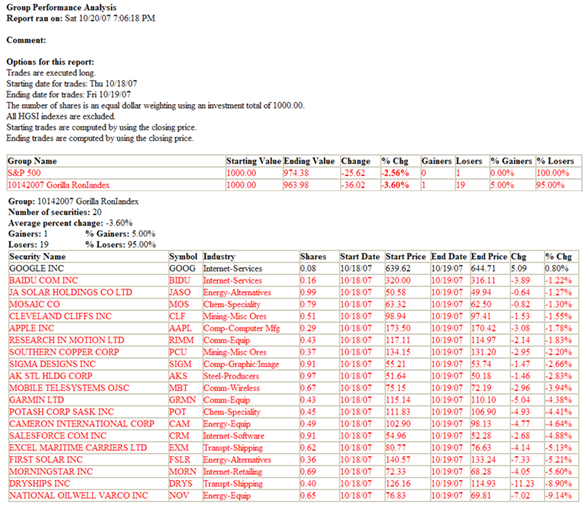
Here is the Gorilla RonIandex performance on Friday, with the Index losing 1% more than the S&P 500.  It was ugly with only GOOG up, and even it was down for the day as it gapped up at the open and those that chased it lost money.  It may be your lifeline on what to do regarding your own portfolio on Monday.  If it is either lower than the S&P 500 or down again by 3% on Monday, it is most likely that we will finish down, and that we are headed for another big correction. It is unlikely the FOMC will act before October 31st, so only a really oversold bounce play may be the only thing that will hold it together until then.  I repeat, don’t guess what you think the market will do, let it tell you what to do, but you must be nimble and that is the only trump card you have, but play it correctly both ways.

Gorilla Index 

As I go to press, I am reminded by my good friend Manu that the action is still in the Chinese stocks, but it seems that my blog on the Chinese Dragon didn’t get much of a peep out of you folks, so you missed a winky winky.  I don’t blame you as it is a two edged sword.  However, you play at your own peril; it’s always “Your Call”.   Good Luck and Best Regards, Ian.

History Begs the Question – More to the Top or already in a Correction?

Saturday, October 20th, 2007

Is this a Top similar to 1999/2000 or are we already in a major correction ala 2001? 

There can be no question that essentially all the Market Indexes have ugly chart patterns as a result of Friday’s major drop, with many suffering Big and Little Kahunas (a one day drop in Bollinger Bands %B of -0.40 or -0.24, respectively). To put things in perspective, we should look at two factors, one related to past results on such big dip occasions in the DOW the following day and week, and the other as to how the Gorilla leaders faired.  Let me quickly remind you that we have this year already had bigger dips twice on 2/27/2007 and 8/9/2007 of 416 and 387 points, respectively, and one on 7/26/2007 of 312 points.  So we have certainly had a Yo-Yo market to contend with, and we are getting used to it, so it should come as no surprise.  That doesn’t mean we should be complacent.  Percentage wise the 367 point drop on Friday was the 2nd lowest with -2.64% and 7/26 being the lowest at -2.26% in recent history:

Dow Jones

We can see there have been 19 recent occasions that the market has dropped over 300 points in a day.  The question is what do we expect on Monday and for next weekend?  It’s not a big sample, but there are two chances in three it will be up on Monday, and nearly a 60:40 chance by the end of the week.  If we re-arrange the table to compare the big dips that occurred between 2000, 2001 and now, nobody knows for sure but we get a few hints of what might happen. If we first look at the comparison between 2001 and now, we must recognize that we were already well into a Bear Market, and were still struggling to recover: 

  1. It is interesting that in 2001 we had two similar sets of action on 3/12 – 3/14 and 9/17 – 9/20, dates that were very close to each other in the same week.
  2. The following day is usually less of a dip or even a small rise.
  3. But then the floodgates open and by the end of the week there can be a complete capitulation and rollover followed by a steep rally the week after (not shown). 
  4. Realize we were already well into a Bear Market in 2001 and struggling to recover, whereas we are currently attempting to stave off a major correction after five years.

2001


Now let’s look at the comparison between 2000 and 2007, which is more in keeping with where we stand in the cycle of events relative to this long rally showing similar signs of topping as it did back in early and late 2000:

2000


  1. Note the similarity to now in that the occurrences in terms of dates are spread out over the year. 
  2. Realize that we are at the top right now and essentially on what is a false breakout on all major Market Indexes having just had an intermediate correction on the Nasdaq back in July and August.  The Bulls are still in control, but showing major signs of fear based on all we have been through the past twelve weeks, and the long black candle recorded yesterday.
  3. Using this comparison suggests a snapback on Monday and by next weekend. 

Only time will tell.  Those that hope and are either not close to the market or long term buy and hold types will say this was a pimple in the long term perspective and the market will come back and ride it through.  Those that fear know that we had a major shot across the bow fortunately with warning from the Hindenburg and we should take protective action if we have not already done so with the debacle of 2000 to 2002 still fresh in their minds. 

It is amazing what one can do with numbers to prove any point we wish…which is not the thrust of this note.  Rather, I like to use past history as to what the alternative scenarios may be and then have the market tell us which track it is on.  In my next note I will give you items to look for and how the Gorillas fared on Friday.

Best Regards, Ian.


Hindenburg Omen Signals Gave Early Warning of Impending Correction

Saturday, October 20th, 2007

DOW Tumbles

The Hindenburg Omen gave us early warning and signaled three times this past week before the market tumbled.  Chalk one up to the HGSI Software! The Dow Jones, the main US share index, saw shares plummet more than 366 points on Friday, October 19th, amid concerns over the state of the US economy. The technology-laden Nasdaq fell 74.15 points or 2.65% to 2,725.16, while the broad-market Standard & Poor’s 500 index declined 39.45 points 2.56% to 1,500.63.  Of course, the media repeatedly reminded us that this was the 20th. Anniversary of the 1987 crash and of course such fear-mongering feeds on itself and supposedly is newsworthy!

The benchmark index of blue-chip stocks shed 366.94 points or 2.64% at 13,522.02 by Friday’s close of trade. The slump followed a warning by Caterpillar that the housing slowdown would harm the wider economy and cut its profit forecast.  It saw its shares down 5.3% to $73.57, and predicted weakness ahead after its earnings results, which missed forecasts.   

Although the name “Hindenburg Omen” conjures up images of gloom and doom, we must understand that need not necessarily be the case.  I prefer to look at it as a sign that the market is topping or has topped and we are due for some form of correction. Consider the following: 

“The probability of an S&P 500 move greater than 5% to the downside after a confirmed Hindenburg Omen within the next 41 days after its occurrence is 77%, the probability of a panic sellout is 41% and the probability of a real big stock market crash is 25%.The occurrence of a confirmed Hindenburg Omen does not necessarily mean that the stock market will go down. On the other hand there has never been a significant stock market decline in history that was not preceded by a confirmed Hindenburg Omen.”  

Be that as it may, the question is how severe was the damage and where do we go from here.  I strongly advise you to watch my associate, Ron Brown’s weekly free movie which you will find on this same highgrowthstock.com website. He shows the extent of the damage that has occurred and gives far better perspective than I can relate to the Internals of the Market. In my next blog before the weekend is finished I will relate this year’s action to past history in 2000 and 2001 and I will then wind up with a third blog of what do we do about it and what to look for. Stay tuned.

Best regards, Ian. 

The Hindenburg Omen Triggered Tonight

Monday, October 15th, 2007

 Hindy Photo

 I have Late Breaking News tonight…The Hindenburg Omen triggered today.  Those of you who are new to this signal should read an earlier Blog of mine written on September 30th, 2007, describing its potency.  So to be fore-warned is to be fore-armed.  Please understand that a SINGLE signal does not constitute gloom and doom to come; there must be a minimum of two and preferably more before one should take full heed.  In other words, this is a YELLOW Alert and not a Red Alert.  We need to watch carefully from here but there are a few observations we can make:

  1. We have risen sharply on all Indexes in the last eight weeks with many Indexes into new highs.
  2. We had our first shot across the bow when they knee jerked the Market with the BIDU downgrade last Thursday.
  3. The Market had another sell off today based on the Citigroup EPS Report, and although this was expected to be disappointing, they took the market down anyway.
  4. Since the McClellan Oscillator was positive up to now, this was the perfect set up to trigger the Hindenburg Omen as it turned negative today…being one of the required conditions that rarely occur in concert with the other requirements.

Hindenburg Chart

The Hindenburg worked true to form as shown by the chart predicting a correction accurately. Since this is new to us all during this 2007 period, this signal today may be a one day wonder in which case it will be shrugged off as a spurious signal.  We must wait to see if we get another one shortly and what further factors come into play in the future.  In addition, although the Gorilla RonIandex we gave you in today’s Newsletter was negative today relative to the S&P 500, it is far too early to declare that we have anything but a one day knee jerk.  Please read the points I made in the Newsletter on the Calendar of Events leading up to the FOMC meeting on October 31st.  Two key earnings reports are due from GOOG on October 18 and AAPL on Oct. 22.  How the market reacts then will be a serious clue of what might be in store for the future.  So I am not for one minute suggesting anything but caution at this stage.   

The bottom line is that this is a Heads-Up Message.  Best Regards, Ian.

Copyright © 2007-2010 Ian Woodward
Disclaimer: Commentaries on this Blog are not to be construed as recommendations to buy or sell the market and/or specific securites. The consumer of the information is responsible for their own investment decisions.