Archive for the ‘Market Analysis’ Category
Up, Up and Away in My Beautiful Balloon
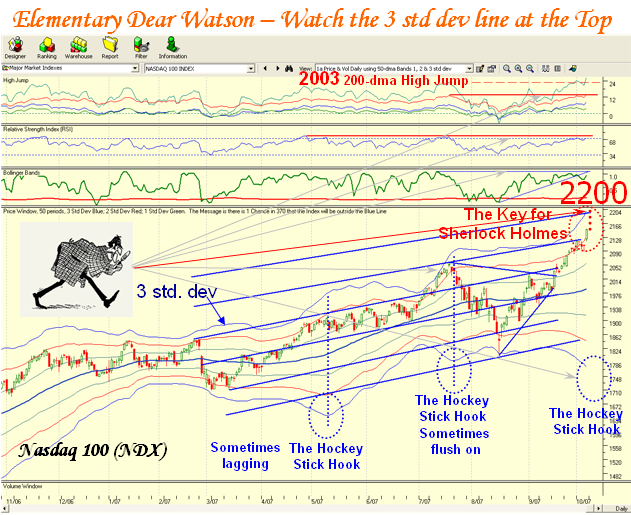
Monday, October 1st, 2007You may have noticed that apart from last night’s late breaking news about the Hindenburg as a top notch Indicator for Market Tops, it was not intended to dampen my enthusiasm of the previous couple of captions. They were up beat with “My Blue Heaven – Market’s Up, Surf’s Up and “I’m Sitting on Top of the World…Just Rolling Along”. The gloom and doom of six weeks ago is currently behind us and although I warned that we should not count our chickens before they are hatched, we have now hit a new market high on the Dow, the Nasdaq, and the Nasdaq 100, with the S&P 500, S&P 100 and NYSE all close to their old highs of just three months ago. So enjoy the ride up that the Fed has garnered for us having plucked us out of the jaws of the abyss!
Today’s gift seems to have come in part from what Bob Pisani of CNBC calls “Perverse Logic” in that the major announcements of the bad news by both Citigroup and UBS in taking heavy hits in ANTICIPATION of further Loan losses; the bulls turned this bad news around to in fact spin it that the worst is behind us and now we can look ahead. We have only to look at the bottom fishing in the Home Builders today to see that the exuberance is there to yet once again find a bottom on this sector of the market…along with the strong movement in the beaten down financial stocks.
Couple all of that with this being the 1st day of the 4th qtr when stocks are usually up, that insider selling is down and insider buying is up, that Company buy backs are up, and that there are fewer IPO’s to compete with the current shares outstanding all suggests longer legs to this current bull rally. It goes without saying that Short Covering is still prevalent and short-term traders are now reversing their positions over the near term. Also, one can’t help see that as we head for bed at night and look at “World Markets” the global stocks and markets are showing substantial gains.
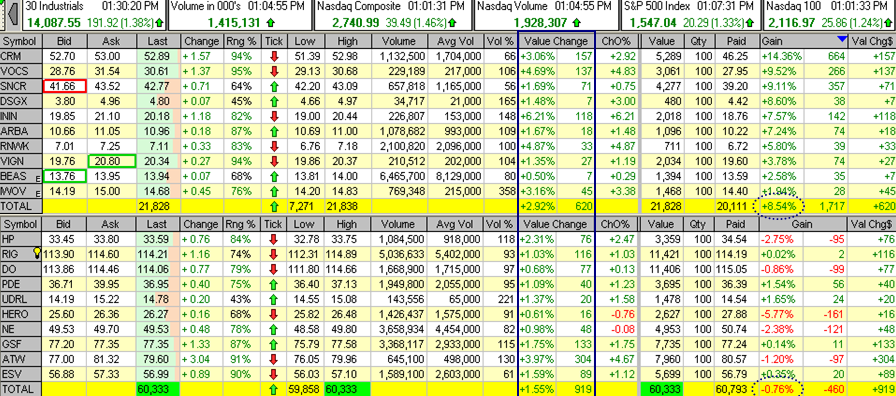
If we bring things down to our little world, we note that stock leaders with RS >95 and strong ERG is where the action is at, coupled with Technology stocks particularly related to the Internet Software and Telecommunications. Transport-Shipping, Chemicals Specialty are still providing stellar gains. The Chemicals Specialty Wolf Pack I gave you five weeks ago on August 26th, 2007 is now up 25%. The Internet Software group of ten stocks I suggested just a week ago is up 8.54% as shown below, and in the interest of full disclosure, the Energy Drilling group pulled back last week, but showed signs of life today with all ten stocks up but the group is down 0.76% for the week. Keep an eye on this group as I warned you that Wolf Packs don’t necessarily all fire straight out of the chute. Below I show the results of the two groups, with Internet Software on top above Energy Drilling. Naturally every stock in the two groups was green today:
It is only natural that at this stage of events where we have had a powerful drive back from the Base Low and are now above or nearly at new highs in the Market Indexes, that the Technical Analysis aspects come into play, but I believe that we still have a chance to test the recent highs on the High Jumps for all the Major Indexes. I said that I felt we were on the second leg of a high tight flag and today has shown that in spades. Naturally, October also looms in our minds as one of the worst months for gains so we need to be cautious and not sit with irrational exuberance.
Best Regards, Ian
The Latest Feature of HGSI…The Hindenburg Omen Indicator
Sunday, September 30th, 2007A technical indicator named after the famous crash of the German airship of the late 1930s. The Hindenburg omen was developed to predict the potential for a financial market correction. It is created by monitoring the number of securities that form new 52-week highs relative to the number of securities that form new 52-week lows – the number of securities must be abnormally large. This criteria is deemed to be met when both numbers are greater than 2.2% of the total number of issues that trade on the NYSE (for that specific day).
For those who are interested in understanding the development of this Indicator, I suggest you Google using Hindenburg Omen and then select the following article, which is the second one down on the list: “Safe Haven – The Past Performance of the Hindenburg Omen Stock Market Crash Signals 1985 -2005”.
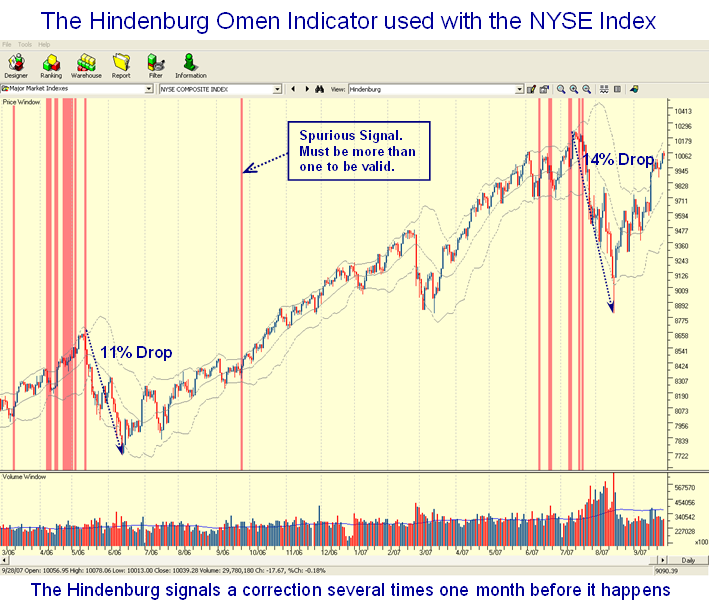
In reading this document, we find that their evaluation of past signals indicate a 77.2% probability that a stock market decline of at least 5% will occur in the S&P 500. There is a 54.5% probability that a sharp decline of greater than 8% will occur as happened in the most recent corrections in 2006 and 2007. There is also a 25% probability of a market crash defined as a >15% correction will occur after we get a confirmed (more than one in a cluster) Hindenburg Omen. As you will see from the Chart View below we have dodged two such bullets in the past year. Since the correction is now over for the recent one in 2007, one would expect there will need to be a similar series of signals before there is a renewed warning that a correction is imminent be it 5%, 15% or something in between. Note that the value of the indicator is that it seems to take at least one month before one gets a sufficient cluster to occur, giving ample warning. HGSI users will also be shown that during this cluster formation in 2006 and 2007, there was a Eureka signal which we know occurs after a long bull rally before a decline occurs. All of this will be discussed in the October 27 to 29 Seminar.
Those who are users of the Monthly Newsletter have known that we were in the process of developing a way to simply depicting the Hindenburg Omen Indicator using the proprietary Visual Filter Back-Test (VFB) feature, and I am happy to say that those attending the October Seminar will be the first to see it included in the Chart Views.
However, I felt all of you would like a sneak preview of this Indicator and demonstrate to you its value in the last two significant corrections in the view below. The HGSI software is the only known software that has this feature included in its bag of tricks and joins the other unique indicators we have developed over the years including Eureka, Kahuna, and Tsunami which I described in one of my earliest notes on this blog. This view demonstrates the value of the HGSI software in depicting the two most recent big corrections as shown in 2006 and recently in 2007.
The bottom line is that when these signals occur in a cluster, it is time to sit up and take notice. That is precisely why we feel this Indicator will be of tremendous value to HGSI Software users. To be fore-warned is to be fore-armed, and HGSI users will be fore-warned from now on.
Best Regards, Ian.
The Bulls Win Round #1 at the OK Corral!
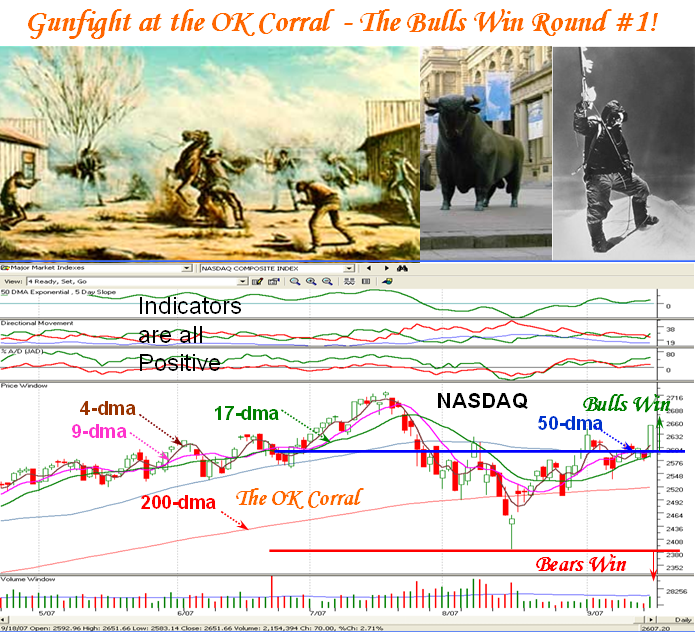
Wednesday, September 19th, 2007I am sure you all recall this Stake in the Ground that I planted in my blog note on August 27th. The first round of the fight at the OK Corral goes to the Bulls. These were the conditions for the Bulls to win, all of which have been met.
The Bulls:
- 4-dma, 9-dma come up through the 17-dma; later 17-dma up through the 50-dma
- A Eureka Signal with a Follow through Day of 35 points up and 2 Billion Shares
- Directional Movement: Di+ above Di-
- The Nasdaq Index gets above the 50-dma at 2572 and then above 2616…the Upper BB
The Requirements for the next round for the Bulls to continue to win are:
-
Drive to the old high at 2725. The Nasdaq is currently at 2666.
-
Stay above the 50-dma on the downside which is at 2590.
After a brief pause to refresh, the Nasdaq must drive above the old high for the new bull run to be fully underway. The Line in the Sand is now at 2590 for Round #2. Best Regards, Ian.
Plop Plop, Fizz Fizz, Oh What a Relief It Is!
Tuesday, September 18th, 2007I had a Wisdom Tooth extracted, so I can tell you this was a double relief when the Fed surprised us all with a bigger cut than most of us expected, including myself as I mentioned in my Newsletter.
It goes without saying that this changes the entire complexion of the fight at the OK Corral as the short term opportunity is decidedly with the Bulls. How long it lasts is another matter, but as one should expect given the immediate reaction today, the pendulum should swing violently to the upside. If you have done your homework it should not be difficult to know where the opportunities are and as my good friend, Maynard Burstein reminds us on the HighGrowthStock.com bulletin board, the best stocks right now are just an arm’s length away…the HGSI StockPicker lists of 10 stocks. Many of them were up over 5% today. Even the Blog Game Plan Index which we have followed for the past six weeks showed all 18 stocks up for a 4% move today.
It is a little early for me to do tonight’s download, but I am sure that we have another Eureka to go with the two previous ones we chalked up a couple of weeks ago, and unlike those which could have been suspect as the volume was low, today has all the right characteristics and is a major follow through day. Please understand that there are times in the market where one can have a skewed price and volume change as we did on the downside on August 16 when there was chaos to get to the exits that day. Likewise, those who were short the market had to cover quickly so it is natural days like today will not necessarily reflect the full mood of the market. So keep this in perspective. Have no doubt about it that the Psychology has turned on a dime…for now.
However, for the short term, I expect one can throw darts and get a decent move in many stocks. There are opportunities that range from rounding up the usual suspects that I have already mentioned where Technology, Telecom, Health Care, Materials and Energy are where the action is, to finding beaten down stocks in beaten down Industry Groups such as the Home Builders and Financial Stocks. A further clue will be how the Brokerage Stocks behave in delivering their earnings reports this week. Lehman Brothers delivered a 7c surprise to day with $1.54, and Morgan Stanley is due to report tomorrow. Lehman indicated they had about a $1 Billion write down if my memory serves me correctly, so there is much to watch this week. My suggestion is that we need stakes in the ground quickly as I have shown you they give you pay dirt at critical junctures:
- I have a list of 19 Home Builders and they delivered 7.78% today based on buying 100 stocks for each company, all green, with Hovanian (HOV) producing a hefty lift of 28.42%. Put together a User Group of these and watch them to see how they perform.
- Do the same for beaten down Brokerage stocks.
What’s the big deal? The best way to understand the underlying pulse of the market is to focus on these since the injection that the Grand Old Duke of York just gave us was to measure Risk Management and decided to do this unusual action (for him) to put life back into the economy.
It goes without saying that it won’t be long before the Inflation Hawks will be out in droves even before the dust settles, and others will be moaning that the dollar has gone to pot, being at the lowest in years for a long time. You can rest assured that if this medicine does not do the trick particularly for easing liquidity and incidentally helping the Housing Industry, watching these two Industry Groups will soon tell you that the medicine is working or is a flash in the pan. Whether this is putting off what many feel is the inevitable of a recession or that they acted before the rot really set in to accomplish a soft landing remains to be seen, but at least they can’t be accused of pussy footing around.
On a personal note, we had the pleasure of Dave Baratto visiting us from Texas for the Saturday Meeting and he went away armed with all sorts of goodies that I will cover at more length at the October 27 to 29 Seminar in just five weeks time. If any of you are in L.A. on the third Saturday of the month you are welcome to join us for an afternoon of FUN.
Understand that I can’t cover the water front in one blog note, but I have given you plenty to chew on. Besides, the pain killer for my tooth is wearing off and yes, I am looking for some sympathy! Best Regards, Ian.
 Ian Woodward's Investing Blog


