Ian Woodward's Investing Blog

Stock Market: Clowns are Back!

December 23rd, 2012

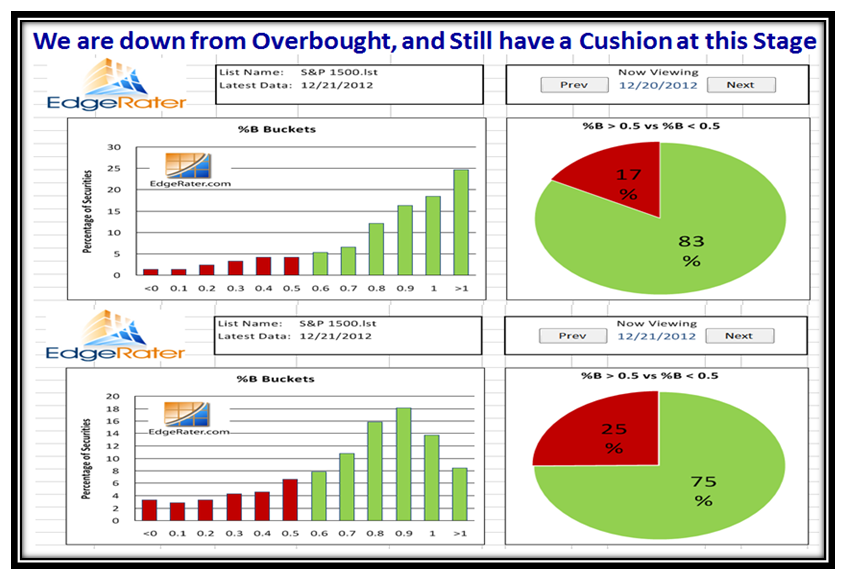
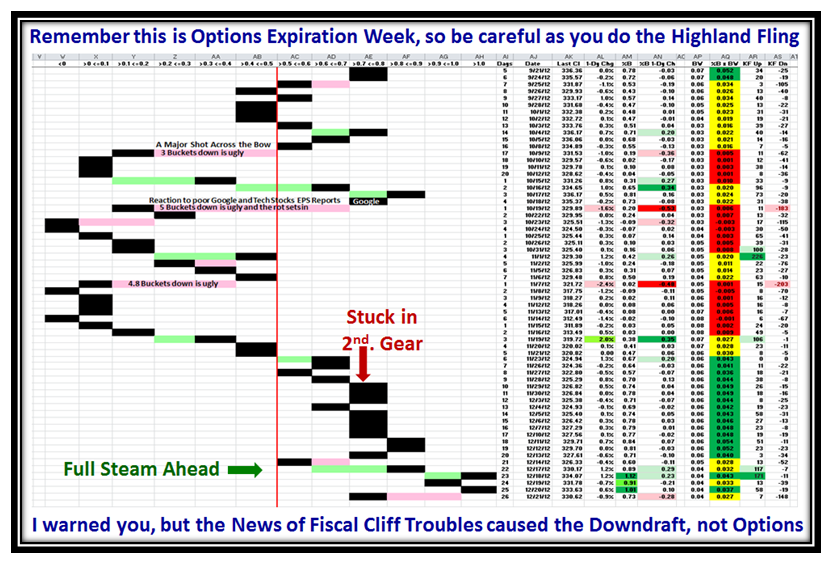
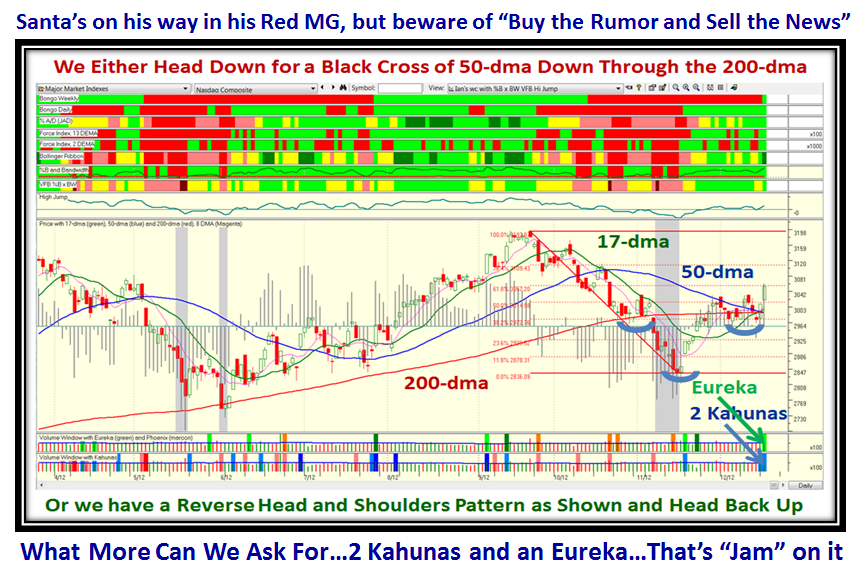
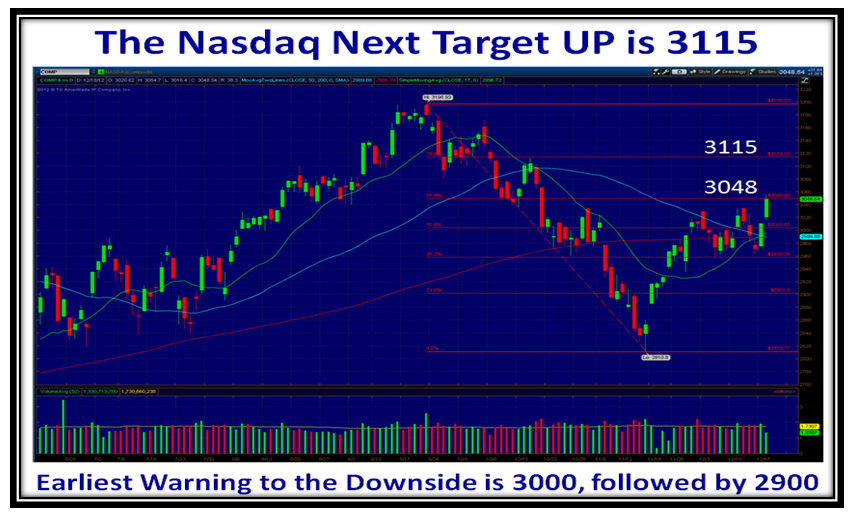
Most people have given up investing until this Fiscal Cliff nonsense is behind us.  The Clowns are Back:

I’ll make this short and sweet:

Friday was a 2+ bucket down day:

Seasons Greetings, thanks for your continued support and all Best Wishes for 2013 from the HGSI Team…George, Matt, Ron and Ian.

Enjoy this wonderful video of the Drifters…just click on the link below;  then, when the video is finished, hit the return arrow at the top of your browser.

http://www.youtube.com/watch?v=ddVZOK_9UUI

Best Wishes to you all,

Ian.


Stock Market: Santa’s Coming to Town

December 18th, 2012

I see my supporters over the years are all waiting for the Santa in his Red Car (Morgan or MG?) picture to appear on the front of the Blog Note.  I can’t disappoint them, but hope the Grinch doesn’t have other ideas to pull us in and then lower the boom!

Who would have thought that two days ago we were looking at yet another correction, and inside two days we have two Kahunas and an Eureka which is the sign that this Market is off to the races feeding on the rumor that the Fiscal Cliff Kerfuffle will be resolved…is this a case of buy the rumor and sell the news when it eventually comes out:

…And here are the High and Low Road Targets…thank heavens we have a cushion once more:

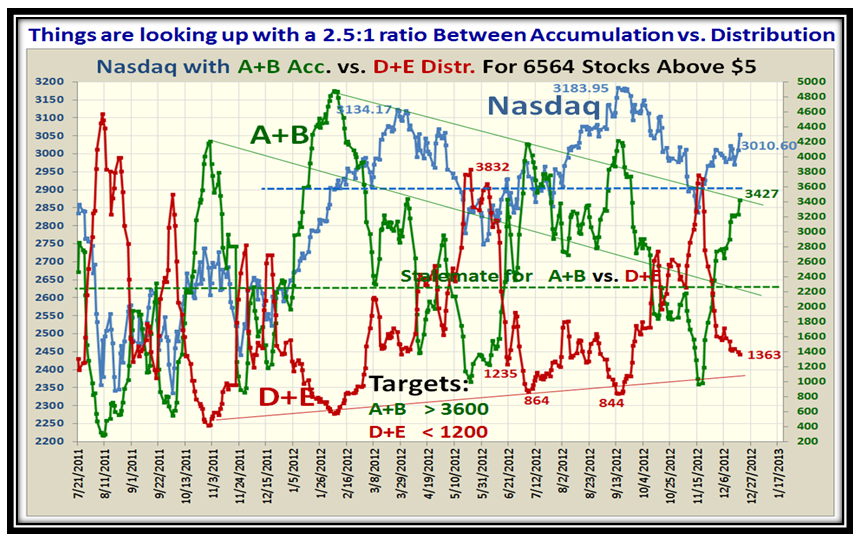
The internals are also looking stronger with a 2.5:1 Ratio between Stocks under Accumulation vs Distribution:

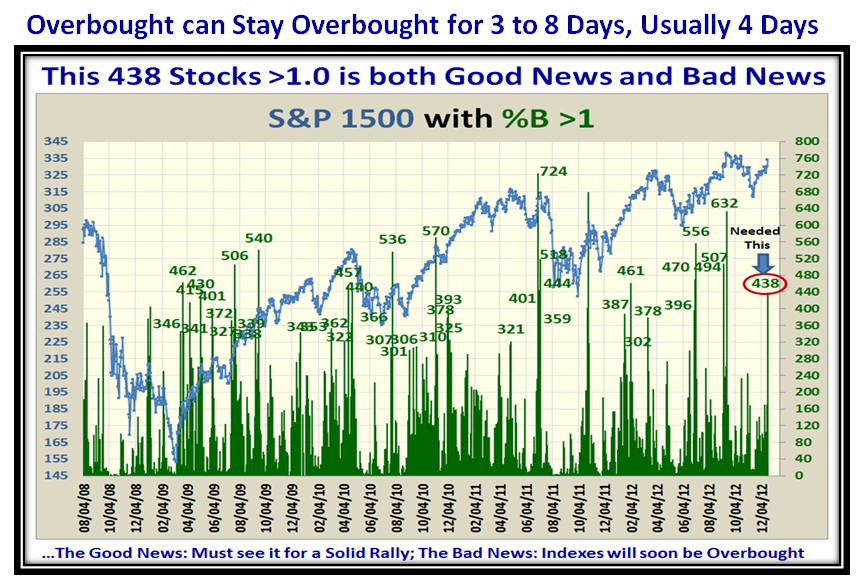
Now here is what we look for when we confirm a strong rally in the making.  We need 400 stocks overbought out of the 1500 for the S&P 1500:

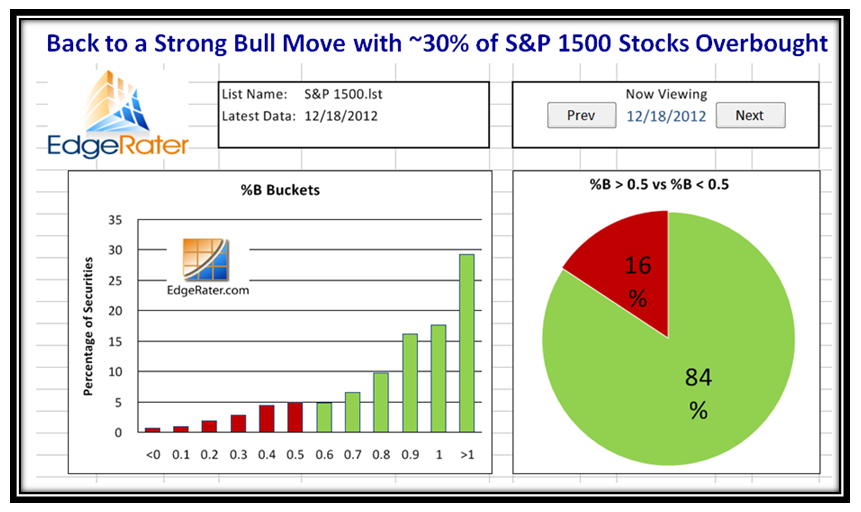
Naturally, Grandma’s Pies also show strength:

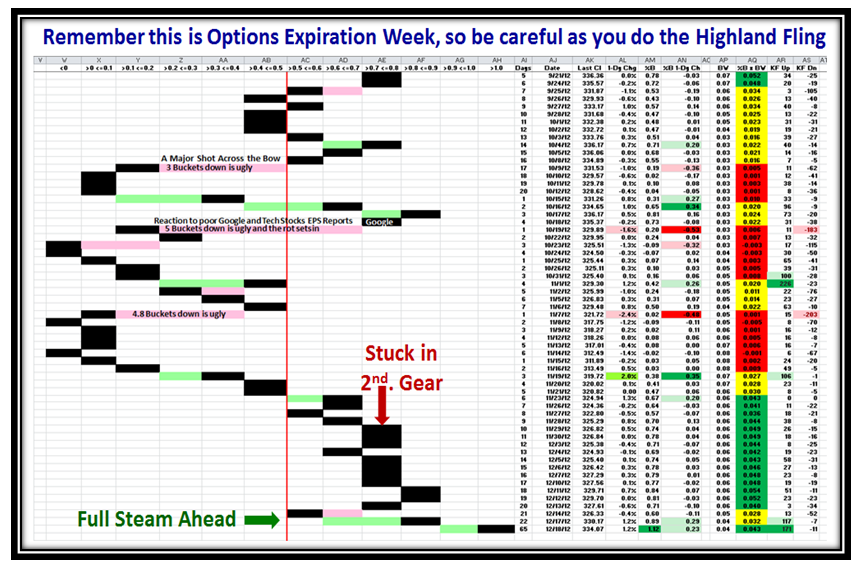
…And, to round out the picture, here is the one we love to see…big move in two days, make no mistake:

Net-Net…Kahunas and Eureka volleyed and thundered, but play with more care this time.

Best Regards,

Ian.

Stock Market: What Goes Around Comes Around!

December 16th, 2012

On this quiet Sunday as we mourn the loss of all those innocent people in Newtown, I turn to happier times when my friends around me over the years have given me a helping hand to help you help yourselves.  My Global Supporters are a trifle starved for new information, and so this Blog Note contains concepts and charts they have probably not seen before, and is my way of thanking my friends for the gems they have given me which include work by McClellan and of course, Bollinger.

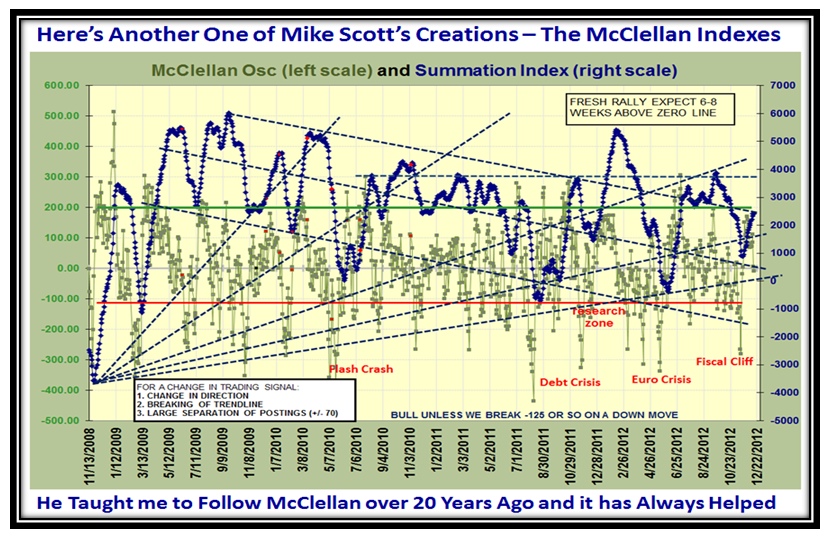
Thank heavens we have come down to the last two weeks before this Fiscal Cliff mumbo jumbo is resolved for better or worse, and so I am reminded of the Days of Wine and Roses and also those of Whining and Sniveling:

So, let me pluck two charts which my good friend Mike Scott (Aloha) conjured up many moons ago, one of which tips our hat to Sherman McClellan and his son:
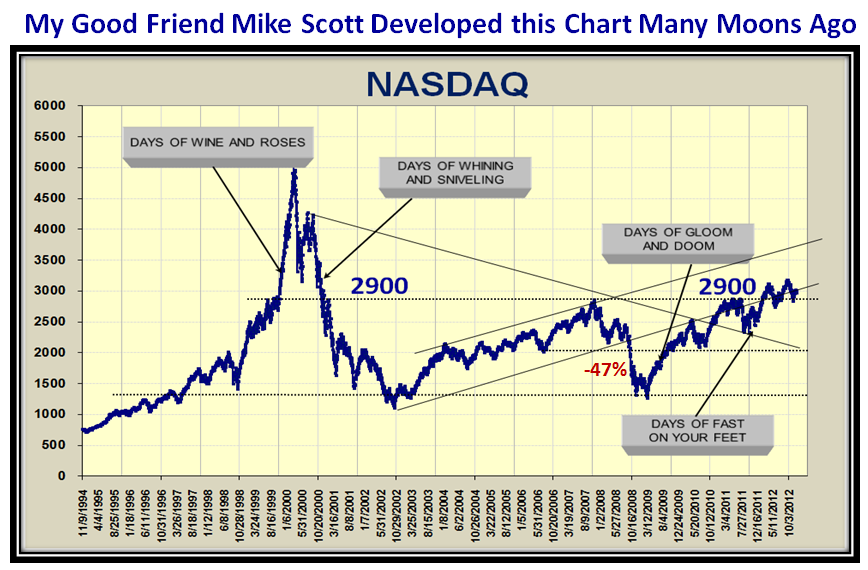
It goes without saying that RIGHT NOW we are Marking Time at the Pivot Point of Bouncing Back or Trotting Down once again as this next chart shows using the NASDAQ Market Index:
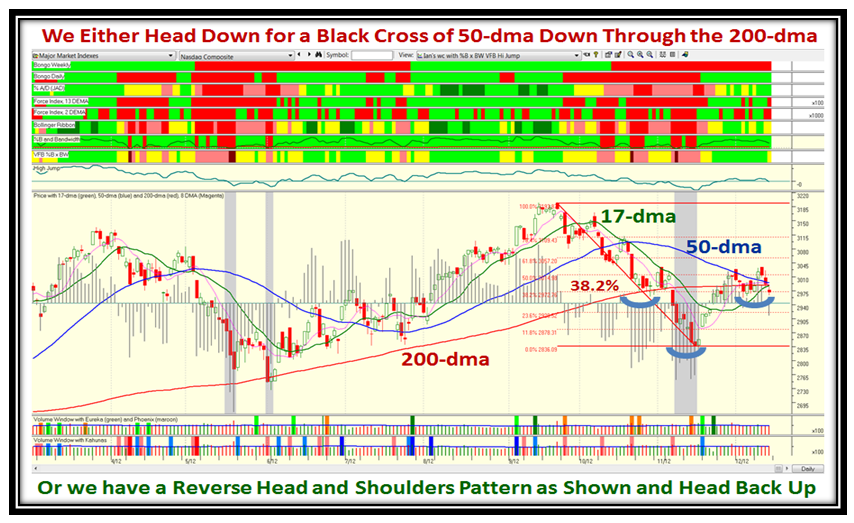
The above chart is dedicated to all the friends I have made who are supporters of the HGSI Team over the past 14 Years and to those who were with me at Telescan for the previous six years…time flies when you are having fun and meeting sincere people who help each other.

…And here is the latest Gem from Dr. Robert Minkowsky who has added icing on the cake of John Bollinger and my work with the two examples I show below for the first time hot off the press.  We are almost into the start of the January Effect when the Small Caps like the S&P 600 and the Russell 2000 (RUT) bloom through the first week in January and so I chose these two examples to showcase his work:
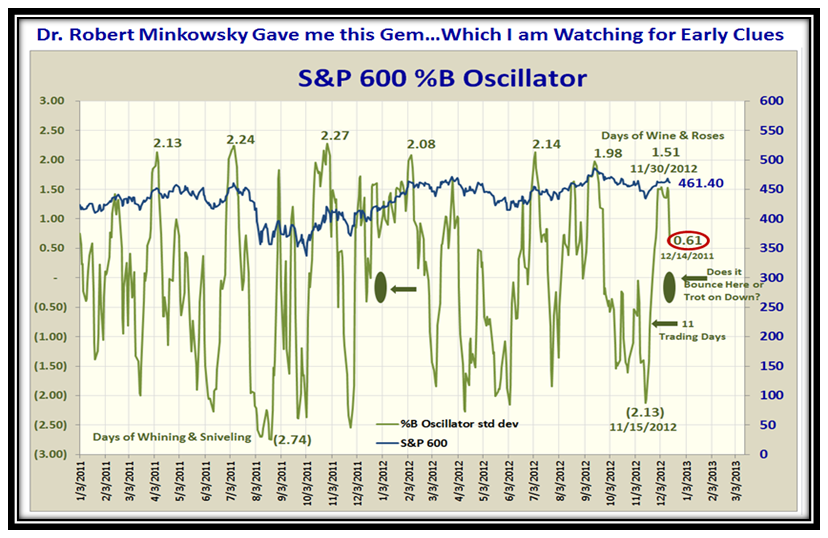
I will be discussing the fruits of these charts at the Roundtable on Tuesday afternoon, but suffice it to say that we are at a critical juncture where we either stop the skids and rebound or trot on down into the abyss which would imply that the Market did not react favorably to the Fiscal Cliff News eagerly awaited.
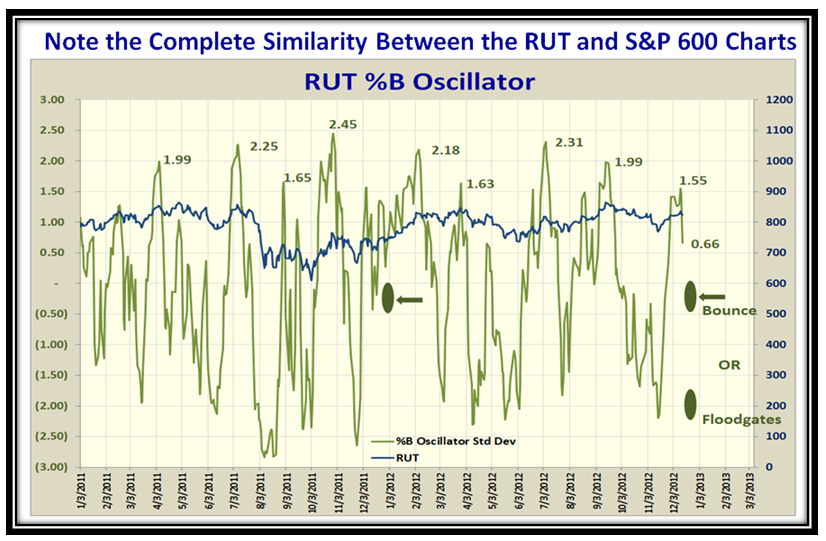
Although this is new work, it has great promise on several scores:

1.  The charts show that we have normalized the %B Readings to swing using Standard Deviations

2.  Options Traders will get excited as they use Std. Devs. in their work

3.  The Movement is magnified and rapid between Tops and Bottoms with hesitations in the 0.5 to -0.5 area

4.  Short Term Traders should love this stuff as Tops > 1.5 Std. Dev signals time to look for a move down

5.  Likewise, look at the sharpness of the bottoms to identify when the Market is about to go up

It won’t take long to wait to see the results based on the two conditions I have given you to look out for.

Remember, that’s what friends are for…what goes around comes around!

My Deep Appreciation to you all in the Autumn of my Years,

Ian.

Stock Market: Season’s Greetings and Newsletter Overview

December 15th, 2012

We are now into the Santa Claus Rally, and it is that time of the year for the HGSI Team to wish you Season’s Greetings and to thank you all for your support throughout the year.  It has been a “mushy” month, but through all the Wall of Fear, the Stock Market has bounced back from the doldrums of three weeks ago and is challenging the High Road Scenario.

I sense we are all fed up to the hind teeth with this Fiscal Cliff mumbo jumbo, but we now have just a couple of weeks to go before we have this uncertainty behind us, one way or another.

Besides discussing the High and Low Road Scenarios, my theme for this month is to give you an update with three signs for when the Jobs Report numbers in 2013 will determine whether the economy has at last turned around.    This month Ron did a quick review of the process he covered last month, the One Step Scorecard view, and then he moves on to show you how you can use the Group Inclusion Report to prospect.

The Roundtable discussion is on Tuesday, 18th December at 4.30pm EST, where we will as usual expand on the ideas in the newsletter.  You must be a Newsletter subscriber to sign up to attend the Roundtable.

Thanks to all of you for responding to the poll of which 35 said they were interested in coming to the Seminar on March 23 to 25, 2013 at the Palos Verdes Library and as always we will have fresh material to cover as we again raise the bar.  We look forward to seeing you.

Best Regards,

Ian.

Stock Market: Santa Claus High Road?

December 10th, 2012

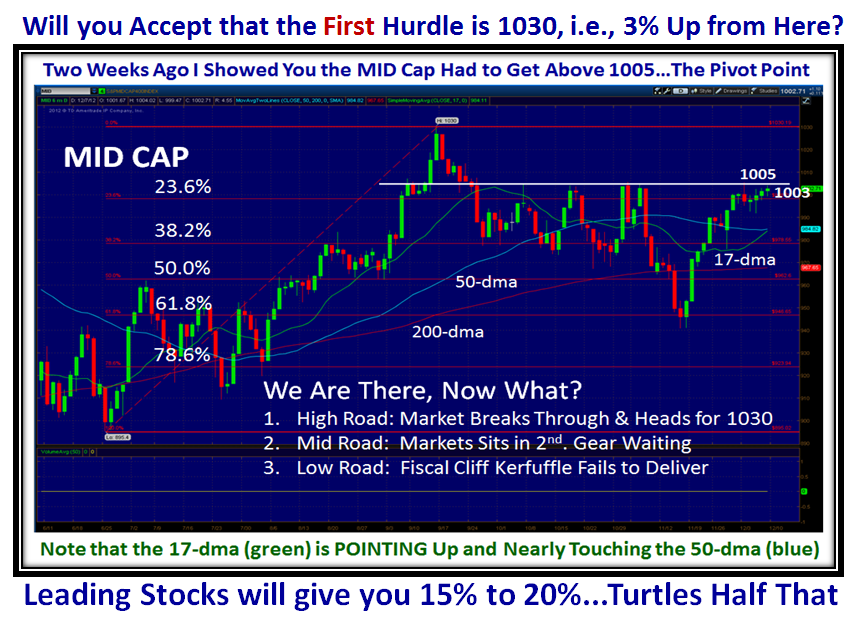
I’m sure some of you are itching to buy the Santa Claus Rally now that the Market Indexes are showing signs of life. On the heels of the Blog Note I put up on Saturday, my good friend Dr. Robert Minkowsky noted that I had shown the Mid Cap S&P 400 Market Index leading the charge. He gave me some ideas that will at least give a perspective of what are the challenges for both the S&P 400 and the Russell 2000 to take the High Road from here:

Let’s start where I left off on Saturday, and you will accept that the first Hurdle is for the S&P 400 to get above 1030.

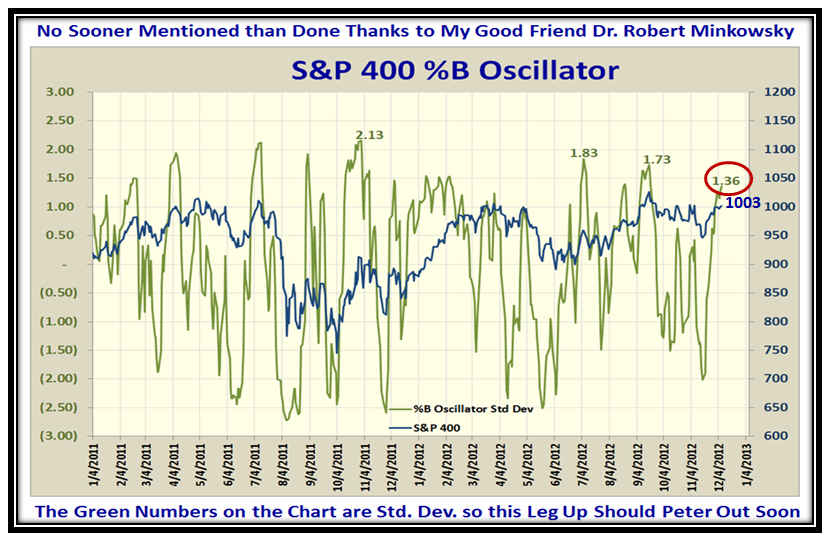
Since the intention is to buy into this Rally at this stage with the 17-dma about to break through the 50-dma to the upside, the question is where does %B stand relative to past history and how much cushion do we have?  Robert has used an approach where he has “Normalized %B” using its Standard Deviation with about 23 Years of past history.  He calls it the %B Oscillator, which is shown below for the S&P400:

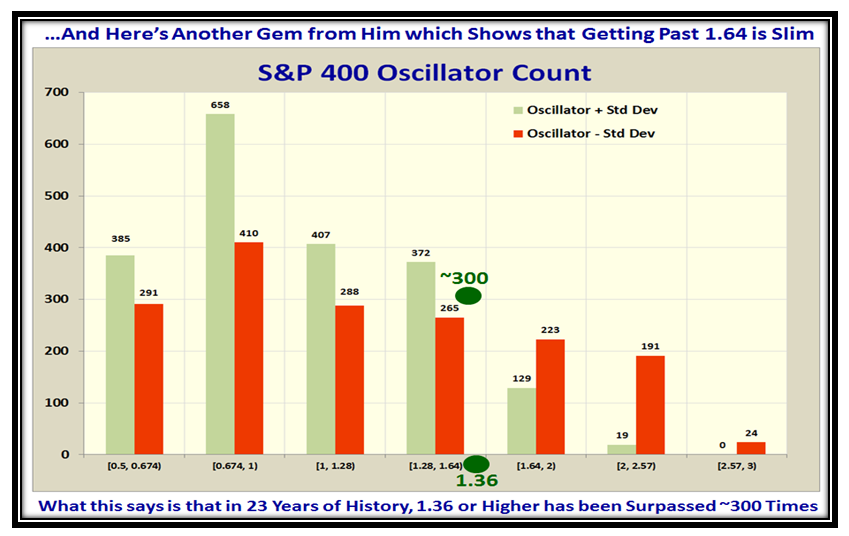
2 Std. Devs. is the Yardstick so we see that we still have some cushion with the reading in green at 1.36, and we can compare it to recent past history.  The second picture shows the statistics for the “Oscillator Count” over the 23 Years of History, and as I highlight in Green, 1.36 has occurred about 300 times:

However, if we look at the next yardstick of 1.64 Std. Dev. it has occurred only 129 times, so although the Mid Cap Index has surpassed that twice before this year, it suggests that is about as far as we can expect it to go on this Rally.

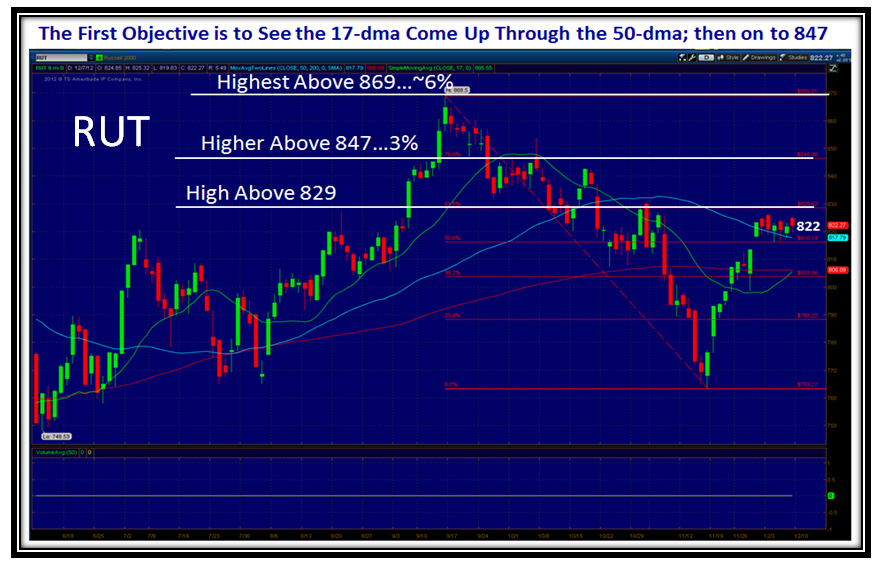
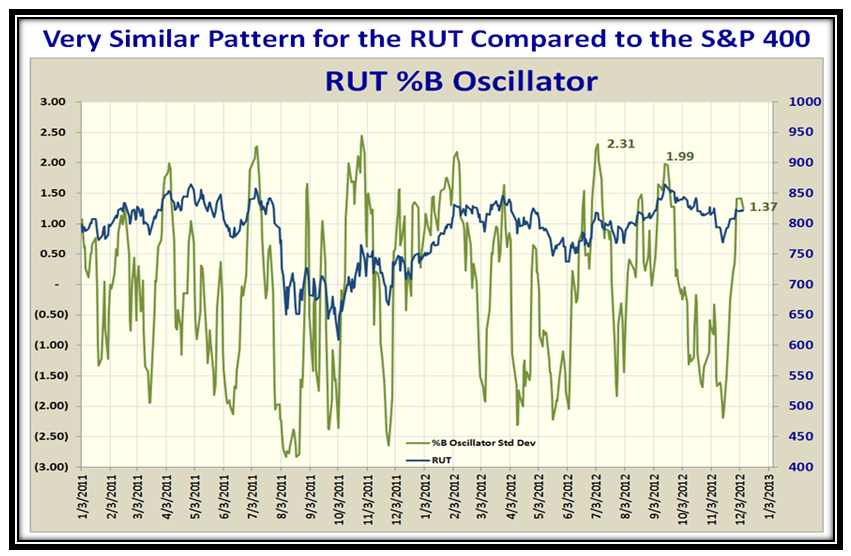
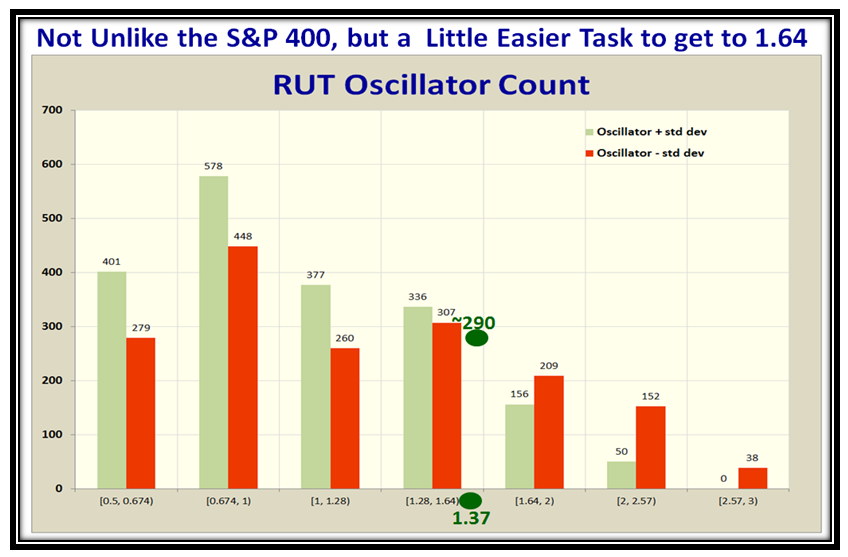
I’m sure you are asking “What about the Russell 2000 (RUT), since small caps get a boost at this time of the year with the so called “January Effect”?  No sooner said than done:

The results are very similar, but the RUT has a bit more cushion since it shows 156 readings at 1.64 Std. Devs. compared to 129.  The net bottom line is to be on your toes with tight stops if you are entering the Market at this stage where you are certain there are big things to come when the Fiscal Cliff kerfuffle is behind us before the New Year.  Thank you Robert for a new perspective of how to use “Normalized” %B with Std. Deviations and Historical Count.

Best Regards,

Ian

Copyright © 2007-2010 Ian Woodward
Disclaimer: Commentaries on this Blog are not to be construed as recommendations to buy or sell the market and/or specific securites. The consumer of the information is responsible for their own investment decisions.