History Begs the Question – More to the Top or already in a Correction?
Is this a Top similar to 1999/2000 or are we already in a major correction ala 2001?
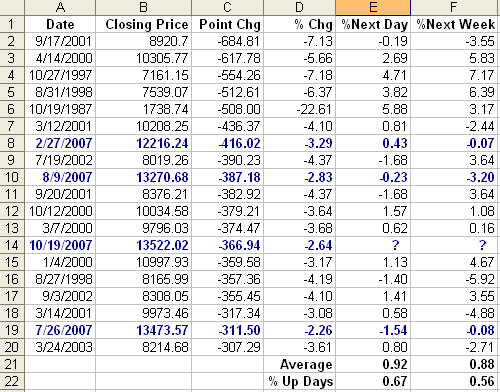
There can be no question that essentially all the Market Indexes have ugly chart patterns as a result of Friday’s major drop, with many suffering Big and Little Kahunas (a one day drop in Bollinger Bands %B of -0.40 or -0.24, respectively). To put things in perspective, we should look at two factors, one related to past results on such big dip occasions in the DOW the following day and week, and the other as to how the Gorilla leaders faired. Let me quickly remind you that we have this year already had bigger dips twice on 2/27/2007 and 8/9/2007 of 416 and 387 points, respectively, and one on 7/26/2007 of 312 points. So we have certainly had a Yo-Yo market to contend with, and we are getting used to it, so it should come as no surprise. That doesn’t mean we should be complacent. Percentage wise the 367 point drop on Friday was the 2nd lowest with -2.64% and 7/26 being the lowest at -2.26% in recent history:
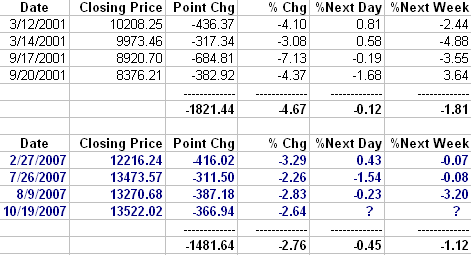
We can see there have been 19 recent occasions that the market has dropped over 300 points in a day. The question is what do we expect on Monday and for next weekend? It’s not a big sample, but there are two chances in three it will be up on Monday, and nearly a 60:40 chance by the end of the week. If we re-arrange the table to compare the big dips that occurred between 2000, 2001 and now, nobody knows for sure but we get a few hints of what might happen. If we first look at the comparison between 2001 and now, we must recognize that we were already well into a Bear Market, and were still struggling to recover:
-
It is interesting that in 2001 we had two similar sets of action on 3/12 – 3/14 and 9/17 – 9/20, dates that were very close to each other in the same week.
-
The following day is usually less of a dip or even a small rise.
-
But then the floodgates open and by the end of the week there can be a complete capitulation and rollover followed by a steep rally the week after (not shown).
-
Realize we were already well into a Bear Market in 2001 and struggling to recover, whereas we are currently attempting to stave off a major correction after five years.
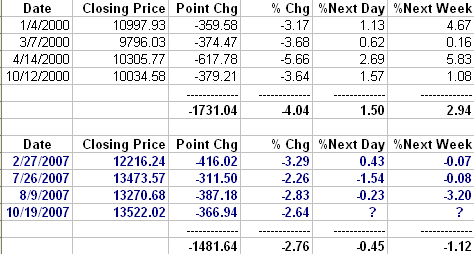
Now let’s look at the comparison between 2000 and 2007, which is more in keeping with where we stand in the cycle of events relative to this long rally showing similar signs of topping as it did back in early and late 2000:
-
Note the similarity to now in that the occurrences in terms of dates are spread out over the year.
-
Realize that we are at the top right now and essentially on what is a false breakout on all major Market Indexes having just had an intermediate correction on the Nasdaq back in July and August. The Bulls are still in control, but showing major signs of fear based on all we have been through the past twelve weeks, and the long black candle recorded yesterday.
-
Using this comparison suggests a snapback on Monday and by next weekend.
Only time will tell. Those that hope and are either not close to the market or long term buy and hold types will say this was a pimple in the long term perspective and the market will come back and ride it through. Those that fear know that we had a major shot across the bow fortunately with warning from the Hindenburg and we should take protective action if we have not already done so with the debacle of 2000 to 2002 still fresh in their minds.
It is amazing what one can do with numbers to prove any point we wish…which is not the thrust of this note. Rather, I like to use past history as to what the alternative scenarios may be and then have the market tell us which track it is on. In my next note I will give you items to look for and how the Gorillas fared on Friday.
Best Regards, Ian.
 Ian Woodward's Investing Blog


