The $64 Question: How Big Will The Correction Be?
One thing we have put to bed is that when the Hindenburg Omen speaks, HGS Investors listen. Hopefully most of you took cover and are sitting in your foxholes or else took advantage of the weakness in the Market Indexes and used leveraged Inverse ETF’s to give you maximum gains using the likes of the QID. Those Indexes with the fattest profits took the worst shellacking and needless to say the Silverback Gorillas got hit hardest and gave up the most profits. Now for sure you understand the game and how to play it…it is great fun hopping on extended stocks to make the biggest gains in the shortest time in buying the Rockets, but the higher they rise the harder they fall and I trust you were selling those great stocks before they turned to Rocks. Buy Rockets and Sell Rocks!
Now of course the $64 question is how big will the drop be, so we bring out our measuring rod and arrive at the targets for Low, Lower and Lowest? Since I mentioned that Big Foot put in an appearance two days ago and then disappeared into the bushes when the market came roaring back in the last half hour, yesterday’s Market Close made sure to indicate that he had appeared again with a vengeance. So we will use him for the Low Target, King Kong for the Lower and Godzilla for the Lowest…indicating a Bear Market! A good friend suggested that would be a good way to keep it simple, so why not?
The Measuring Rods:
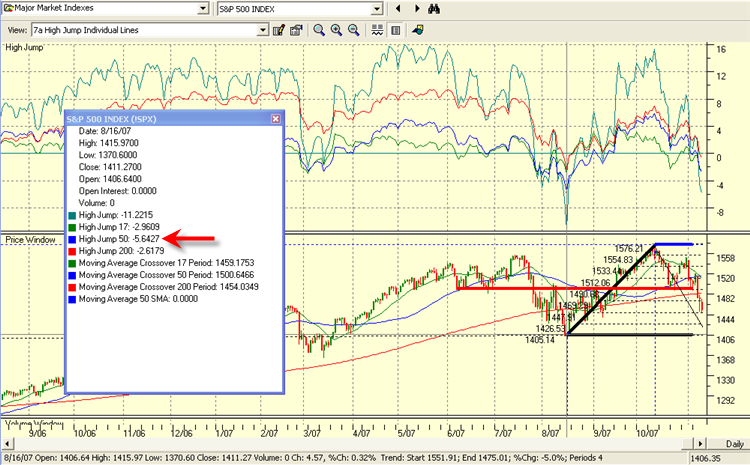
As we can see from the chart, we are already down ~8% from the High to Low on both Indexes, and do not have much further to go to chalk up 10%. Given that we finished the day on Friday close to the lows, it would seem reasonable we will at least test the 10% level early next week if not on Monday. It is always wise to have tests-of-reasonableness and the obvious measuring rod… (I love that term coined by another good friend…it reminds me of the guys with deep poles checking the snow level or the yard marker chains on the sidelines of the football pitch), …for doing this is the Limbo Bar, which is the inverse of the High Jump. The short answer is the numbers seem reasonable for now as shown below. Anything lower, immediately will confirm we are in for a worse time than last August 16, so you will need to button down the hatches fairly tight if that happens:
-
S&P 500: Last time the Limbo Bar for the 50-dma was -5.6427 and since the current 50-dma is at 1515.52, this suggests a target of 1430 for the S&P, slightly less than 10%.
-
NASDAQ: Last time on August 16, this went down -5.5434 for the 50-dma, and since the 50-dma is currently at 2717.98, we could get to 2567, slightly more than a 10% correction.
For completeness, we should look at the potential of a Bounce Play from an oversold situation, where we have had three hefty down days in a row and the quickest way to dispense with that target is to first see these two Indexes repair above their major resistance levels at either the 200, 50 and eventually the 17-dma. So there you have it, Game Plan and Targets all set for Monday and now the scenarios are:
-
Stay in your foxholes until we get a “Bingo” followed by a Eureka signal
-
Find items to short, but you must be super nimble
-
Alternatively, look for Silverback Gorillas least hit for the upside scenario, should the market decide to give us a Bounce Play…don’t bottom fish now; it’s usually a waste of money.
Let the market tell you which way to go. It’s always “Your Call”. Best Regards, Ian.
 Ian Woodward's Investing Blog


