Ian Woodward's Investing Blog
Gunfight at the OK Corral – Round #2
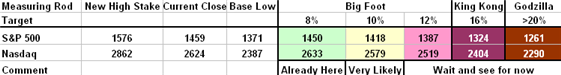
I have been busy these last few days getting the Monthly Newsletter done and holding the Saturday once a month meeting. Now that these events are behind us, the question in everyone’s mind is what are the alternative scenarios from here and what do we do about them. So, as they say in Bridge, let’s review the bidding before we make the call. Always start with the “Stakes in the Ground”, which are indisputable facts. We are all familiar with the picture below by now. They are the Stakes in the Ground, with the demarcations for a Minor Correction of 8% to 12%, an Intermediate Correction of 12% to 16%, a Major Correction of 16% to 20% and a Bear Market of >20%. I gave you the warning that Big Foot was already out and about and that King Kong and Godzilla are lurking in the wings. These Measuring Rods are the standards by which HGS Investors measure the depth of the correction:
This time I thought I would use the Nasdaq Chart to show the boundaries of the Fight at the OK Corral – Round #2, between the Bulls and the Bears:
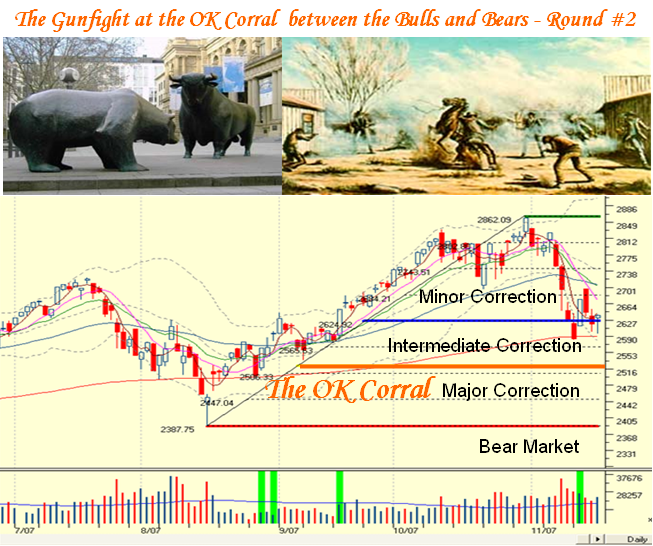
You will recall that I said the Bears would be back and licking their chops having been thwarted not once but twice by the Grand Ole Duke of York, aka Ben Bernanke, aka Helicopter Ben. They are in a lot stronger position this time than when I first presented a similar picture back on August 27th. Looking at the chart we can see:
-
It doesn’t take two seconds to see that the Ballgame can go either way…we are at the 50 yard marker, and just above the 200-day moving average.
-
All the Moving Averages are pointing down, except the 200-dma which is flat and is the next line of defense at 2590. Ideally, the Bulls need to hold at the psychological 2600 level or Big Foot will be pounding on the door at the 2519 level which is 12% down from the high to complete an Intermediate Correction, and that is again too close for comfort from the psychological 2500 mark.
-
After that skirmish, we can see a Bear Market looming at 2400, which is an easy number to remember
The net of all of that is a very simple barometer for you to remember, 2600, 2500 and 2400. What actions you take to the downside is for you to decide, but suffice it to say if you sit around contemplating your navel if it breaks 2600, you are being a trifle reckless. Just cast your beady eyes over to the first gunfight and you have only to see that it doesn’t take much to be 3% down below the 200-dma which is the usual recent limit of tolerance for the Limbo Bar (the inverse of the High Jump, which was explained in a previous blog). 6% down throws us into a major correction and anything further we are into the depths of a Bear Market on the Richter scale.
Assessment of the Facts Since the Last Correction: Every word of the above is fact, and at least puts forth the various downside scenarios in a cogent and logical fashion. The probability of which scenario occurs is in the lap of the gods and that is where I set myself apart from the gurus who are eager to step up to the plate and prophesy one way or another. My Party’s Over blog of November 12th was to remind us that fresh out of the October Seminar just two weeks prior the strategy of playing “Nifty Fifty” Silverback US and Chinese Gorillas was over for now, as there are very few of these great stocks that haven’t suffered a minimum of a 15 to 20% correction, and most of them as much as a 25 to 40% correction, if not more. Just review for yourselves where the five horsemen have been down to in the last week or so, i.e. GOOG, AAPL, RIMM, GRMN and BIDU. I also told you that the Chinese Silverbacks were down 19% from the week previous where they were down 9% as a group. Most of these stocks are sitting at the 50-dma and either trying to recuperate or are tasty morsels for mince meat by the bears as they shout charge and go for the killing on head and shoulders chart patterns. If 2000 to 2002 is in the dim and distant past for you, in Bear Markets few stocks are spared a 40% or more pummeling.
What are the Alternative Scenarios?
-
If you are a long term investor then it is prudent to take a defensive posture. However if long or short, you have several alternatives: You can move to cash, buy puts or hedge by playing the Ultra Long or Ultra short ETF’s providing you are nimble and at your screen. See below.
-
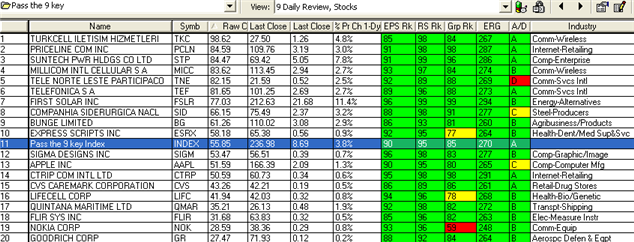
If you are an intermediate term trader, you might well try your hand at the likes of the QID, SDS, TWM, SKF, FXP if you think the trend is down, or look for ETF’s and/or strong Silverbacks in the QLD, SSO, UWM and UYG. Strong Stocks are easy to find with HGSI…a quick answer on the fly is to use All Securities in the Warehouse, make a group from list of those stocks that have earnings reports out, so you don’t suffer from bombshells, and use the Gorilla Fundamental Combo to identify the best stocks. Make a group from that list of say the top 60 stocks and then using those in the Warehouse you can go a step deeper by selecting only those stocks that pass the “Daily Review 9 key” where the prime credentials require Stocks with an EPS and RS Rank of 85 or better. Out of the kindness of my heart I have done this for you below, but don’t shout if your list is different than mine. If these don’t do better than the market next week, then we might begin to say “What’s left, but the Party might well and truly be over!” It’s Always “Your Call”.
-
If you are a day trader, you are well tuned to knowing how to manage this tricky market.
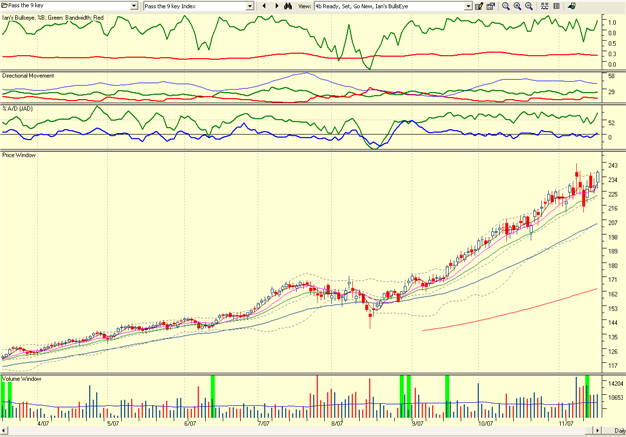
The Last Dance Iandex
Please note that there are no more than 2 stocks in each Industry Group, we have 19 stocks not counting the Index and there are 16 different Industry Groups represented. I will call this the Last Dance Iandex for posterity sake and we can keep a beady eye on how it behaves for future reference. Here is the Chart for the Index and it looks as if it wants to go again. If we get a Thanksgiving and/or a Santa Claus Rally this bunch may give us an early clue as to which way the wind is blowing. Enjoy the versatility of the HGSI Software for any market. Best regards, Ian.