$64 Question – Glass Half Full or Half Empty?
It goes without saying that the question on everyone’s mind this weekend is what the “Cartoon Says”! It happens to be very correct right now as the Bulls and Bears are not quite at the 50% retracement level, the 50-yard marker. Beggars can’t be choosers, but the Bulls will certainly take their position this weekend compared to last weekend when they were on the ropes.
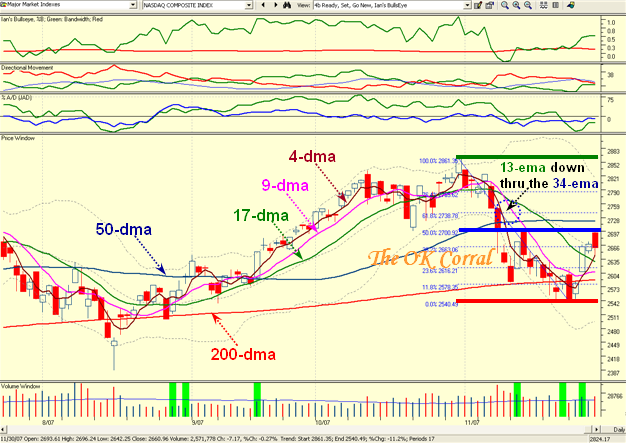
John Murphy has written an excellent piece of what to look for in the Markets and I am sure one can Google it and find the article which seems to be floating around the bulletin boards the last day. Anyway, a strong supporter Rick wrote and asked if I would take a look at some of his points and maybe throw my two cents in the ring this weekend…which I will attempt. One concern that John Murphy has expressed is the 13-ema coming down through the 34-ema, and I decided I would show you a chart with my normal moving averages not to confuse you, but to show the point where the 13-ema crosses the 34-ema. It is the dotted circle with the black arrow showing the crossover point. Note how similar this is to the 9-dma crossing the 17-dma…the pink line down through the green line.
As you will recall from our past work we always want the faster moving average crossovers to be driving up through each other but most importantly we need to see the 50-dma flat or pointing slightly up when this occurs. As we can see from the chart, the 4-dma and 9-dma have both turned up but the 17-dma is still pointing down and none of them are anywhere near to breaking UP through the 50-dma which is flat. Those of you who are tempted by all the “fru-frau’ around you of our friendly Financial Newspaper making the unusual call which flummoxed their readers that we had a follow through day as the signal to jump in with both feet got taught a lesson; especially if you fell for the trap that was set on the Nasdaq and the NDX in particular first thing on Friday Morning. They telegraphed the move which had the market makers dancing an Irish Jig, especially as my good friend Mike Scott reminds me that one of the things that bother him is “our friendly newspaper using moving indexes. That is indexes that change weekly or more often to determine a rally start. 85-85 and Top 100 are both like that and constantly change.”
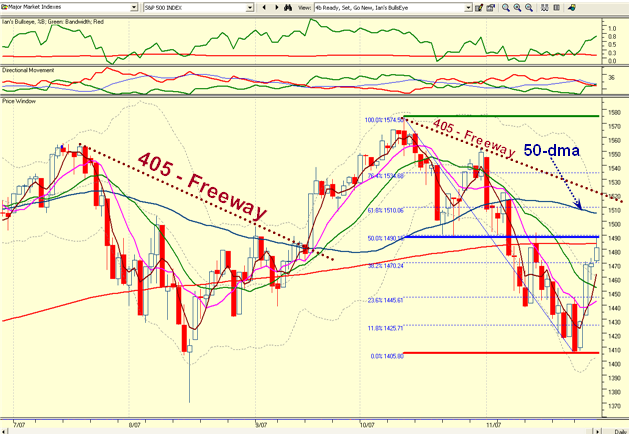
Another point that John Murphy makes is that the S&P 500 needs to clear the 100-dma line which means it must get above 1492. As you can see from the chart below that would mean it must get above the blue line…the 50-yard marker. I would much prefer to see this Index above the 50-dma and sitting at the 61.8% retracement level to feel comfortable as the 50-dma is still pointing down. If you look one stage back when we were all biting our finger nails after the August 16th bottom, note how the Index had to grind its way back and forth before it could get itself above the 50-dma. Don’t be surprised if the S&P 500 Index retests the 1440 level, especially as it has not got above the 200-dma as yet. Although the four day bounce has been impressive, it takes a lot more oomph to drive through all the overhead supply. The second important point I have taught you is that the Index must drive above the “405 – Freeway”, which is shown on the chart, i.e. the downtrend line from the highs. At this stage it is a long way to Tipperary! I might remind you that this is all basic HGS 201! Go back to the basics and pull out that PDF and digest the slides around the Base Low and what the steps in the process are for it to clear the Overhead Supply. Alternatively, for those who are new readers, browse back through some of the previous blogs to find similar discussions of what to expect for steps to recovery. 
So let’s review the bidding:
-
The Market Makers gapped all major market Indexes up first thing on Friday morning and the likes of the Nasdaq and NDX didn’t see that level again all day and finished with red candles. Most of the Gorilla favorites such as GOOG, AAPL, RIMM, BIDU, etc all got hit for the rest of the day to finish down…a sign that buying these beasts on dips has worn a trifle thin now and is left to the day traders to play with in their sandbox. Fortunately, my friend Mike Orlyk thought better of it and stayed out after reading my blog on Thursday night. Those of you who want more assurance before you venture in, do yourself a favor and go back one paragraph and read it over and over again for knowing when it is safer to start to engage in the euphoria. The Early Bird catches the worm but watch out for the Hawk above. Sure there are all sorts of opportunities, but fit the stage the market is at to YOUR STOMACH and not someone else’s. Right now this is a Day-Trader’s market, period.
-
As it turns out most of the movers were in the bottom-fishing category of the Home Builders and Financials, and for good reason due to the news on an anticipated rate cut, but more importantly a deal that is being worked out supposedly with the government to keep the Adjustable Rate Mortgages from being adjusted up. This helped the Constr-Resid/Cml, Finance Mortgage Svc, Banking Regional etc. I know most of you watch my associate, partner and good friend Ron Brown’s free weekend movie but if you don’t you can get a good feel for all of this far better than I can do justice to it in this blog. Try this url to enjoy 20 minutes of fun and pulse of the market: http://www.highgrowthstock.com/WeeklyReports/. It takes you to the “Available Market Reports” and you can then download the Dec1, 2007 movie.
-
Understand that much damage has been done and we need to be more patient regarding the recovery compared to the previous phase that led to the August 16th bottom. Just look at the chart above and you will see there is a lot more overhead supply to overcome this time and the mood now is more of selling into the rallies rather than starting a fresh full bloodied rally. Fortunately with each passing day we bridge closer and closer to the FOMC meeting on Dec 11th. Since all the signals reassure the market that Helicopter Ben stands ready and able to cut a further 50 basis points, we may eke out a Santa Claus Rally of some sorts, but that is all wishful thinking right now especially as that is the predominant talk around the office cooler by everyone who don’t know a Cup and Handle from a High Tight Flag.
-
I am grateful to my good friend Mike Scott who provided me data to show how the underlying internals of the market have faired through this correction. All internals on the market obviously show we are badly oversold so it was not surprising that we should expect a decent bounce play given the latest fresh news. Understand that:
- The % of stocks above the 200-dma is a paltry 35% having risen from a low of 27%
- The % of A+B accumulation to the total is 33.5% having risen from 23.9%. It should normally be at well over 50%. Those with “A” accumulation is a meager 5%.
- The % of “E” stocks is at 13.3% having dropped from a very negative 22%. Most rallies start from such oversold level
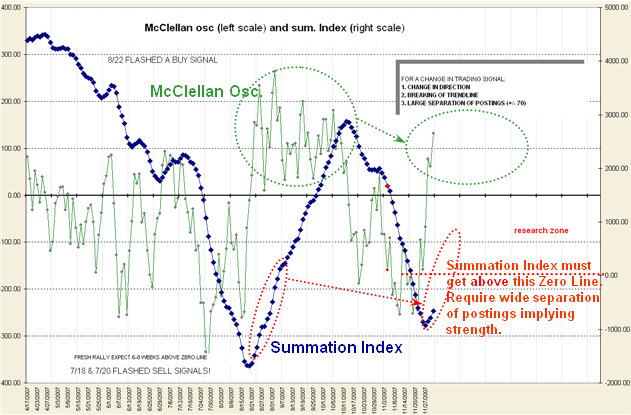
- Mike also provided me with the information on the McClellan Oscillator and Summation Index and it is encouraging to see that both have turned up with the former now into positive territory. However as you can see by the empty circles we need to see the Mc. Osc stay up above the zero line and the Summation Index rise rapidly with large separation of postings to get above the zero line for a bull rally to continue. It is currently deep in negative territory. He goes on to remind me that the FOMC being caught between a rock and a hard place leaves them with three choices “stagflation, inflation, recession…what a choice.”
On re-reading what I have written, I can’t help but feel that I am giving a gloomy picture, but I would rather layout reality than a lot of fluff of how good it is going to be. The market will do what it wants to do and nobody can tell you with any certainty that they are Soothsayers. After all, we started from a worse low and more panic on August 16th so we have to keep these things in perspective. The bottom line of my message is that there may be a short term rally in the making, but the longer term is far less re-assuring. My thanks to many of you for chirping up with helpful suggestions and information. Many hands make light work. It’s always “Your Call”. Best regards, Ian.
 Ian Woodward's Investing Blog


