Technical Analysts on the Horns of a Dilemma!
The market struggled throughout the session after bond insurer MBIA Inc. reported a large exposure to risky debt and Bear Stearns posted its first-ever quarterly loss. But the Dow Jones Industrial still finished up 39 points at 13,246 after a late surge. The S&P 500 index gained 7.1 points to 1,460, while the Nasdaq Composite gained 39.9 points, or 1.5%, to 2,641. However, the after hours earnings report from one of the big horsemen…RIMM, should at least give a boost to the Technology stocks first thing tomorrow. Don’t forget it is Triple Witching on Options Expiration tomorrow, so be prepared for another wild and wooly day.
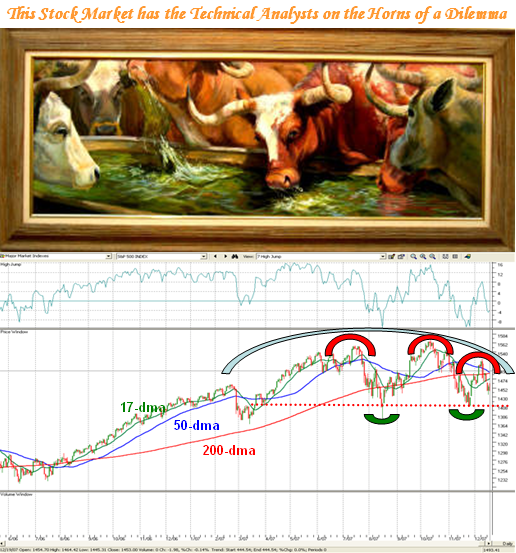
Coming now to the theme of this particular Blog, you can see from the diagram above that we are right at the fork in the road. Depending upon your leanings and whether you are bullish or bearish, we either see the glass half full or half empty. The Chart on the S&P 500 above shows the High Jump or in this case we need to look at the bottom of that piece of the chart, we see that we have had two lows put in on the “Limbo Bar” in keeping with the lows shown by the double bottom with green ellipses on the S&P500 Index. Two corrections of over 10% for the S&P 500 is a trifle unusual, unless this is signaling the beginning of the end of the long rally since the start of 2003.
Markets seldom rollover in a hurry unless one has a 1987-like crash and then they are usually short lived, though the damage that ensues from panic selling can cause a two year wait to recover on many stocks. So, if this is the start of the bear’s favorite scenario then there are three points that I can address for you from the chart above:
-
I show the makings of a rounded top with the semi-circle ellipse in blue. It will take a fresh rally to a new high to negate that look on the chart.
-
We can clearly see the makings of a head and shoulders top with the three red ellipses I show.
-
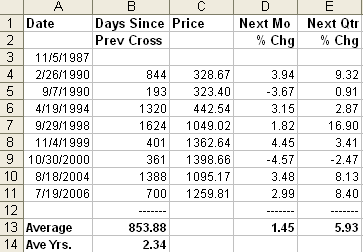
When the 50 day Simple Moving Average (SMA) crosses below the 200 day SMA, it is called a “death cross.” When the 50-dma crosses above the 200, it is called a “golden cross.” As you can see from the chart over on the extreme right we are very close to the 50-dma (blue line) coming down through the 200-dma, the red line. That doesn’t have to necessarily mean a catastrophic failure and is really only significant when we truly break the uptrend for a long Bear Market as occurred back at the top of the market in 2002. Note that the chart shows on the left-hand-side that we last had a death cross back in July-August of 2006. Here are the statistics of the several breeches of the 200-dma since 1990:
As the chart shows the really ominous occasions were when we had a bear market in 1990 and again from 2000 to 2002, which I need hardly remind you was brutal. The negative numbers on line 9 can be a trifle deceiving as the 50-dma never recovered to get above the 200-dma for all of two years. Otherwise, when the market is still in a rally, these so called death crosses are a trifle innocuous as the next month and three month readings show.
However, in the event of a downturn, this little bit of statistical history does give us a measuring rod for the expected minimum downturn in the S&P 500 for the following month AFTER the cross takes place. We should expect a further 4% between friends from that point. Using 1460 as the starting point, a 4% correction would take us down to 1402 which again would be tantamount to a double bottom as a minimum within a month from it happening. We must realize that we are already down -7.4% so that would mean three corrections of over 11% in a matter of six months, which demonstrates the extreme volatility we have to put up with. That in itself is a decent clean out. Please understand there have been deeper clean outs of -13.89% and -9.68% in 1962 and 1946 for the next month, but I prefer not to go further back than 1990.
I repeat something I have said before that the only saving grace for the bulls is that unlike the 2000-2002 timeframe, the overall P-E even allowing for catastrophic performance in the Financial Sector of the market still suggests that we are either undervalued or at most fairly valued. After all, 17.2 P-E is the historic average based on 56 years of my studies on the S&P-500. Assuming there is no gain in Earnings in 2007, and using 85 as the yardstick for 2006 for the S&P500, we get 17.2 P-E! Amazing what one can do with numbers to make a point, but there are no tricks up my sleeve on this one…those are the undisputed facts, unless one is a glass half empty type and believe that a decent correction to make the Market attractive to the Value Investor suggests a P-E of 15 or less. In which case they would set their sights on 1300 for the S&P give or take 10 points. I could be wrong but that seems to me to be wishful thinking…we shall see. If the likes of RIMM and ORCL can turn up trumps with earnings as we have just seen, then for sure it will mean that the sub-prime loan ramifications are of an unprecedented nature affecting Global Markets to more than dampen the expected turn up in Company Profits which keep rolling in at a good rate.
In Summary:
-
Long-term buy and hold types should be prudent, patient and pounce from their foxholes later.
-
Intermediate-term players of the swing type for a few days or weeks grab what you can get if you use your trump card of being extremely nimble, but you need to play both sides with equal vigor if you are that quick that you can not only see the day-to-day swings, but also the INTRA-day wild rides that are completely commonplace these days. Otherwise you will lose your shirts even faster than the day-traders.
-
Short-term day traders now trade in moments and they know what they are doing or else they lose their shirts.
It is very obvious to me where the money is being made…they are heading back time and time again to the Nasdaq 100 either on bounce plays or going high to go higher on pullbacks. Also on the downside the quickest way to make big returns is the “double” ETF’s such as the FXP and the QID, but heaven help you if you can’t be quick. The NDX was up 1.9% today outstripping the Nasdaq which was up 1.53%, while the laggards were the S&P500 up 0.49% and the DOW up 0.29%. So I suggest you trot back to the previous Blogs where I cover Silverbacks and Chinese Silverbacks and find your oysters. Better yet, select All Securities, hit the 9 or 0a keys for filters and use the Gorilla and Fundamental Combo rank filter to find the best stocks today. If all of that is too much for you then use ERG >250 and Accumulation of >=B and you have the Sprinter Filter that my good friend David concocted…a cool dude who is a super fast learner. No flies on him, only blue bottles! One tip is to make sure these stocks have not corrected more than 15% from their highs. You will be disappointed with fiddling around with broken stocks that are fallen angels that have lost their halos. The Transportation-Shipping with the likes of DRYS, EXM, and NM are such examples. Best regards, Ian.
 Ian Woodward's Investing Blog

