Sometimes the Thick Blue Pencil for Highs and Lows Works Better
To those who are avid Technical Analysts, this blog note is written with tongue in cheek, so don’t feel that I have taken leave of my senses. However, there comes a point when there is a fine line between Art and Science. The proponents of the great Masters of Fibonacci, Gann and Elliott Wave will measure everything from upside down to sideways and back, and of course they are laying down the scenarios for “if this, then that, and maybe something else” in the chess game of what the market is telling us. However, sometimes trying to look five moves ahead can be detrimental to your psyche, and I always try to KISS it at times like this. Remember what I have taught you: My world works in threes: It is green, yellow or red; or it is up, down or sideways….or, you get the point. Fundamentalists pooh-pooh this stuff as a bunch of rear view mirror mumbo jumbo, and some will even never admit a mistake but leave it to their heirs to find out. Those who use both F/A and T/A are usually rewarded for their expertise at times like these.
So what’s my point? It all depends on three things: one’s time horizon, your stomach for risk and reward, and your willingness to act quickly. Alternatively, to be prudent, patient and pounce when the all clear has been signaled. Types 1 and 2 are short term players who are accustomed to high risk, look for quick turn-around and are nimble. Types 3 and 4 would rather wait it out before they act, as discussed below:
-
The Day and Moment Trader – If your time horizon is very short term ala a day to a week – you are comfortable on all three points so it is extremely important to try all the tricks of the trade and to measure this up and down and in your lady’s chamber stuff with a fine tooth comb and with precision. These are the true GANN, Fib and Elliott Wave types. They wallow in it and more power to them.
-
The Swing Trader – If your time horizon is a few weeks as a swing trader, you are itching to hit the quick moves up but don’t have the stomach to bottom fish in real time or find every nuance of what’s happening today to the “enth” degree then you look for the likes of Bingos followed by Eurekas. You also watch the friendly investment newspaper to tell you whether they grudgingly give you a qualified follow through day or a strong go signal. Well, we got a grudging follow through day message the other day and so we are still in turbulent waters, and all of us would agree. What’s more by now, you surely have been bitten as you stuck your toe in the water, because you don’t care to or know how to bottom fish in a moment to moment trade environment.
-
The Intermediate Term Trader – They have little stomach for being faked out. They are prepared to wait for the usual decent move up from a bounce play before you will consider looking for long side opportunities. In my terms that means you want assurance that the ball is currently at the 50 yard line which by now you well know is the half way blue line between the Market Top and the Current Base Low, which you have now seen drawn on the three blogs featuring the Fight between Bulls and Bears at the OK Corral.
- The Long Term Buy and Hold Type – They are not prepared to take any risk, but want to be re-assured that having got out, they can come in and stay in for the long haul of several months to over a year; especially since this blog and others all around you tell you we are on the verge of a bear market or in one and worse yet tippy-toeing into a Recession.
It is for the benefit of the last two types that I purposely introduced you to the thick blue pencil process, which you have recently seen on my blog notes and today in the Newsletter. The Keep It Simple Stupid (KISS) approach really works well if you will just look for higher highs and higher lows for you decide when it is safe to come in. All the rest is “if, and or but, coulda, shoulda, woulda stuff” that is best left to the pros at the short term game.
So if you are a category 3 or 4 type these are the process steps to remember:
-
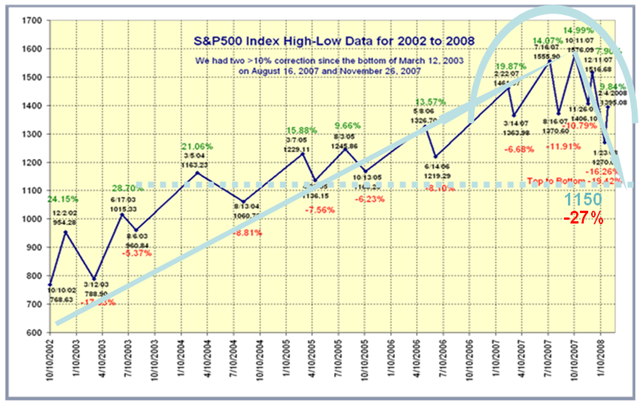
Over the five year period from 3/12/2003, we had a long rally with higher highs and higher lows
-
The corrections on the S&P 500 have essentially been < 8% since from past history we know the probability is 77% that they will not be more than that, and it behaved according to form.
-
Once you see a -11.91% correction as we did in August, that’s the time to begin to consider lightening up on your long term positions fat with profits, especially if they are laboring at the top.
-
The moment you see a Lower High followed by a Lower Low, the party is over.
-
Get your thick blue pencil out and draw the two arrow lines to remind you the direction has changed, and then for good measure draw the McDonald’s Archway, especially when it does it twice in a row to confirm that we are definitely headed down until further notice.
-
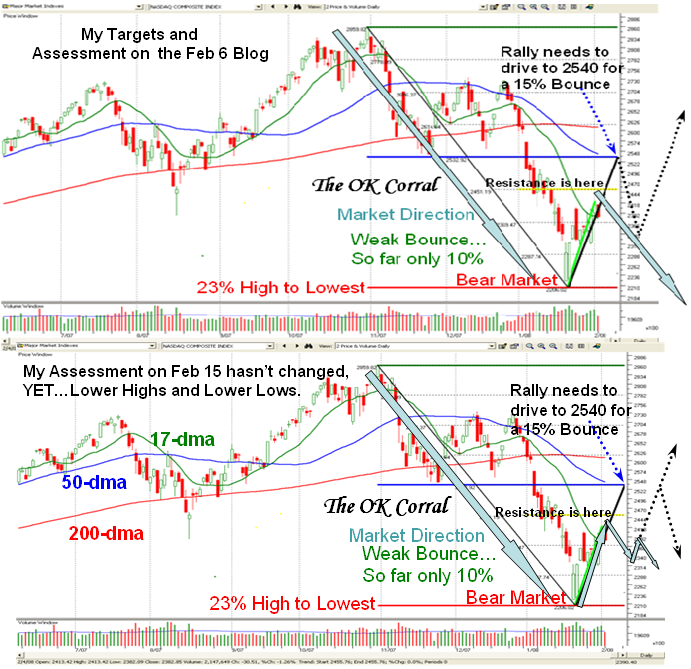
If there is a major break to the downside, expect exhaustion and a Bounce Play. That is when you draw the 50 yard blue line between the high and the low and wait to see if it can get back on the Bounce Play to that point.
-
Invariably you will be able to also define other points of resistance such as the 50-dma and 200-dma lines as shown which for sure keep you on your toes but hibernating in your fox hole.
-
It is not difficult to set Targets that would seem obvious to anyone who can at least show sufficient interest to read a chart at the HGS 101 level.
-
Then see if the Market can achieve those basic targets or not. When the Bounce Play peters out, draw another blue arrow downwards to remind you to sit tight and wait for more evidence, not withstanding Bingos and Eurekas and all that good stuff that help the short term players analyze which way the wind is blowing.
-
I don’t have to belabor the point, but the bottom chart shows where we are at right now and at this stage we are essentially on the 25-yard line and half way to either making it back up to the first Target I set of 2540 on the Nasdaq or half-way down to retesting the Base Low and/or going down further into the doldrums.
Those who are Category 1 and 2 types and have studied the relationship of Bingo to
- Of the six previous Bear Market rallies, three were long and three were short lived.
- The three long averaged 13% gain over an average of 70 trading days
- The three poor rallies averaged 5% gain for an average of 15 trading days.
…So, here we sit on a long weekend in limbo and the Market pointing down but can go either way, though the odds favor the downside. What is surprising is that Friday was Options Expiration as well as preceding a three day weekend for the Stock Market, yet the Market rallied into the close. Likewise, the number of New Highs AND New Lows are both exceedingly quiet at less than 50 each per day for the past 15 of 17 days. On Friday we had 73 new lows. We can examine the tea leaves to our hearts content, but I say yet again to the point of beating it to death until it is drummed into our heads: we cannot expect a significant rally until we see New Highs on the NYSE exceed 100 and preferably 150 for several days in a row.
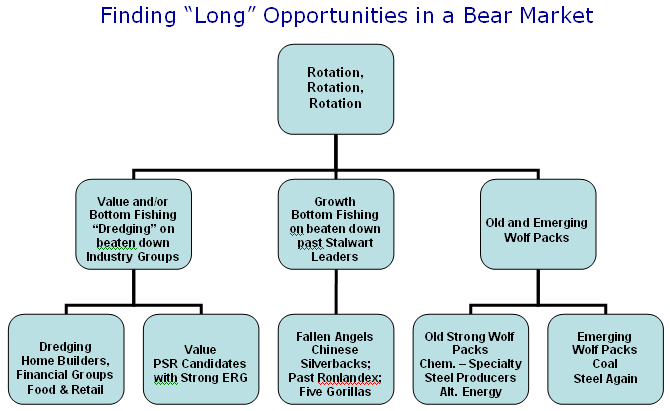
- Value and Bottom Fishing or should I say “Dredging” on beaten down Industry Groups
- Growth Bottom Fishing on beaten down past stalwart Leaders
- Old and Emerging Wolf Packs
…and because it is a nice long weekend for you to do your homework, here is the Family tree of where to hunt:

 Ian Woodward's Investing Blog


