 Ian Woodward's Investing Blog
The Decision on Round #3 of the OK Corral Fight is Imminent
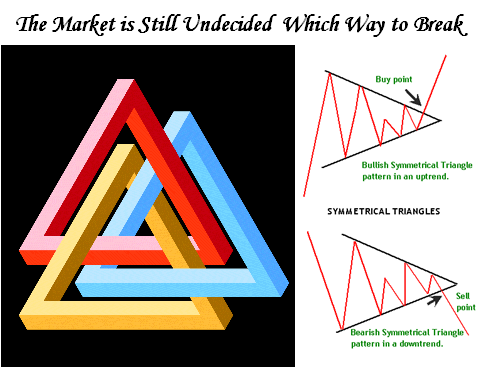
This week every short term trader has been mesmerized by one question which had Bulls and Bears still wondering which way this market will break…up or down. As part of their repertoire of tools rhey had the old favorite of Technical Analysis Symmetrical Triangles as the center of attention.
With Triangles uppermost on our minds, let’s review the bidding one more time, where I have now expanded the playing field from the High on October 31 at 2860 to a low which would take the next down leg to 2010 on the Nasdaq, as shown below. This would imply a 30% correction:
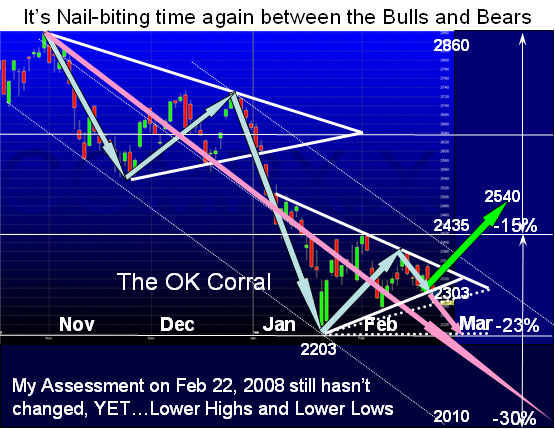
The good stuff on Symmetrical Triangles is still intact for yet another T/A element to watch for next week. Unless there is again some follow through tangible information that breaks early next week on this subject to continue to drive the Bears to cover their shorts and possibly force the pattern to the upside, the odds still favor a move to the downside with Lower Highs and Lower Lows.
-
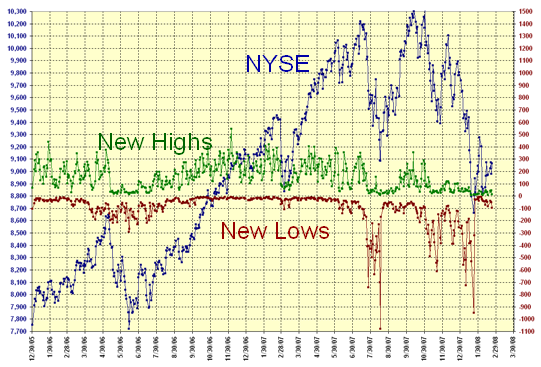
The bias to the downside is reflected by the number of NYSE New Highs being only 15 and New Lows 97 on Friday…not good. The weakness to the upside is exacerbated by the fact that since December 27 we have not had a single day with more than 68 New Highs over 57 trading days.
-
From past readings of failed rallies in Bear Markets, the longest that the rally has held is 18 trading days from the
-
The 200-dma has peaked and started to roll over.
-
% B of the Bollinger Bands has broken down through the Bandwidth, again signaling weakness.
Late Breaking News: My good friend, Mike Scott, reminds me “that the closer to the apex of the triangle that the market or stock gets the more likely to get a head fake…A short false move prior to the real move. This tends to sucker punch a lot of traders and those with stops placed close into the formation.” Next week will be interesting to see how this unfolds.
Best Regards, Ian.
