 Ian Woodward's Investing Blog
Where Are We? What Do We Do?
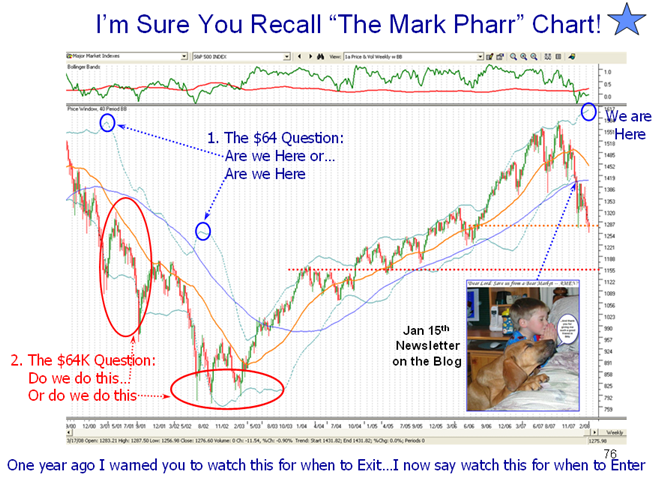
- Those of you who attended the HGS Investor Seminar a year ago will recall the Mark Pharr Chart. Why did I label it that? He is a loyal supporter and is a long term buy-and-hold type of the Type 4 variety. His point to me was “Ian, tell me when to buy and when to sell…I am not a jack in the box type.” I gave him five steps to watch from the Top of the Bollinger Band and told him that when the S&P 500 Index hit the lower band and %B had gone down through the Bandwidth (in the top window with the green line coming down through the red line), it was TOO LATE.
- Fast forward nine months and in my January 15th newsletter on this blog, the one with the picture shown where the little boy and the dog are praying there won’t be a Bear Market, I mentioned the Mark Pharr Chart as my winky-winky that you all should be doing the same.
- After today’s Fed action and the reaction by the Market to produce 4% up days on the Nasdaq and the S&P 500 and 3.5% on the DOW with a gain of 420 points, obviously the Bears had to scurry to cover their short positions one more time, and wondering what do they have to do to get more than their pound of flesh from the Bulls? Let’s answer the two questions I posed in the heading of this note:
- Where Are We Now? – This Mark Pharr Chart which is of the S&P 500 with 40 week Bollinger Bands clearly shows that we are at the identical spot (between friends) of where the Upper Bollinger Band is now compared to where it was seven years ago when the Bubble had already burst and the Index was headed down (shown by the two blue rings at the top of the chart).
- The $64 question is from a bottoming standpoint are we really at the top or half way down the ladder as shown by the blue ring half way down the chart as shown.
- The $64,000 Question is do we have one or more legs to go down or are we finding a bottom and will oscillate back and forth going sideways as we did in late 2002 and early 2003, before the start of the long bull rally from 2003 to 2007? (Shown by the two red ellipses)
- Only time will tell, but as you see by the
- Where Do We Go From Here? – The answer is easy…You know the routine:
- Types 1&2 day and moment traders, enjoy the rally as usual but be quick to play the nimble card when the rally peters out. Since VISA is the biggest IPO we have had in a long while if not ever, and it comes out tomorrow, I should expect the rally to continue at least into Friday when the usual profit taking should set in. (Editor’s Note! Friday is a holiday! I’m sorry about that, so we have tomorrow to enjoy and watch your step on Thursday.) Tonight should be yet another humongous Eureka Day, and we have come to understand that these are being manufactured by the irrational exuberance due to the Fed’s actions, whenever they inject some money into the system…the Helicopter Ben syndrome.
- My good friend Maynard Burstein says the “Wolf Packs are in the following ETF’s: XBD, XLF, IYG, IYF’ XHB, and KBE; all the financials, Brokers, Fin Services, Banks, and even the Home Builders…for a day or two!” Likewise all the stale and tired 10142007 RonIandex had every stock of 20 up for a gain of 5.1%. The early bird catches the worm, but watch out for the hawk above.
- Types 3 and 4 sit on your hands and wait for a follow through day and hopefully some signs of the New Highs vs New Lows coming out of the doldrums and driving to at least 70 higher between the two and hopefully 150 New Highs with New Lows less than 50 soon thereafter.
- The longer term depends on what happens to this picture as I also showed in the one I put up the other day on the High Jump picture comparison.
Best Regards, Ian.
