Happy Easter Wishes
After a phenomenal week of back and forth last week where we went to and fro 300 to 400 points every day, with all sorts of intervention to try and prop this Market up, let’s hope the Easter Bunny brings us some gifts this week to stabilize the situation. What can one say when the Market goes down when it should go up and vice-versa…it’s called an unplayable lie while I watch golf on a lazy Sunday afternoon and nothing is falling for Tiger. It looks like Ogilvy is back after his U.S. Open win. Well enough of golf, let’s get back to the Mark Pharr Chart, my buddy that I will be seeing this next weekend.

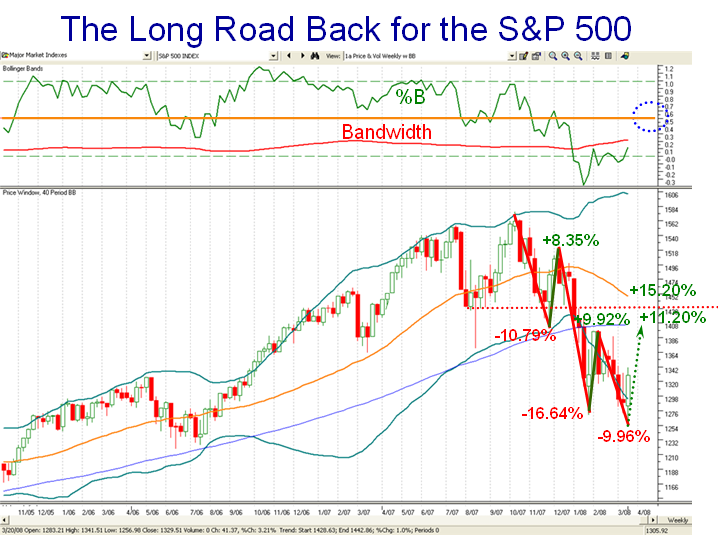
At any rate, we should learn a lot about the psychology of the Market this coming week. We should learn whether the medicine the Fed and the Administration doled out last week has turned the corner for the Stock Market or as before we get a small reaction only to fall back into the doldrums. Please understand that the line in the sand is the Orange Line – the Middle Bollinger Band, i.e., %B at 0.5. Incidentally, those who are watching Daily and Weekly Bongo should find that most if not all Market Indexes will show “Green” if that happens! Here are the steps to watch in the coming weeks if we are to see some sort of recovery:
- The %B (green line in the Upper Window) must first get above the Bandwidth (red line)
- We badly need a Big Kahuna right now, a 0.4% one day change in %B indicating a strong follow through. At least it should be a Little Kahuna of 0.24. Don’t tell me you have forgotten all that good stuff I taught you back in 2005. Better yet, you know that two Kahunas in a row is the ticket for a strong move up.
- A minimum of 13% up to get us to the natural resistance of the chart pattern as shown by the dotted red line.
- Anything less than that will suggest to me that the psychology of the Market has not changed and that this is a natural bounce play which then suggests another fall back.
- Please understand that Fundamental and Technical Analysts alike have now homed in on two levels to the downside, and I will prove this to you at the seminar. They are 1260 and 1150 on the downside. If the Fed has Technical Analysts sharpening their pencils, you can rest assured they told Helicopter Ben to act early last week if they were to salvage this market and stop the bleeding at 1260, period.
- Are we just starting our way down the long, long road to a severe drop of 30% (Say), or
- Are we already finding a bottom as we did back in 2002, and will trundle back and forth for several months before the dust clears and we head back up around the next seminar in October?!
I gave you five points to look for on the way down on the Mark Pharr chart and now I give you five points to watch on the way back up. If we break 1257 on the downside all bets are off and we revisit the situation at a lower level. Don’t forget along the way, you want to see 150 New Highs before you have any assurance that this is not a flash in the pan bounce play.
 Ian Woodward's Investing Blog
