 Ian Woodward's Investing Blog
The VIX First Shot Across The Bow Today

- Last night I gave you ten items to ponder on and warned that one should always let the market tell you which way the wind is blowing. I suggested that “the Bulls have the edge for now” but two of the three items I gave to the Bears were the 200-dma Ceiling and the VIX, below:
-
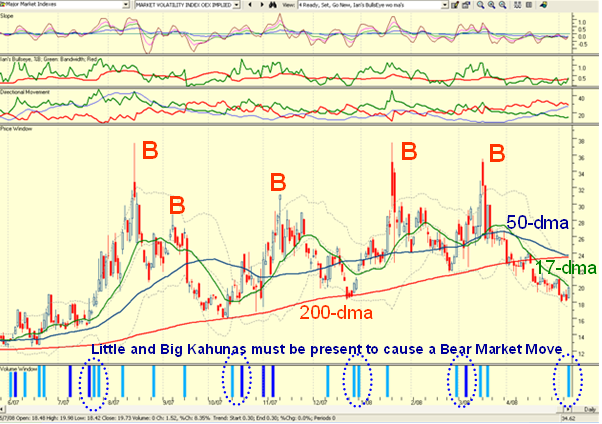
The VIX jumps up again as it did today and on the heels of the Little Kahuna (a 1-Dy Chg in %B of >0.24) it gave today we get yet another one or worse yet a Big Kahuna which is a >0.40 jump in %B. The Light Blue Little Kahuna is shown at the bottom right of the chart below.
-
Two Kahunas in a row are very significant, even if they are just a few days apart.
-
EVERY recent VIX move from its lows to what eventually became major Bear Market drives STARTED with several Kahunas, big and little, within a short period of time. For Kahunas read strong momentum and that is the secret to tea leaf reading with the VIX. If it doesn’t deliver on this score, do not be so quick to jump ship, but you certainly need to keep tighter stops after today if you are long.
-
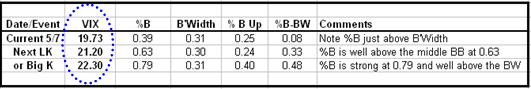
So here is a simple spreadsheet to keep your eye on the ball as to what MUST happen for the Bears to gain control once again and for this rally to fizzle. The VIX reading is currently 19.73 and with a Little Kahuna can take this to 21.20. With a Big Kahuna the VIX reading can move to 22.30. That is all you have to watch for in the next couple of days to see which way the wind is blowing. Either of those readings and preferably the latter would constitute a VIX Sell signal for the S&P 500. Note from the spreadsheet that today the %B just poked its head above the Bandwidth with a reading of 0.08 today. This after over 25 trading days being below as seen in the chart I show below the spreadsheet.
5. Note in the chart below, the VIX is just below the 17-dma line shown in green. It must get its head above that and the middle Bollinger Band shown dotted just above the 17-dma. In my judgment it can only achieve that if it has a convincing move up with either a 0.24 or 0.40 move in %B. Otherwise it was a shot across the bow that then faded away as the bulls once again righted the ship so to speak. After a brief move sideways the Market Indexes should then move up again if the targets I have set above are not achieved. While I am at it, the S&P 500 must hold above 1370, and then for sure at 1352 or this rally is doomed.
The Case for the Bulls:
- The Bulls have a little breathing room since the VIX Index is a good ways away from its 200-dma. I showed you in previous charts how it was beaten down by two lines down from its 200-dma., so there is elbow room.
- Note how the 50-dma blue line is almost touching the 200-dma red line. Any further downwards move and this would be a Black Cross and enhances the Bulls chances of the Rally continuing.
