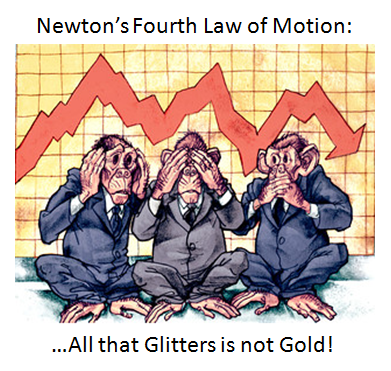
Hear No Evil, See No Evil, Speak no Evil
Mail-Bag: My confidence in eureka is shaken, if not shattered. Three of the last five eureka signals resulted in massive selloffs the next day or the one after.
– Joe the Newbie
Hi “Joe the Newbie”, aka MK, you have just defined Newton’s Third Law of Motion as applied to Investing in the Stock Market:
“To every action there is an equal and opposite reaction.”
However, there is a Fourth Law that is a riddle and is seldom known or quoted:
“What did the Monkey say when he peed off a cliff in the moonlight? All that glitters is not gold”.
With regard to that last law, I have often said “There is no Silver Bullet of a Technical Indicator, but two lead ones are better than none and four are better than two”. I will show you how true that statement is.
Returning to your opening remark, let me pick up on what both David and Maynard mentioned to you as to clues of where to look for my musings on Eureka. They were right that pages 58 to 69 of HGS 101a from October 2006 covered most of the key principles, but we have also progressed since then and I would again refer you to Pages 63 to 144 of HGS 801, which covered the totality of the Suite of Indicators. Unfortunately you only got a smattering of the understanding since you missed the first day at the seminar, so you would be well advised to peruse those pages again. Yes, we are all busy people but at least review Page 69 of HGS 101a, and Pages 69, 71 to 81, 109, 112, 142, and 144 of HGS 801. However, here are the key points, some of which are new thoughts:
1. Technical Analysis is as much an Art as it is a Science. The easy part is the 89% of the time when all markets are trending up or down within + or – 2-std deviations from the mean. The hard part is knowing how to interpret the other 5% to 6% at tops and bottoms. Page 69, and 71 to 81.
2. Unlike most Indicators which address Trading and Trending Markets such as Stochastics and Moving Averages ala MACD, respectively, most of the Proprietary Indicators we have developed in HGSI are what I would term “Impulse” Indicators to stay with the theme I introduced above of Newton’s law of motion. F=MA is a well known expression of Newton’s Second Law and means Force = Mass times Acceleration. I know, I know, for those who could care less about Newton, be patient as it is important to know what you are depending on to make “the call” with your hard earned money, and be on the right side of the market.
3. By “Impulse” I mean an Unusual Happening(s) which takes several conditions to trigger as expressed by the thrust and parry of the Bulls and the Bears in their quest for winning the battle. At times like these it is the throwing in of the towel by the Bulls that first define the points in time when the Market is groping for a bottom. That concept is captured by the three step process I have defined for Bango. See Pages 109, 112, 142 and 144.
4. I’m sure you got the message that no one indicator will do the job. That is why we stress the need to have interlocking or inter-dependent indicators whose presence or absence relate to the strength or weakness of the “Unusual Happenings”. In this case of the supporting Indicators to Eureka it is essential that the series of events are as follows:
a. Several Bingos as defined by the RSI Indicator levels being triggered as the market trundles downwards and it searches for a bottom.
b. In concert with the Bingos, we see the Deterioration phase of Bango as expressed by the Di+ and Di- going very negative, the Industry Group Rotation and Movement from A & B to predominantly D&E, and the number of New Lows compared to New Highs increasing rapidly.
c. Next we see Capitulation as expressed by the Exhaustion to the downside on the Indexes in general culminating in a Peak reading of the New Lows on the NYSE. Parenthetically in passing, to answer one of your questions, the Hindenburg, Eureka, Bingo and Bango signals are all based on the “Total NYSE content”, so that we have apples to apples comparisons.
d. The next step is a Reversal Day, which can invariably occur on the day of capitulation or the very next day. At this stage all heads are up for the expectation of a Follow-Through Day(s) (FTD) as defined by our friendly newspaper, which unfortunately has proven to be only 50% successful if that. There is substantial activity in progress by teams of people who are both CANSLIM and HGSI oriented to dovetail their findings and produce a better set of conditions which include the Eureka, Kahuna and Coppock for more positive results than before. As covered in previous blogs, Newsletters and Seminars, any Distribution Days within the first five days of a FTD will invariably lead to a Rally failure. In that case the “Count” must start all over again. That same statement can be made for any Eurekas that occur within that timeframe which are negated by a Rally Failure.
f. Last but not least we need to see major enthusiasm on the part of the Bulls where rather than a Bull Run we need a Stampede as expressed by New Highs swamping New Lows on the NYSE to the tune of at least 2:1 and well over 100 for a few days and the New Lows calming down below 50 and preferably 25. In concert with this, for starters the VIX needs to head down to at least the 40’s from the 60’s.
Now we come to the specifics of this particular set of Eurekas:
1. We have just had a Black Swan of a Capitulation as Maynard aptly reminds us and who’s to say that is the last of them? You will also recall that in my blog recording that event I coined the term “White Swan” which immediately followed the Black Swan the next day and we went on to talk about Pink and Blue ones as well. That comes back to Newton’s third law exhibiting an equal and opposite force.
2. Maynard pinpointed the increased Volatility since 2006 and we can add 2002 to that, which is at least 2 to 3 times as bad now. I have repeatedly focused on the VIX in many of my blog notes, where readings of 60 and above are rare beasts until now, and 600, 100 and 50 point swings in a day are now commonplace for the DOW, Nasdaq and S&P 500, respectively. It is no wonder that “Unusual Happenings” will trigger under such conditions, including Eurekas and counter thrusts. Irrational Exuberance does not only work for the Bulls, and the Bears have the upper hand by far right now.
3. One other point he mentioned which has had a serious affect on the whole Volatility scene is the double and now triple ETF’s which are in vogue and have burgeoned into the Day and Swing trader’s dreams of making big money in the shortest possible time. Volume has picked up significantly in recent days for all of these 3x ETFs, reaching 10,000,000+ shares per day in some instances. But the percentage change in these ETFs is what is really crazy. The inverse 3x Russell 1,000 ETF (BGZ) has already had a rally of 114% and a decline of 42% since trading began on November 5th! The Financial ETFs have been even crazier. The 3x long Financial ETF (FAS) declined 80% from its high on 11/10 to its low last Friday. Since then, it’s already up 127%! The inverse one has been even crazier. From 11/6 to its high last Friday, FAZ went from $60 to $200 (235%). Since then, it has gone from $200 back down to $70 (-67%). Nothing less than sheer gambling in my opinion.
4. Does that mean we discard Eureka as unreliable?…not to my mind. Quite the contrary, the more Eurekas we have the merrier as that is a true sign that the “Gasping Bull lying flat on the pavement ” which you sent me is at least getting some signs of resuscitation.
5. However, when one has equal negative forces as depicted by Kahunas to the downside which now we should all understand, one MUST expect when the Bears are totally in command and any rally at this stage is nothing more than short covering to await the petering out of a five day rally they will then hammer it down again.
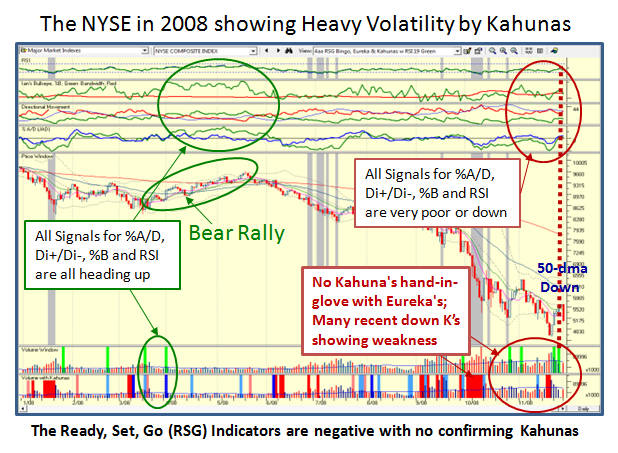
6. One missing link which made all this Eureka action suspect is the total lack of Kahunas to the upside, which is what is essential on the same day to confirm the QUALITY, INTENSITY, and FORCE of the Eureka signal, i.e, Newton’s second Law of Motion. You may have missed my Winky-Winky at the Seminar, but two Big Kahunas within a few days usually portend of better times to come, and I repeat, so far we have seen zippo, nadda, none…well just one lonely beast as shown in the chart below, and not in support of any Eureka.
7. You witnessed that Ron has become a big believer in Elder’s 2 and 13-EMA Force Index which is another vehicle he feels comfortable with together with his “I” keys, where he has incorporated much of the requirements mentioned above along with several others he favors.
8. Of course every pundit and guru under the sun is looking for a Bottom if not the Bottom, including false ones that our guru of all gurus with deep pockets, Warren Buffet proclaimed a trifle early.
Have no fear, between all the smart people in our stable which we have attracted to the HGSI family, you can rest assured we will be in unison and one of the early birds if and when we at least see a decent Bear Market Rally. That is the true value of what we offer with the help of George and Matt to give us the desired indicators as we raise the bar each year.
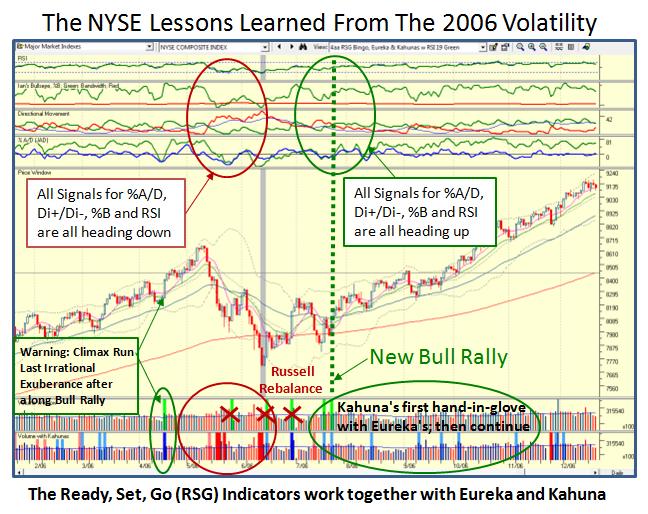
So that this does not appear to be platitudes, let’s review the bidding of what one should expect based on past experience:
1. When the NYSE is broken, the Di+/Di- will have the Di- (red line) above the Di+ (green line). It is usually the last to change to positive.
2. It is absolutely essential that the Ready, Set, Go (RSG) signals are positive and are all heading up
3. The Directional Movement Di+/Di- ,the %B above the Bandwidth, and %A/D must be above “0”
4. The Eurekas should also have Kahunas supporting the action on the appropriate days
5. The most important requirement is that the 50-dma must be flat and preferably pointing slightly up
Now let’s fast forward to the present picture which speaks for itself:
Until the Ready, Set, Go (RSG) Signals are all positive, the 50-dma is flat to pointing up and the Eurekas are accompanied by positive Kahunas, we will not have a proper Bear Market Rally. Eureka has been one of the best indicators in the HGSI bag of tricks and has served us well over the past eight years.
The lesson learned is that Kahunas go hand-in-glove with Eurekas and we need both before we can get too excited.
Best Regards, Ian.
 Ian Woodward's Investing Blog


