 Ian Woodward's Investing Blog
The Santa Claus Rally is Looking Bullish
It is ten days now and the 4th blog in this series and things are looking up for a continuation of the current trend from the Base Low of 741 on the S&P 500. It closed at 899 today after hitting the target of 915 which is the first Target I set in my last blog note. So far, so good.
I urge you to review the series of charts I have used as time has progressed these past ten days, after the Market gave up the ghost and went down a further 25% in a matter of 13 trading days.
1. The first chart had an ugly Cup and Handle of a scant seven days and was close to breaking down.
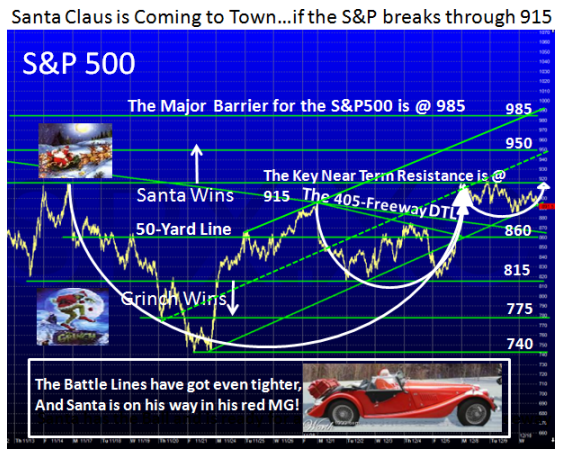
2. The second chart showed a Loose Darvas Box which suggested the key lines at 880 and 815. It also established that the correct spot for a breakout was above the 405-Freeway down-trend-line (DTL).
3. This latest chart shows a cup within a larger cup and very tight handle as shown. Not only must the cups tighten but also the handles as time progresses as it has in the last three days.
4. Now we have a series of Higher Highs and Higher Lows and we can draw a Channel as shown.
5. Note that the dotted middle line intersects at 950, which is the Next Target it must get to if the higher high and higher low scenario is to remain intact.
6. Also note how 985 now comes into play as the Major Barrier which I stated on the very first chart.
7. Finally, note how one can tighten the playing field to know when to really turn from short term to intermediate term bullish or bearish, while establishing confidence in the lines of demarcation.
Now I know that those who are rigid Cup and Handle types may be cringing that I have taken leave of my senses to even conjur up these formations measured over a period of 17-trading days when the minimum requirements are 6 to 8 calendar weeks. My favorite saying is “When you have a good concept, milk it.” Of course one cannot expect the same degree of confidence when measured in days, but beggars can’t be choosers so you work with what the market gives you.
Why do I bring this up? It is the difference between a long term buy and hold Type 4 Investor or for that matter even a Type 3 Swing Trader. However, if one sits for the perfect set up which most would also suggest requires Leading Stocks with tight chart patterns, then it is tantamount to suggesting one is really a Type 4 and not a Type 3…you want jam on it and are not prepared to take a risk for short term rallies. It is far better that Type 3 Swing Traders not get ants in their pants and dabble, because they just don’t have the stomach to take major risk and that is fine, since we all know how difficult it is with recent intra-day volatility which I focused on in my last blog note. If you can’t stand 5% swings per day, don’t play. It goes without saying that this market is not yet at a point that is conducive to identifying tight quality stocks with the proper ERG credentials breaking out from tight bases. The charts are bent out of shape and most are beaten down.
More importantly, even the shorter term Types 1 and 2 can get guidance of how the wind is blowing, even though of necessity they sit with their hand on the buy or sell button glued to their screens. Please understand I am trying to show you techniques of how to engage in a badly oversold market and by no means am I suggesting that we are anywhere near being out of the woods.
Now let’s turn our attention to the good news on why this fledgling Santa Claus Rally is showing signs of gaining legs. I have tipped my hat several times to a combined effort by those who are both familiar with CAN SLIM and HGS Investor concepts in collaborating at improving the Follow Through Day (FTD) concept by bolstering it with other Indicators including the Eureka and Coppock signals.
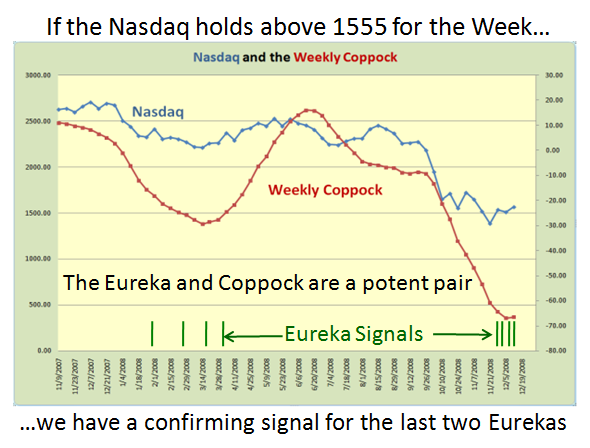
For those of you who are feint of heart on the value of the Eureka, it is once again proving that in combination with the Coppock we might have at long last found the key to calling reasonable rallies. It is far too early to say we are there yet, but the signs look good as shown above.
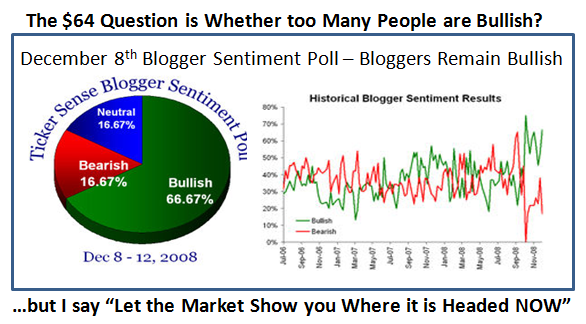
Now as you know I try to give an even handed picture, the Bears are naturally focusing on the Bullish and Bearish Sentiments which is heavily Bullish if one is to believe the Bloggers as show below. Naturally they are poised to clobber the rally, and realize that although the put/call ratio on the CBOE is neutral, it seems the situation on the DOW is slanted to the Bears with more puts by over 2:1. This can provide fuel for the bulls if the S&P 500 can get a spurt of a rally towards 950. The Bear’s day will come:
The message in a sentence is that the Bull’s now have a “cushion” with which to make the call to vacate if the market goes against them, and the Lines in the Sand are well defined. It’s Always “Your Call”.
Best Regards, Ian.
