Ian Woodward's Investing Blog

Archive for April, 2009

Stock Market Pause to Refresh or Stalling Out?
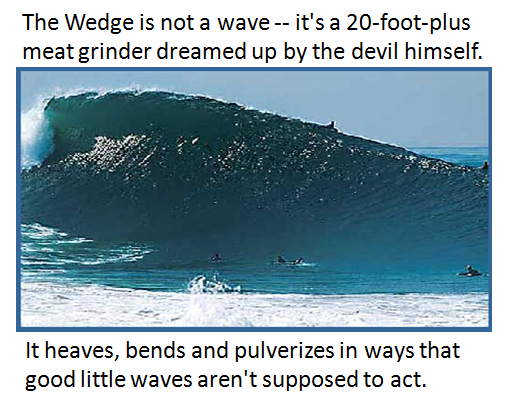
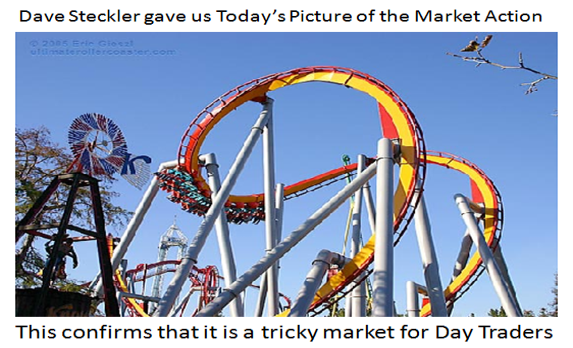
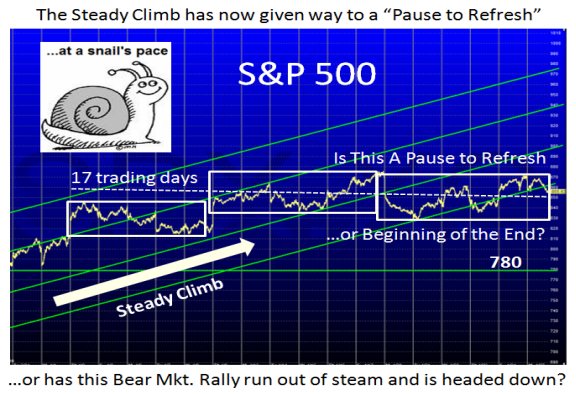
Monday, April 27th, 2009

We are at the crossroads on this Bear Market Rally.  We may be pausing to refresh but there are underlying signs of instability on the general “feel” right now.  A good friend of ours, Dave Steckler, gave the HighGrowthStock Investors (HGSI) a picture which sums up the roller coaster action that Day Traders are experiencing:

roller

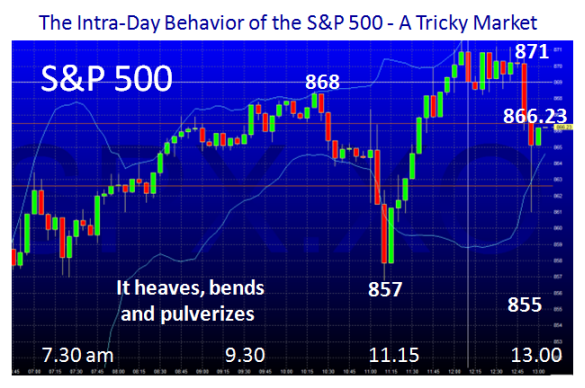
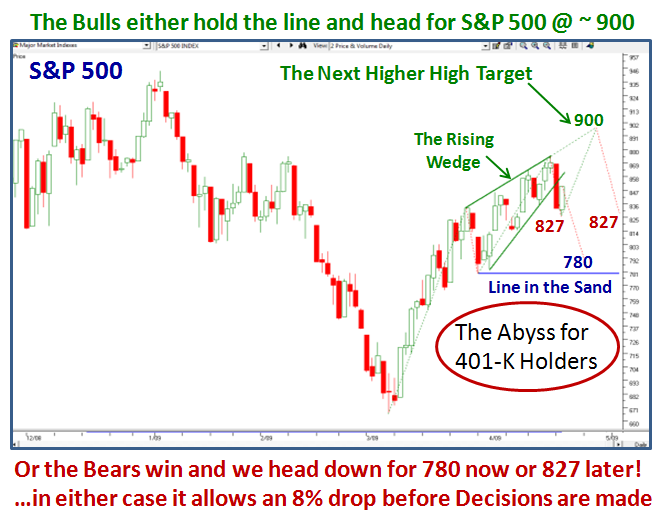
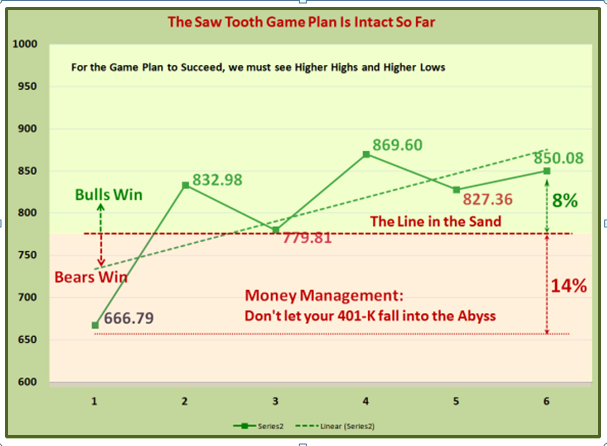
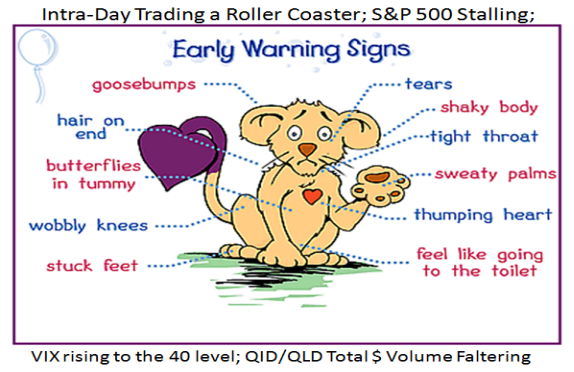
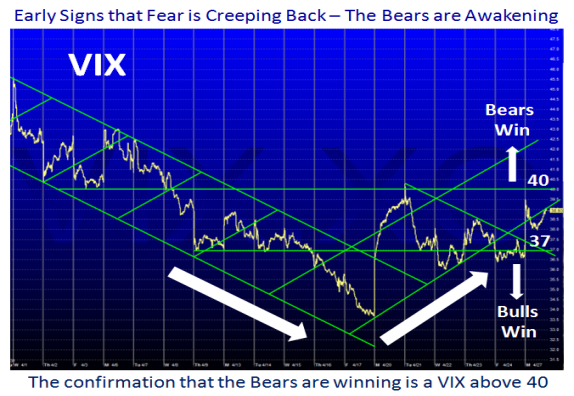
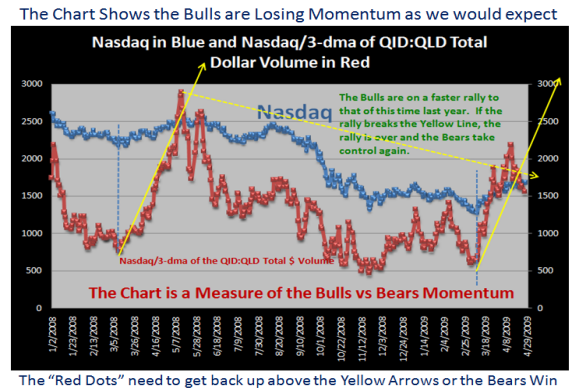
To confirm that things are in the balance at this point are three other factors that give Early Warning Signs to be on the look out for problems which I keep a beady eye on.  They are summed up by the S&P 500 stalling for this past week at the Double Top I mentioned yesterday at 875.  In addition the VIX has gradually been creeping up from a low below 34 to close to 39 these past few days, and the overall QID/QLD Bull and Bear Momentum Indicator is drooping.

early

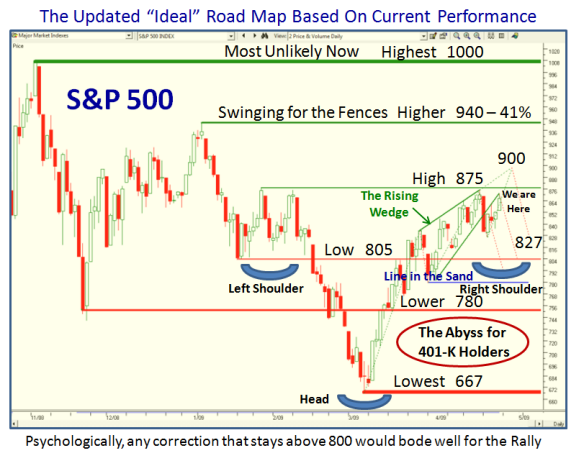
Here they are for you to digest in quick succession as the explanations are on the charts:

sandp

vix

qid

We have the potential for a very volatile week with both good and bad news.  Wednesday has two big ticket items…the 100 day Presidential reign which should be a positive event, and the release of the GDP.  Numbers are as drastic as a 7% drop while a few see a drop of only 3%.  If it is a big number that would give cause for concern to the downside, but if it is less than expected, the “green shoot” optimists may try to push the rally into overdrive which can help regain the momentum to the upside.  It goes without saying that the swine flu potential epidemic is also troubling, but seems to be contained for now.  Be aware we are still on a rally until further notice.  This note is to alert you to be on your toes.

Best Regards, Ian.

This S&P 500 Wedge is a Meat Grinder!

Sunday, April 26th, 2009

Sometimes the Stock Market can do funny things to the best of Technicians, especially when it is so skittish and entirely event driven.   There seems to be a temporary air of good feeling which is taking earnings in its stride, as corporate America so far has cleared the low bar set by Wall Street.  Also, after falling at a 6.3% annualized pace in the fourth quarter, a 5.1% decline for first-quarter GDP was the median forecast of economists surveyed.  “Despite the massive contraction in the economy, the expected composition of first-quarter GDP should show encouraging signs,” wrote economists for Credit Suisse.

It would seem we need a new definition of a Wedge, and should take a leaf out of the Surfer’s book.

          wedge

The Wedge is a combination of two waves that merge together, thrusting into a titanic slingshot that breaks with enough pounds per square inch to send an Iron Man to the mat.  The Bulls are hoping for such a sling shot that will swing for the fences with at least a 41% Bear Market Rally from the low to take it to the illusive target 940 level we have talked about – the “Higher” Target.  However, before the Bulls get too carried away, there is the little problem of a double top just above Friday’s close that the Market must get above at 875.  Otherwise the pundits will be saying all is not lost for the Bears and the Market is headed for a correction should it not get past that number with authority.

The intra-day Type 1 and 2 Traders are scratching their head as they have to contend with awful zigzags as the market heaves, bends and pulverizes even the intra-day players:

Intra Day

So given all of that, here is an Updated “Ideal” Road Map which shows the alternative Targets which have come into focus.

road

The three immediate Targets for the Bulls are:

1.  Get past the Double Top at 875
2.  Drive for the reasonable follow-up to 900
3.  Then Swing for the Fences at 940, 41% up from the Base Low of 667.

The downside looks better and better with every notch higher.  It goes without saying that the Bears lick their chops the higher the market goes, but meanwhile the early birds are having to cover their shorts. 

1.  The most important psychological Target is to stay above 800, almost an 8% cushion.  That would bode well for a continuation of the current rally as the pundits will jabber about an Inverse Head and Shoulders set up for the next leg.
2.  After that, anything between 780 and 800 would be disappointing but at least gives hope.
3.  If the market breaks 780 we head down into the Abyss one more time.

Best Regards, Ian.

Shot Across the Bow Coming Back!

Tuesday, April 21st, 2009

The back and forth by the Bulls and Bears is certainly interesting.  Yesterday we had a 4% down day and today we bounced back over 2%.  So the Pirates of Penzance were foiled this time but they will be back soon.

saw

The reason I say that is that every technician has latched onto the rising wedge syndrome, a sure sign that the Market is overbought and over-reaching:

chart

Now that we had an Eureka today to counter the Phoenix of yesterday, the Bulls are still in a tenuous control, and can resume their efforts to drive for the next logical step of 900. Alternatively, Bears come roaring back and break the trend by driving the S&P 500 to the last line in the sand at 780 before there is the likelihood of further capitulation and deterioration of the 401-K’s around the country.

The cushion we now have on the downside is 8% and 14% to and from the Line in the Sand at 780 as shown below.  I cannot lay out the Game Plan any simpler:

Plan

What then is the Dark Cloud over the Market?  The Health of the S&P 500 Earnings Reports.
I laid the problem out at the Seminar and it doesn’t take any explanation.  The Pessimists
say we cannot support more than 400 to 600 on the S&P 500 – the gloom and doom scenario.
We may not get out of this problem for at least another two quarters.

competition

Meanwhile the 1937-38 Scenario is still intact for those who got the Woodward and Brown
Scenario, so keep your fingers crossed.

Best Regards, Ian.

The First Shot Across the Bow

Monday, April 20th, 2009

We have enjoyed a Bear Market Rally for 49 calendar days since the last big
down day when we had the last Phoenix signal, and we reached the High
Target of 875 as I suggested in my last couple of blog notes. As one would
expect with a -4% down day on the S&P 500, we had another Phoenix signal
today along with a small Kahuna.  This suggests that the Rally may be over
for now, but one down day does not establish a confirmed change in direction.

bow 

Unfortunately the S&P 500 broke 840 which was a critical line in the sand on
the way up, but as I have said in previous notes the cushion we have is 8%,
so we have used up half of the reserve we had to preserve the Game Plan
of Higher Highs and Higher Lows.  That will truly be broken when we reach
below 780, and those type 3 swing trader’s who nibbled should certainly have
taken some action to lighten up and preserve capital by then:

S&P

I’m sure most of you will recall a similar chart I provided four months ago
showing the critical lines in the sand.  The message is that we are back to
square one.  However, I am sure you will find that your 401-K is less now than
then, so this should be a lesson in Money Management that if we break 780
again, you are playing snakes and ladders with your hard earned money.

santa

All is not gloom and doom as yet…after all we have had only one bad day, and
the following chart gives you the perspective.  As you can see we show a
Phoenix and a Little Kahuna to the downside based on today’s action, and the
S&P 500 Index is sitting right at the 100-dma and 17-dma averages for support.

phoenix

If it breaks that support in follow through action, we head down for the 50-dma
blue line as shown on the chart.  The challenge for the Bulls is to stop the
bleeding and hopefully produce an Inverse head and shoulders pattern that
then gives a chance for another run up on the Bear Market Rally.  This week’s
action should unfold where we stand for the future health of this rally.

Best regards, Ian.

A Follow up to the Centipede Note

Thursday, April 16th, 2009

I know in this day and age, people are in a hurry and don’t remember to read the comments section at the bottom of each blog note.  Kevin (all the way from the Middle East) wrote a great reminder to me and although I have answered him there, I felt it important to put it here as well to ensure there is no misinterpretation or over optimism on my part in your minds.  In my hurry to not be redundant with the information in the Newsletter, I didn’t give full treatment to the downside scenario, so here it is:

Kevin Says:

Ian,

Thanks for the timely post. So you are not concerned about the volume falling off or the slope of the price line starting to flatten out? Of course, if I stare hard enough, I can see the 50 DMA has just turned up…, but we are a long way from penetrating the long-term DTL.

Hi Kevin:  Sure, we must always be concerned when a rally is a trifle long in the tooth, and it begins to curl over with volume drying up.  The Newsletter covered all the bases on three different scenarios, so I did not want to be redundant on the “if’s, and’s and but’s”.

But then again all great climbers must pause to refresh, so that a little droopiness is sometimes good before a rally gets a second wind.  Please also realize that last week was a short week with many taking a well deserved holiday in Hawaii or the Hamptons. 

Maybe I should have spent more time on the downside to give a balanced view on where my head is at.  I did that in the Newsletter.  So here it is:

The way to look at the situation is that any point higher than we are at now is gravy, and provides more assurance that we can withstand greater than an 8% correction the higher we go.  My sites are only on the “High Target” as I mentioned on the bottom of the chart, so that 875 only gets us to 31% up from the Base Low, which is hardly reaching for the fences as the other two targets suggest.  It is most unlikely that the DTL 405 Freeway Line which is the Highest Target of over 1000 will be reached on this round without a correction.  However, keep 940 and 1000 in mind for later challenges.

The more important point is what is the ultimate extent of the cushion on the way down, and can it portend to produce an INVERSE Head and Shoulders when all is said and done to set us up for the second true leg of the move back to recovery?  If this rally peters out today, the best we can hope for is to arrest the drop to 8% down to maintain an intact Saw Tooth Plan.

One last point in the scheme of things is the question of defining psychological barriers:

a. 800 on the S&P is #1. We need 875 to hold an 8% drop above that.
b. 8% down is #2, which is the 77% rule of all S&P 500 corrections.
c. 780 is #3 to hold the Saw Tooth alive and to give any hope of an Inverse Head and Shoulders set up for the future.  All the talking heads will be covering that point if and when it arrives.

After that, throw in the towel and run for the hills.

Best Regards, Ian.

Copyright © 2007-2010 Ian Woodward
Disclaimer: Commentaries on this Blog are not to be construed as recommendations to buy or sell the market and/or specific securites. The consumer of the information is responsible for their own investment decisions.