 Ian Woodward's Investing Blog
This Bear Market Rally Has Legs!
The airwaves are full of the fact that this has been the best four week stretch since 1933. The big question is having delivered over 25% how far can it go?

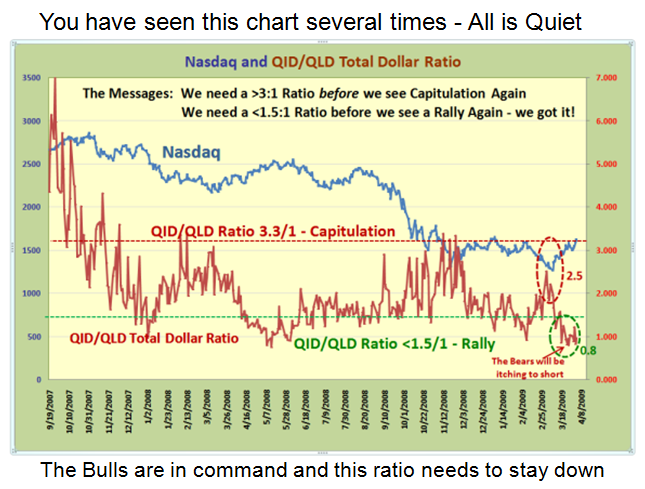
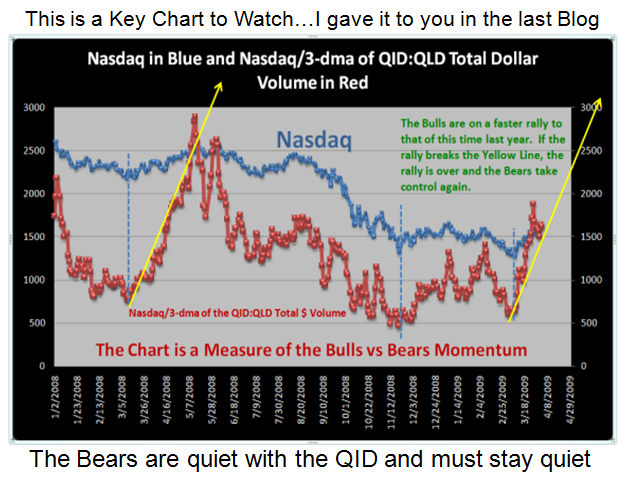
Since I have been a big QID and QLD Watcher, the factors I have developed to understand the thrust of the Bears and Bulls suggest that the Bears are on their heels for now and have gone a trifle quiet, while the Bulls are flexing their muscles and keeping the ratio of the QID/QLD Total Dollar Volume down to numbers <1.0 and as low as 0.8…not seen before. So the contrarian view is that the Bears will soon be itching to short.
Better yet, the new beast I have come up with is a decent measure of the thrust of the
rally and as you can see the slope of the rally is still intact. As long as the red dots stay to
the left of the Yellow Arrow, the rally continues. if it breaks it significantly to the downside
as it did in May last year, then the rally will be over for now.
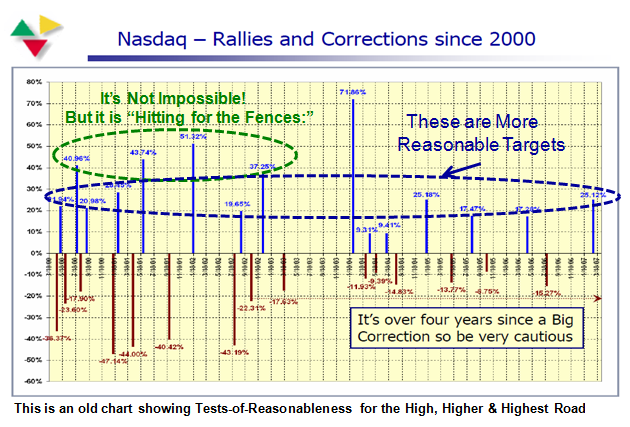
Of course, the $64 question is how far can this particular rally go? Nobody knows, but for
sure we can set yardsticks for what would seem to be reasonable based on past statistics.
The chart below suggests that 17% to 30% are reasonable targets, but that given a major
rally one can aspire to as much as 38% to 50% as seen in the chart. In this heavily skittish
market that may be a tall order, but realize that the first hurdle has already been
accomplished.
So let’s see what might be reasonable Targets given that the Nasdaq had a breakaway gap
two days ago which bodes well for a continuation of the move…for now. Now skeptics will
immediately suggest that gaps are usually filled, so of course we must be on our toes that
the tide doesn’t turn sharply, so here are the High, Higher and Highest Roads for the S&P 500 and the Nasdaq, respectively.
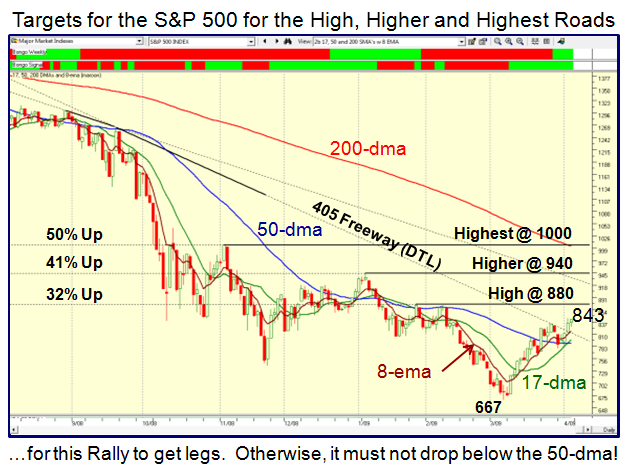
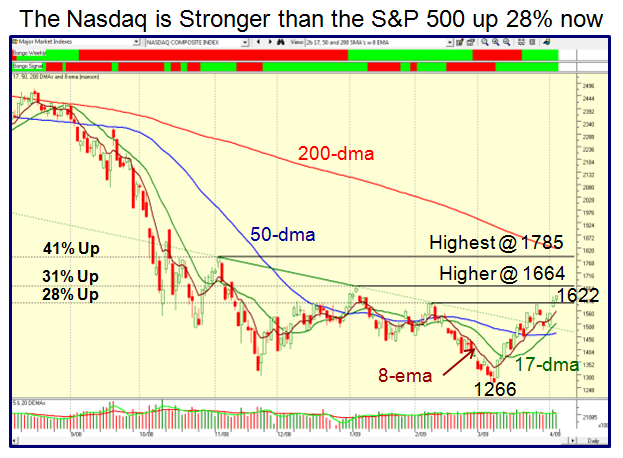
On the downside, the areas of support now become straight forward:
1. The 50-dma for both Indexes at 790 and 1470 for the S&P 500 and Nasdaq, respectively
2. The critical Lines in the Sand at 741 and 1350, respectively
3. The final gasp at the Base Low of 667 and 1266, as shown on the charts. Heaven help us!
It goes without saying that the higher this Rally goes, the more the bears will be itching to
come back with their shorts. Keep an eye on the VIX. But more importantly, we must not
forget our pessimistic friends who are saying that the Earnings Reports will be due in full
force in another week for three weeks in a row, and that we will soon be in to May, when
the old adage is “Go away in May” as all will be headed for the Hamptons!
When all else fails, never forget that >8% down on the S&P 500 is a strong warning that the
gig is up, and it is time to find refuge from the wind in your face! That number is 776 which
allows for a little break below the 50-dma.
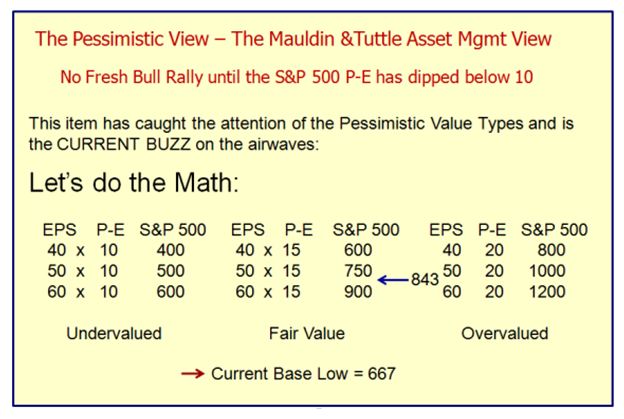
Anyway, we have our beady eyes on the Pessimists who insist we must see a P-E of 10 before we can feel comfortable that a Fresh Bull Rally is underway. Furthermore, with EPS estimates as low as 40 the gloom and doom scenario suggests we will see the S&P 500 below 600 before we are finished. I leave you to enjoy the key chart from the March Seminar relating to the Fundamentals, as shown below:
Well there you have it. I hope those who are attending Dr. Jeffrey Scott’s webinar meeting
tomorrow night will have digested this before the meeting, as this is my contribution to that
event.
Best Regards, Ian.
