A Reflection of the Market Since October
It is only fitting that I start this blog with a thought to remember our heroes on this special day for them…Memorial Day. We all have our own memories from our personal experiences, but one thing is constant and that is our admiration for the men and women in the forces that keep us safe and free.
I felt it would be worthwhile to have a reprise of the last 9 months to take stock of what we have seen happen and how we stand now in the hope of pulling out of the abyss we felt last October and November.
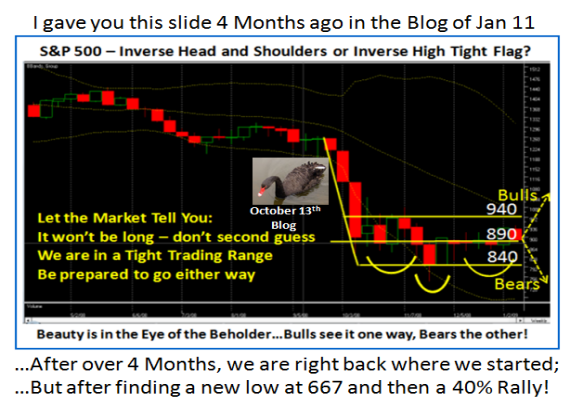
I am sure you recall the Black Swan Chart which put us at the crossroads of either heading down for an Inverse Head and Shoulders scenario or breaking out to get above 940. Note how 840 and 940 were in our sites then after the Black Swan drop had only gone down to 840. As it turned out the Bears won that round and we fell into Capitulation, Despondency and Depression to bottom out at 667 in late November.
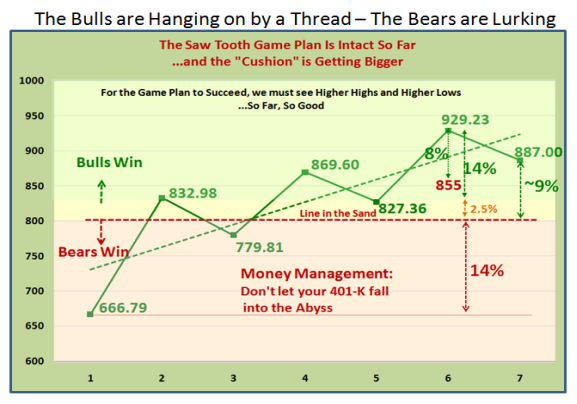
We then started the long journey back with an impressive 40% rally which focused our attention on the Saw Tooth Plan. Over the ensuing months we have grinded out higher highs and higher lows, which are essential to achieve a true Bear Market Rally with the hope to then blossom into a full Bull Rally in time, given the strong foundation.
Don’t ever forget that for it to happen the corrections, or I should say “Pullbacks”, must be no more than 8% in order for this to happen. Now we have a cushion as shown and the key number to watch for is no lower than 855 on the S&P 500. As we have discussed earlier the final line in the sand is at 800, which if broken would change the psychology of the market from Hope back to Despair. I trust you have learned a lesson that this time anything below 800 is your last chance before we again fall into Despondency.
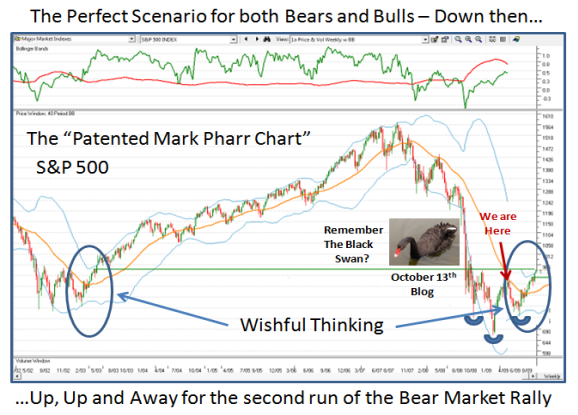
The $64 question is what next and where do we go from here? To answer that I have resorted to a chart I used back in the October 13 Blog and several times before in our seminars. This chart shows a 40 Period Bollinger Band for the S&P 500, together with the %B and Bandwidth in the upper window.
For the S&P 500 to turn the corner, the Index must get above the middle band in
Orange and then stay above it as it did in the 2003 to 2007 timeframe. To visualize
what must happen I have taken the circled piece from 2003 and placed it on today.
Of course this is “Wishful Thinking”, but until this happens and the Index stops short of heading down for a double bottom, the Inverse Head and Shoulders pattern will then be achieved and we can hope to move on up once again as we did back in 2003.
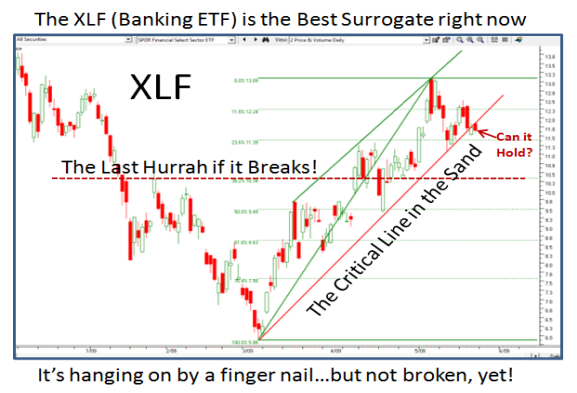
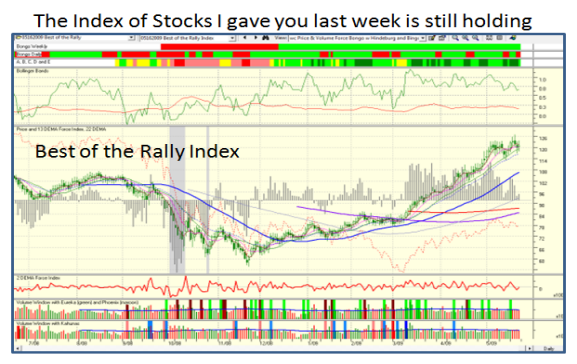
Where do we stand with regard to the items I gave you to focus on? Right below:
As you can quickly see, the charts are still intact but still in the balance. This week
should give us a better feel as to whether we trundle sideways, trot up or head down.
Enjoy your Memorial Day Holiday and do your homework for next week.
Best Regards, Ian.
 Ian Woodward's Investing Blog
