 Ian Woodward's Investing Blog
Follow the Signposts Sequel
Tuesday, September 1st, 2009Question: What chart in HGSI will show the Phoenix and the Eureka? What index/user
group? Larry
Answer: You need Major Market Indexes; then select NYSE Composite Index (though
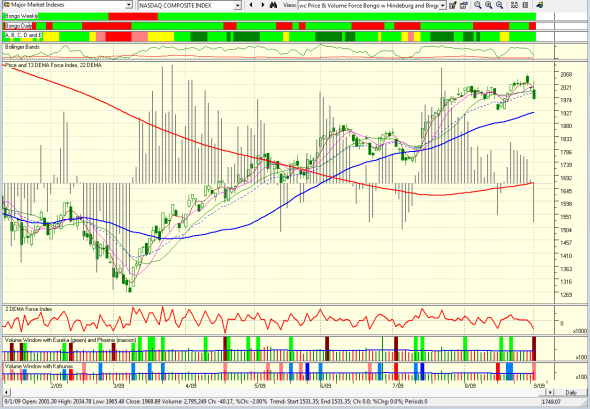
any would do, such as the Nasdaq, Dow etc) and then in the View you should select
“wc Price & Volume Force Bongo w Hindenburg and Bingo”…all you have to remember
is “wc” for “Water Closet” and you will never forget where to go. Then cast your beady
eyes down to the bottom two windows, the 2nd last has the Eureka and Phoenix and
the bottom window has the Kahunas. We have a Phoenix and a Little Kahuna red today
…bad news. I show the Nasdaq below with all the trimmings:
Question: Thanks for the answers, it is truly amazing how much info can be derived
from HGSI. So are there any indicators to look for to see confirmation of the downtrend
or is it time to move to the sidelines for a while? Larry
Answer: Larry: I don’t usually do this but let me try to give you some guidance:
1. I always start my presentations at the seminar that there are 50 stomachs in the room
and they are all different. It depends on the amount of Fear you are prepared to tolerate.
We are all guilty of erring on the side of Greed, but when the Fear sets in most are saying
“If only I coulda, shoulda, woulda got out earlier”!
2. I will get into a litany of all the things to look for lower down which you should already
know from the blog I posted last night. However, let me cut to the chase and give you just
one Golden Rule that all HGS Investors know by heart and that is there is a 77% probability
that all S&P 500 Corrections will be <8% high to low. The ones that cause the major damage
are anything larger than 8%, and you will feel the pain.
3. We have come down from a high of 1039.47 to a low of 996.28 or 4.2%…half way.
4. The 50-dma is at 956.46, which is exactly 8% down from the high! That’s your yardstick.
If it doesn’t bounce from there, watch out below.
5. I’m feeling generous, so let me focus you on several pointers that I already gave you in
the blog I put up last night. Maybe 9/10th of all the mumbo jumbo (good stuff) went over
your head, but there were several ponies in there which we call winky-winkies!
a. The best Bear Market Rally we have had since 2000 was 51%, and we have already
surpassed that with 54%, so we were on borrowed time.
b. We had the first major shot across the bow today with a 2% down day on all the Major
Market Indexes. I advised my older Son to take half off by then, which he did as his
objective is to protect the 401-K he has worked so hard for.
c. I said in the blog, we must expect an Eureka immediately to cause this market to bounce
back from a rotten day. Now that we have a Phoenix, the control has turned to the Bears.
If you don’t believe me just look at the very chart I just put up for you where the two
preceding Phoenix signals on 6/3/2009 and 7/2/2009 took us down 9% from the highs, there
were no Eurekas to support the Bulls, and the Index BROKE the 50-dma. So the expectation
is that if the tide has turned we at least will see the Index go down to testing the support at
the 50-dma.
d. If that happens, it is a given that the %B of the Bollinger Bands will be below the
Bandwidth – the green line below the red line in the 4th window down from the top on that
“wc” chart.
e. By then you will also find that the ABCDE mumbo jumbo (good stuff) would have turned to
pink if not red, the third ribbon from the top. Likewise, the (A+B)/(D+E) picture I gave you last night on the blog has dropped from 7x to 5x to 3x in the last two days. Losing Strength.
f. If that is not enough for you, then the Bongo Weekly which has been green for the past five
months will probably turn to red, and Bongo Daily will be red throughout that time, which is
where it is already.
g. If we have another 2% down day, wouldn’t it seem reasonable that you will see another
Phoenix?
h. I said in the blog that the Bears would win when the VIX was above 28. It already finished
close to its high of 29.23. I also showed you that they win “Big Time” if it gets above 30.
Watch that tomorrow.
i. The Gorilla Leaders Index will be decimated and the market will be leaderless until a new
set of groups come to the front…probably defensive such as Healthcare, Foods and the other
similar stuff that is favored at such times. It is already a hairs-breadth away from testing its
50-dma.
j. If all of that is not enough for you to take action then wait for the cacophony that follows
on the airwaves that it was inevitable. The psychology will change from ignoring any bad
news to accepting any good news as passé and will be another reason that we are going
down a lot further. By then, all will say it was painfully obvious. The Gloom and Doom Camp
will be out in full force, but watch China which is now well tied to us at the hip. The Hang
Seng is already down 1.63% as I write this and all of Asia and Far East is blood red.
If all of that has scared the pants off you, the only thing to watch for the upside is an Eureka,
which can only come if the market decides it is too oversold and the Bulls come rushing in.
Of course the perennial-bears will be rubbing their hands to catch the bulls in a trap, as they
have too often had to swallow crow by shorting this market too soon. So one Eureka is not
enough, but you need two in quick succession…why do I say that? Just look at that same chart
and you will find two on 7/13/2009 and 7/15/2009 together with a small Kahuna up to give you assurance that all was well, and the bulls were in control again. You need that same assurance.
The lesson learned is that the Proprietary Indicators in the HGSI Software give you the
Signposts to stay on the right side of the market if only you trust them and use common sense
with the rules of thumb we know so well from experience over the years.
Good Luck. Ian.
