Ian Woodward's Investing Blog

Archive for September, 2009

Important Notice to October Seminar Attendees

Wednesday, September 30th, 2009

It is VERY RARE when I make an announcement on this Blog regarding HGS Investor matters, but it is important I get this  notice out to our clientele who are attending our next Seminar on October 24 to 26.  It has to do with a venue change and if it doesn’t apply to you, please ignore it.  I am sure you will understand:

Fellow HGS Investors and attendees at the October Seminar:

The Library was not able to accommodate us for all three days due to other festivities that clashed with our Seminar, but you will be pleased to learn that we have found a very suitable alternative location just 150 yards down below the Library on the same road that most of you are fully familiar with:

1.  The spacious and delightful meeting room gives us the ability to spread out
2.  It is approximately 1&1/2 times the size of the Library
3.  The seats are arm chair padded for far more comfort than before
4.  The arrangement will be four seats to each 5 foot round table, so that we don’t feel cramped
5.  We will essentially have the place all to ourselves at the weekend
6.  There is ample seating outside the meeting room and on the balcony for lunch and relaxation
7.  The audio visual provides for either two large screens or a single wall that is huge
8.  There is ample parking just above the meeting room and about 150 yards lower down the hill from the usual parking area you are so familiar with at the Library.
9.  We already have 60 total people including the HGSI Team and with another three weeks to go we can easily accommodate any late comers.  Please hurry and sign up if you intend to come.
10.  We will have all the usual amenities including wireless Internet, light dimming, heating/cooling system, sockets for all the laptops, beautiful kitchen, rest rooms, etc.
11.  It will be equally convenient to attend the dinner at Georgio’s restaurant on Saturday since we are a stone’s throw away as before.

I show directions below from the Courtyard Marriott, where most of you are staying.  One of the maps shows the relationship of this new venue with that of the Library.  The usual Landmarks of Silver Spur Road, Deep Valley Drive and Drybank Dr. are on the Map.  The location is at the RHCC Community Center, 735 Silver Spur Road.  Entrance to the Parking Lot is either on Roxco Dr. or Deep Valley Drive.

map 1

map 2

map 3

Best Regards, Ian.

The High Jump Indicator to the Rescue!

Thursday, September 24th, 2009

High

You can’t say I didn’t give you enough warning in the newsletter and on this blog.
I have repeatedly shown you the value of the High Jump Indicator and once again
it has turned up trumps.  I explained in the Newsletter that the Nasdaq had not
exceeded 24% from its 200-dma since 2003 and then only four times at that.  I
also said that we were about to break 25% and if it did we would either swoon and
Pause to Refresh, or head into a Climax Run.  Well it peaked yesterday, and as the
pundits have said it was a classic reversal day and there is a follow through to the
downside again today.

For Posterity sake, so that you can review the bidding at a future date to know how and when to use this technique, I give you the Targets and Results at the Peak, and you can see it hit them spot on for the DOW and the S&P 500, and overshot less than 1.5% for the Nasdaq, NDX and NYSE:

ss

You might ask “Is that the end of using the High Jump for this round?”  The answer
is “No”, but instead of focusing on the 200-dma as the next HIGHER target, you will
need to use the 50-dma and/or the 17-dma to figure out the next levels, should
the Market decide to go higher.  I will show you how at the upcoming seminar, so
that is something to look forward to.

The  two views of “The News & Plan in a Nutshell” and the “Saw Tooth Game Plan”
from the last blog are still fresh as a daisy, so review them and I won’t repeat them.
For completeness I show what transpired with the VIX today and you need to keep a  beady eye on this chart to see if it heads up to 28 like a rocket or subsides back into its shell as the momentary Fear turns into Complacency again.

VIX 6

Understand the action in the last hour yesterday and all of today says this was a
warning shot across the bow and you need to be on guard. 

This view of the VIX was taken at 10.20 am Pacific Time.

Best Regards, Ian.

But…Is the Stock Market In Nose Bleed Territory?

Sunday, September 20th, 2009

Camp Sunshine is rubbing their hands with glee and they can do no wrong as they see their 401-Kegs turn again to 401-K’s almost 12 months later.  (For those who haven’t been regular visitors to this blog, please take a moment to have a laugh and scroll down to my Blog Note of Monday, October 6th, 2008.  Better yet, just type in 401-Keg in the Search Window and enjoy).  I had nearly 27,000 hits that month and it went around the world for a “relief humor” joke in what then turned out to be panic times with a Black Swan soon thereafter.  On the other hand Camp Gloom and Doom is waiting patiently for this Market to get into Nose Bleed Territory as they have been thwarted several times along the way, and are now licking their chops to “bring it on”…albeit one more time!

nose

As followers of Ron and my efforts know we keep you informed with a balanced picture, we are not Soothsayers; but use Commonsense and the HGSI Software with its plethora of Proprietary Indicators to let the Market tell us where it is headed.  Furthermore, we let our respective Weekly Movies and Blog Notes do the walking for our talking.  Likewise, we don’t trumpet our wares very often, but this is a reminder of what you will get at the HGS Investor Seminar from October 24 to 26, and you have just five weeks to hurry, hurry, hurry for the last few seats!   Here is just a taste of what the attendees will be getting with several winky-winkies as well:

black swan

What was a calamity a year ago, has now turned out to be a Blessing as this Market has risen 61% for the S&P 500 from the Base Low of 667 last year.  The Black Swan is something few of us have experienced except the quick Knee Jerk back in 1987, until we go back to the Deep Depression of the 1930’s.  Oddly enough it has produced Opportunity in a cussid sort of way.  I refer you to the August Newsletter Picture of the Black and White Swan showing that that mighty fall of two weeks produced a Vaccum in Volume at that stage which spelt Future Opportunity when we got back to 1000 on the way back up.  The Message then was “In this Crazy Market, don’t count out a return to 1200 on the S&P 500.”  That would be an 80% gain!

Now hold your horses:  I have not taken leave of my senses, so here is the News and Game Plan in a Nutshell.  The Chart below says it all, and in a month’s time when we are feversihly preparing for the Seminar, we will see where we stand then:

news

Here is the Saw Tooth Plan which has worked successfully for all of us since its inception at the HGS Investor Seminar last March.  By the way…we make you work with us on Case Studies on these occasions.  It’s not all Beer and Skittles:

saw

Now, let me give you two important charts for you to focus on as I busily trot off to keep working on the Seminar Material.   The first is my handy-dandy overlay chart that shows what the Nasdaq MUST DO for the Rally to continue.  That will give us a template to watch if it succeeds or fails:

2008

At this stage of events, among all the Internal factors we watch carefully, the one that will give us the earliest warning of whether we have a runaway Bull Market or are heading for a correction, be it shallow or deep is the VIX.  Its Performance these last few weeks has played right into our hands:

vix

Enjoy, and keep your powder dry. 

Best Regards, Ian.

How High the Moon? – Use High Jump Tool!

Thursday, September 10th, 2009

When there is a chorus saying “It can’t possibly go higher”, the Market confounds us and it does.  At times like these we see the gurus bringing out their trusted tools of Gann Wheels and Chart Patterns from the past such as the latest one to hit the airwaves of “Three Peaks and a Domed House”, and eventually it comes to pass.  In the meantime, the Market continues to go up, and those shorting the market find themselves having to cover time and time again.

      high

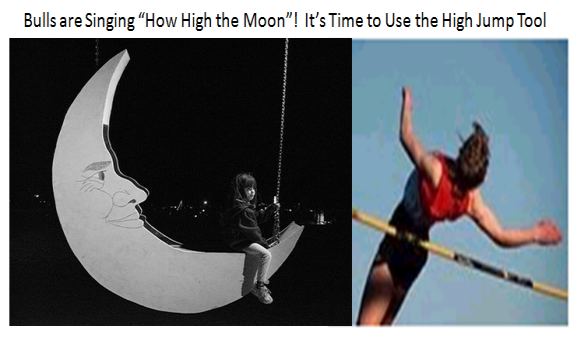
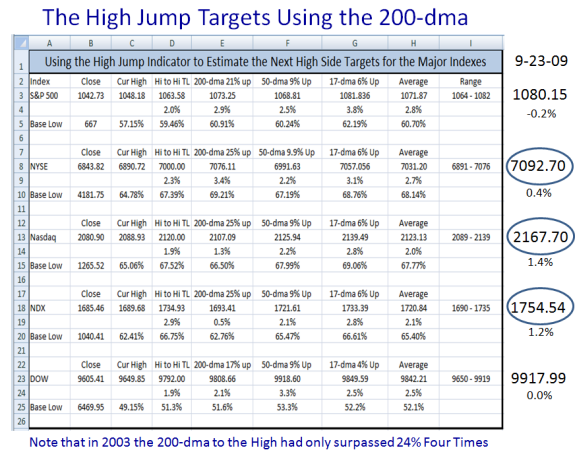
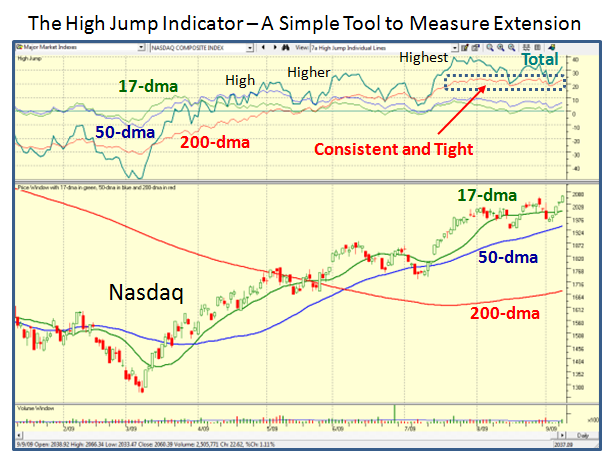
I prefer to use a simple tool which I called “The Ian High Jump Indicator” – © Ian Woodward.  The concept is to look at a panoramic picture of how the stock has behaved over time relative to the extension from the 17 Day MA, the 50 Day MA and the 200 Day MA – the very yardsticks we use to decide when to buy and sell stocks using moving average crossovers. The HGS Investor Software program (HGSI) provided by Industry Monitors incorporates this feature in its Charting Module, so it plots it for you. They also provide the individual extensions and the High Jump numbers in the Fundamental Ranking Module, so that these are all done automatically for you.

You might wonder why I call it the Ian High Jump Indicator.  If you look at a panoramic picture of any stock or any Market Index, it is an interesting fact that at certain times in a stock’s drive up from its base low, the stock or Index will invariably come to rest at the same peaks and valleys. These peaks are rarely beaten and more importantly, are at around the same level though they may be reached three or four years apart. We all know that the world record for the High Jump is 8 ft. & 1/2 in. and the chances of that being exceeded are small, except when the Olympics or World Track and Field meets occur.  In other words, they are difficult benchmarks to exceed.  The same occurs with stocks and Market Indexes when it comes to the degree of extension over the years.  They usually peter out at around the same levels; usually one can see three, which I call High, Higher and Highest.  Understand that these highs do NOT mean that the stock is about to “die”; but it does mean that the stock is about to correct. 

 nasdaq

With that introduction, here is an exercise that gives us reasonable boundaries of extension for the Nasdaq Index.

1. What is the highest jump from the 200-dma since 2000? The answer is 24.5%.

2. When did that occur?  Back in 2003 around September 18.

3. How many times did it exceed 24%?  Three times back then.

4.  How long did it consistently stay above 20%?  From 8/29/2003 to 9/23/2003 and  again from 10/3/2003 to 11/7/2003 (with just a few days below 20%) when it went from a high of 1813.82 to 1992.27 for a further gain of nearly 10%.  The bottom line is that if this market trundles along and surprises everyone, it can meander its way for another 10% up.

5.  Where is it now?  23% up on the 200-dma.

6.  How often has it exceeded 24% during this rally?  Once, on 8/28/09 when it reached 24.04%

7.  How consistent has this drive been from the 200-dma?  Since 7/23/09 it has stayed in a range of 18.47% to 24.04% (on 8/28/09), which is very consistent.

8.  If there is to be another top what should we look for?  A Total High Jump of 40%, the 200-dma over 24%; the 50-dma at 10% and the 17-dma at 6% (BETWEEN FRIENDS).  Can it go higher?  Of course, but let’s first take one small step for HGS Investors.

9.  Where does that put the Nasdaq at that time?  The 200-dma is currently at 1679.13, so 24% to 25% up from there gives us 2082 to 2099 (say 2100, between good friends).  It hit 2084 today.

10. Does that mean the Market dies there?  No, but it should correct, especially if it reaches 2100.

11. How big will the Correction be?  NOBODY Knows…don’t let fear take you out.  What does the High Jump tell you:

     a.  If it corrects to a 200-dma reading of 18.47%, it will go down to 1989, or just below its 17-dma.  I am sure you will recall that all Great Leaders rise above the 17-dma.   No panic at that stage since if it even reaches 2100 that would be about a 5% correction.

    b.  8% down would take us to 1932, which is just below the 50-dma and is currently at 1941, so just below.  Again, no biggie, but the Bears may now be in control, and out will come the hue and cry that “I told you so” and we are headed for the deep correction that the Gloom and Doom Camp have been touting for ages.

   c.  Anything worse and they are correct as the sentiment will change from Bullish to Bearish.

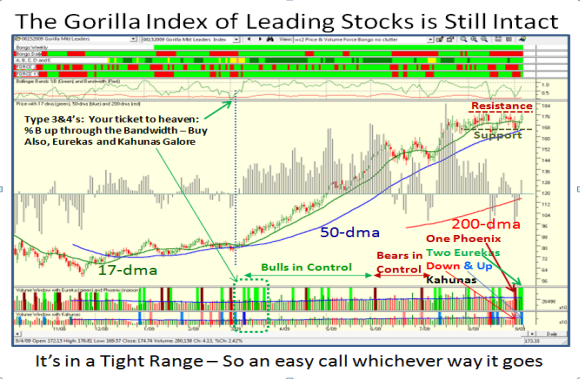
The bottom line is that there are many ways to get your arms around this beast, but at critical points in time, there is no simpler and better tool to guide you than the High Jump, WHEN THE INDEX HAS WORKED IN A TIGHT RANGE.

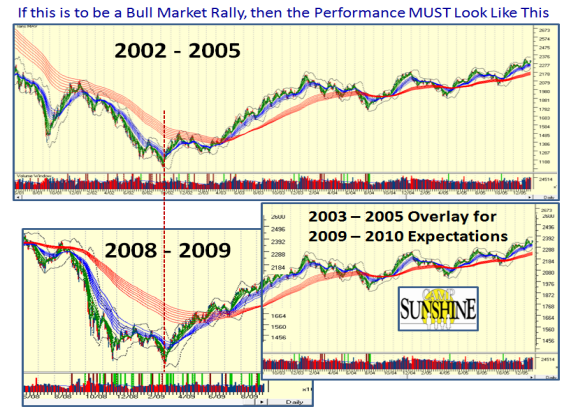
12.  Lastly, I specifically chose 2003 since that is the current best Measuring Rod.  It can go on up for three more months if that is any guide.

Where am I…In Camp Light on Your Feet for now.   It’s not difficult.

Best Regards, Ian.

One week up, the next week down!

Saturday, September 5th, 2009

How does one play a tricky market like this?  Camp “Light on your Feet” is the answer.
What does that mean?   Type 1 & 2 Traders who are used to the volatility and are very
nimble have no problem as they are adept at taking what the market will give them.
It’s the Type 3’s who are swing trader’s who are prone to suffering and the Type 4’s
who are buy and hold…they are the one’s who get a trifle frustrated, but have now
learnt that they too must be nimble.  You must have tight stops and then you put up
with the frustration or you don’t “play”.

   picture

Alright, enough of that standard stuff, but where are the signposts from this week?
We had a Phoenix after four down days so it was ripe for one to occur.  That said the
Bears were now in control.  Two days later we had an Eureka, and it was followed up
by another one the very next day…Friday, so the Bulls are back in control – until next
week!  But take a little additional comfort as there was a Kahuna or two to go along
with either the second Eureka, or the first one as well.  What does that mean?  In
these modern times it is a simple way of showing you signals of:

1.  Which Camp, Bull or Bear is currently in control?
2.  The extent of Irrational Exuberance by the Bulls (Eureka) or the Bears (Phoenix)
3.  The potential Staying Power of their exuberance by Kahunas up or down

Those of you who are interested in far more in depth methods of these simple concepts
would do well to read Value in Time by Pascal Willain, who has delved deeply into
segragating this Exuberance through Effective Volume for Large Players and Small Players.  We all struggle for being ahead of the “News” and his methods provide the trader with the breakthrough valuable tools that develop the Money Flow.  I am very impressed with the work he and his colleagues have done and I will uncover more of this at the seminar in seven week’s time.

The HGS Investor must focus on two sets of tools that the HGSI Software provides that become  part of the daily routine:

1.  The Gorilla Stocks Index established nearly three months ago on 6/15/2009
2.  The landscape of the Proprietary Indicators as exemplified by the “wc” chart
3.  The feel for where the Accumulation/Distribution stands using Ron Brown’s “Ic” key

So let’s take a look at each of these pictures in turn:

   gorilla

We know from past experience these take a long time to roll over and die, and just when
we felt they were giving up the ghost, lo and behold, they have popped their heads up
again.  I have featured this chart several times before, including providing you with the list of stocks; you have only yourself to blame if you don’t follow this Index regularly.
What’s more, if you have patience they usually provide you with substantial gains over a
short period of time…just see for yourselves; there are no tricks up my sleeve.  I have said it before and I will say it again, STEC is one of the potentially BIG Stocks of the future.  Of course, you have to buy it right and you should know how to do that by now.

   wc

There is a plethora of Bull and Bear footprints, which become second nature to those who want to take the time to read them.  It’s not difficult.  Here is this week’s lesson:

1.  A Phoenix signal after four down days, where the Bears picked up courage to short
2.  Indecision by them, which gave the Bulls encouragement to come roaring back
3.  This was evident by two Eureka signals which trumped the Bears’ control
4.  Sure volume for the Indexes were light last week, but it’s the last holiday weekend
5.  In addition cast your beady eyes on the ribbons at the top…mostly green.

However, despite the two Eurekas that trumped the Phoenix, we had a CONFIRMED high for the NYSE on 8/27/2009 of 6737.60 with a Close of 6722.31.  This conflicting situation will only be resolved this coming week if that high is taken out or the NYSE goes down once again to test the 50-dma which is at 6293.  We are currently at 6637, so we need a 100 point move and a lot more to the upside before the Bulls can really breathe a sigh of relief.  It all sounds a trifle “iffy”, but I would rather be iffy than mislead you.  It’s all too close to call so the call is “Stay Light on Your Feet”.

   Ic

I showed you a glimpse of the detailed Acc/Dist numbers for ABCDE last week, and I am sure you got the feel that we were steadily distributing all of last week.  Also, note that the Di up to Di down for the Industry Groups are even-steven at 49%:51%.  We must see a rapid improvement this week, or the Bulls will still be vulnerable showing no follow through on their part.  Net-net, stalemate and sideways until we get more news; make no bones about it, this market is totally event driven and moving up on fumes.

For the Type 3 and 4 Investors, the single most useful item to watch at this juncture is the VIX.  I gave you an excellent chart last week and give you the updated one below:

   vix

As we can see, the VIX is acting like “The Grand Old Duke of York”…he marched them up to the Top of the Hill and marched them down again.  Until it breaks one way or the other as shown we will probably meander in a trading range.

And now you know all I know for next week.

Best Regards, Ian.

Copyright © 2007-2010 Ian Woodward
Disclaimer: Commentaries on this Blog are not to be construed as recommendations to buy or sell the market and/or specific securites. The consumer of the information is responsible for their own investment decisions.