Odds for a Market Correction are Ripening
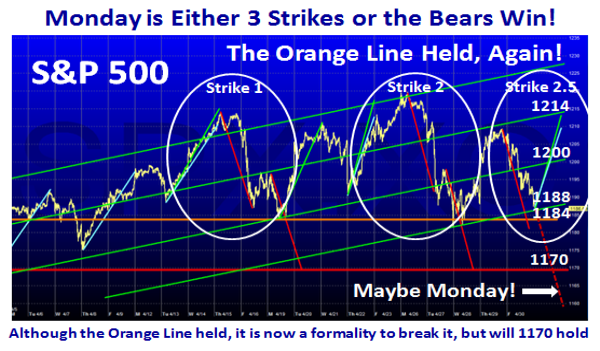
Don’t want to be that alarming, but we can be in for a Minor Correction next week to start with.
It’s in the Balance as the Bears have already had two shots across the bow, and yesterday was the first leg of the third shot. Each time so far they have been thwarted , so we shall see if they break the Rally to the downside on Monday.
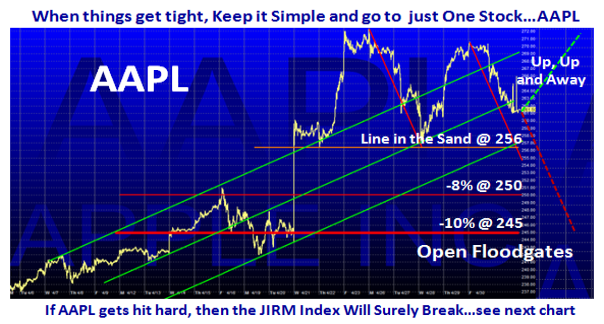
The next two charts point to the Leaders…when push comes to shove, always focus on the Leaders, and the most recognized of these is AAPL, so keep an eye on that one. It had great Earnings and produced a substantial burst to the upside. The question is whether it can hold at support or show signs of a correction to 8% and then 10% down as shown. Alternatively, if it holds, it will be a good sign for Up, Up and Away.
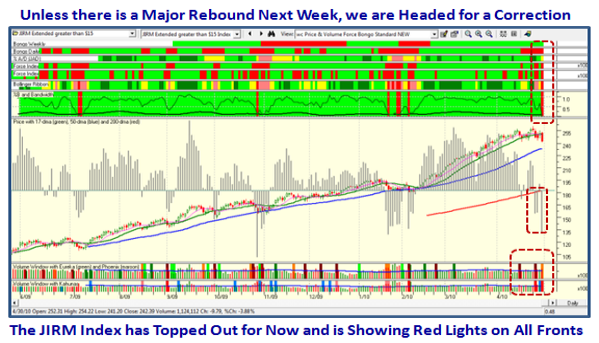
And then there is the JIRM Index which I have been featuring of late…it showed strong signs of being tired on Friday, and ominously like testing the 50-day Moving Average:
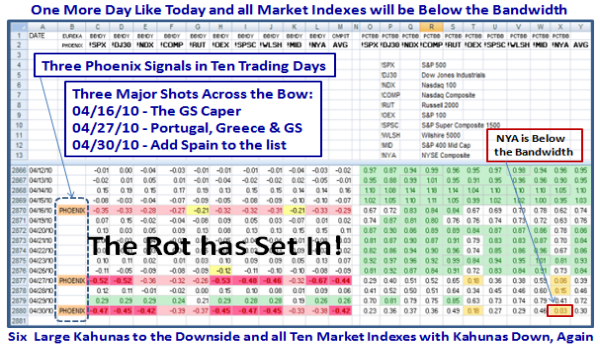
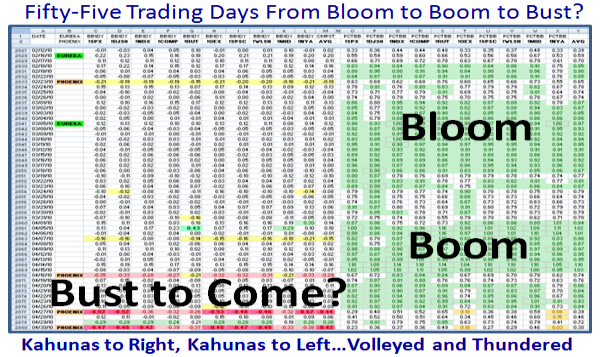
The Rot has set in with the third Phoenix in ten days and that usually suggests we are heading down for at least an 8 to 9% correction on the S&P 500. The NYSE Index is already below the BB Bandwidth, and the others do not have far more to go to join it to the downside, all currently below the middle band.
In fifty-five Trading Days we have gone from an Eureka to signal the start of a new Bloom to Boom as shown and now the question is do we now see strong signs of a Bust to come?
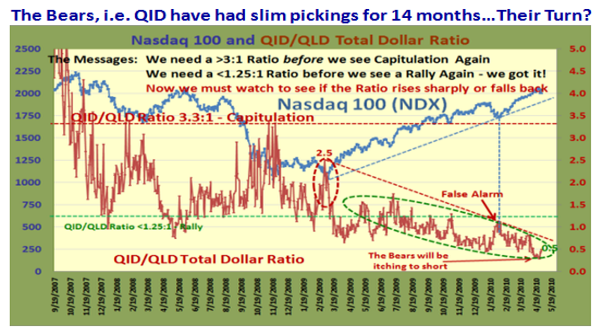
I have brought back a chart we haven’t seen in a long while as the Bears have been starved for all of 14 months as shown by the Ratio of the Total Dollar Volume between the QID and QLD. It has reached its lowest readings and the question is do the Bears now have their turn at a feast after a famine for so long.
Keep your fingers crossed and your powder dry.
Best Regards, Ian.
 Ian Woodward's Investing Blog
