Ian Woodward's Investing Blog

Archive for October, 2010

Stock Market is Stuck in the Mud

Sunday, October 31st, 2010

This Stock Market is stuck in the mud in second gear waiting for the events of this coming week:

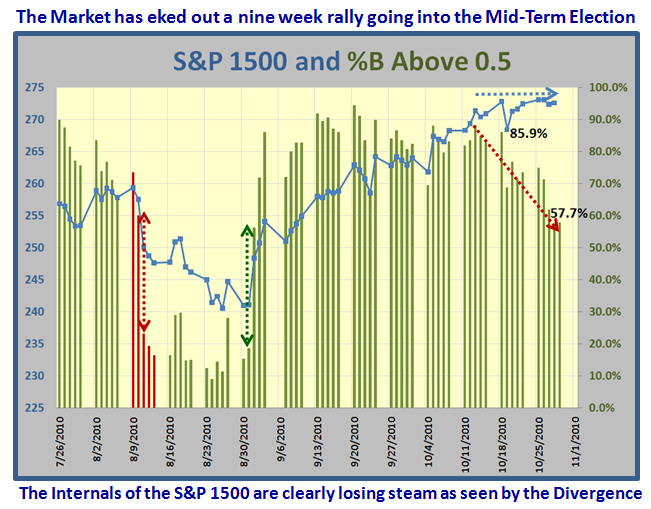
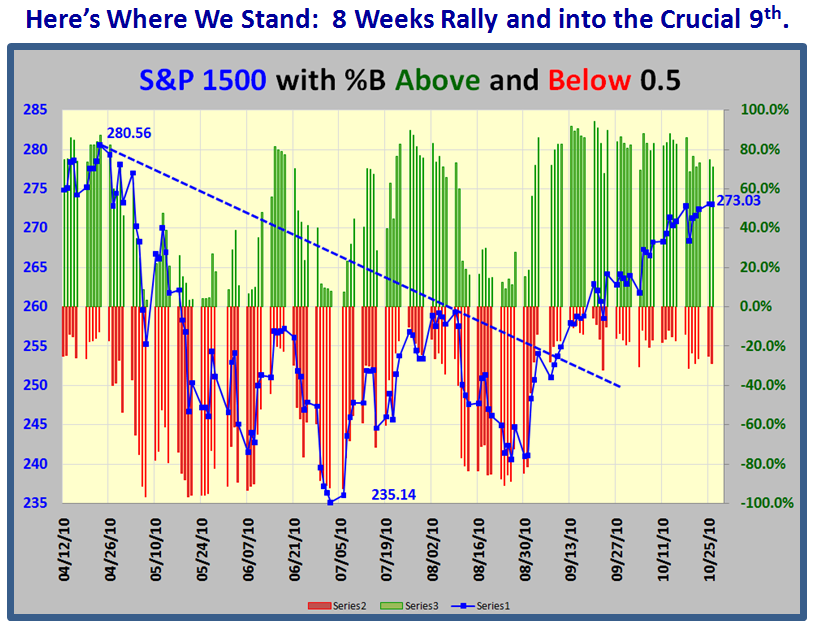
We have eked out nine weeks of a Rally, but the internals of the market as expressed by the %B  above and below the Middle Bollinger Band of 0.5 for the S&P 1500 show a major divergence at this stage.  It’s pretty obvious that the Large Caps have led the charge and that coupled with Technology including the Semiconductor Index SOX have kept this rally boyant until now.

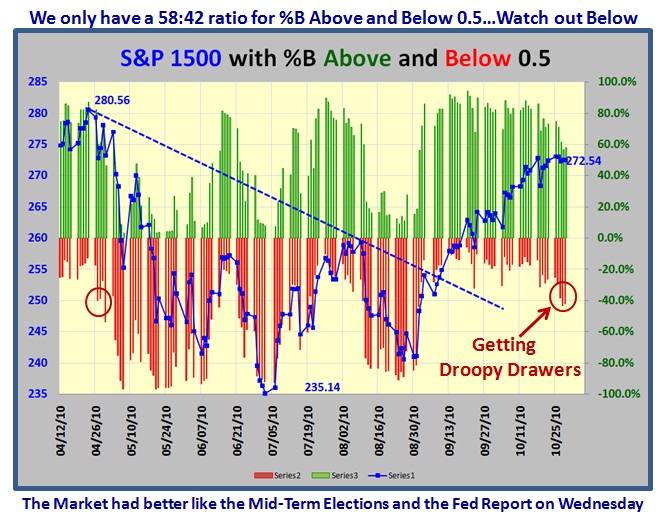
The S&P 1500 is struggling to reach a Double Top, but getting droopy drawers in the process:

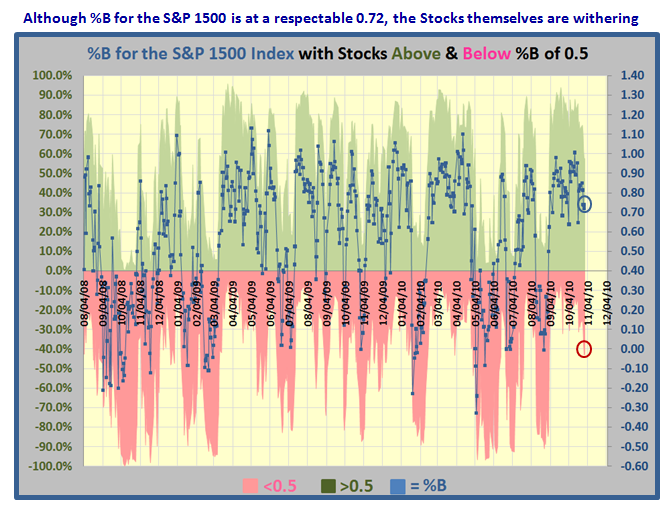
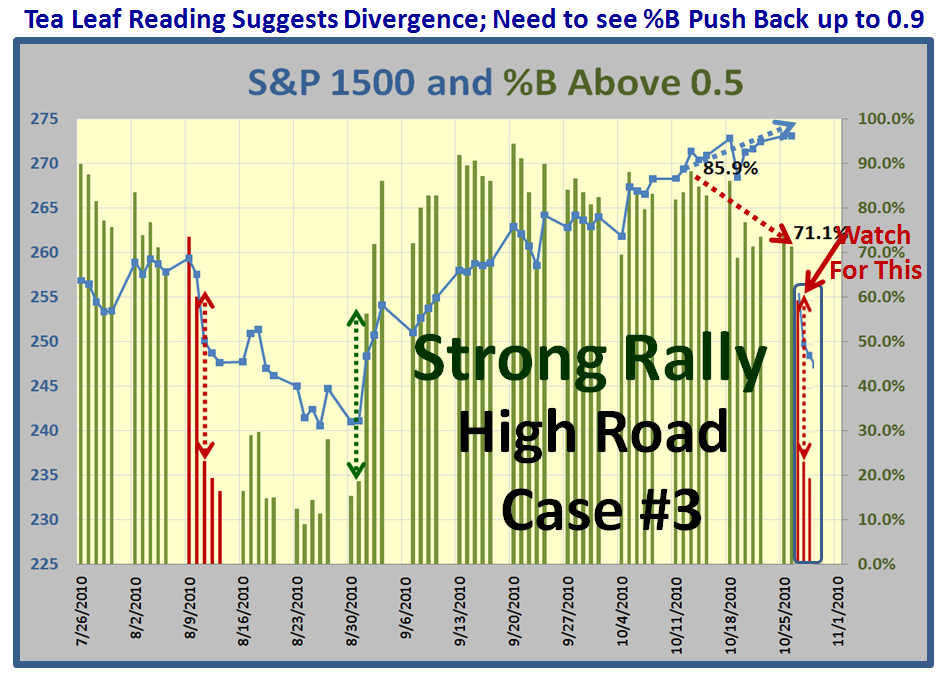
Note how the %B for the S&P 1500 Index is still at a respectable reading of 0.72, the ratio of stocks above and below the middle BB of 0.5 is decaying:

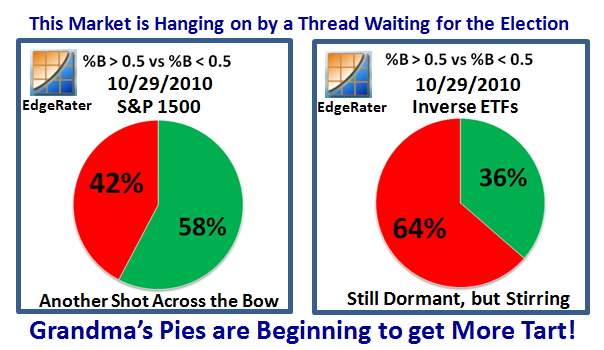
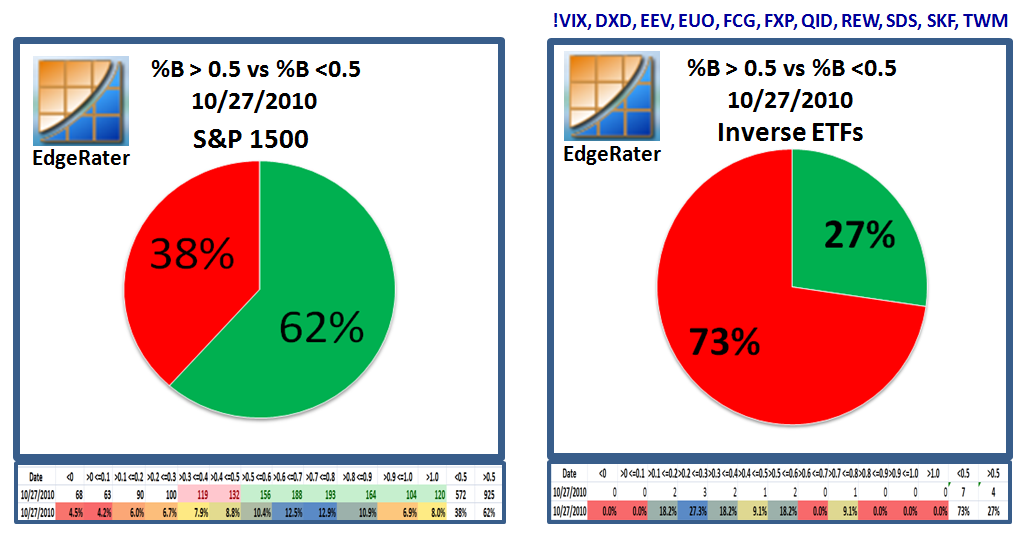
Grandma’s Pies are beginning to show a lot more red for the S&P 1500, and the Inverse ETF’s Index which I listed in my last blog note is still dormant but beginning to stir…i.e., “Green” increasing

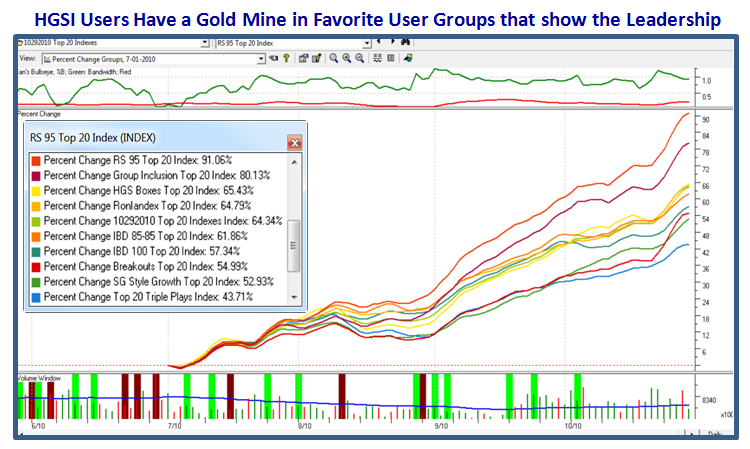
We had a great Seminar last weekend and one of the fruits of our labors was to evaluate different User Groups that showed us the Leading Stocks in the Market.  Here is that quick snapshot using the Percent Change Chart with the Start Date set at the New Base Low of 7/1/2010.  As you would expect, Relative Strength invariably leads the way:

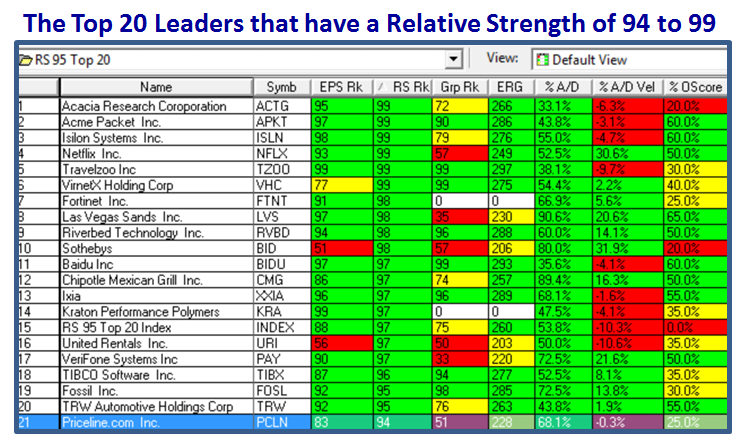
Here is a quick snapshot of the Top 20 stocks in that leading RS 95 Group:

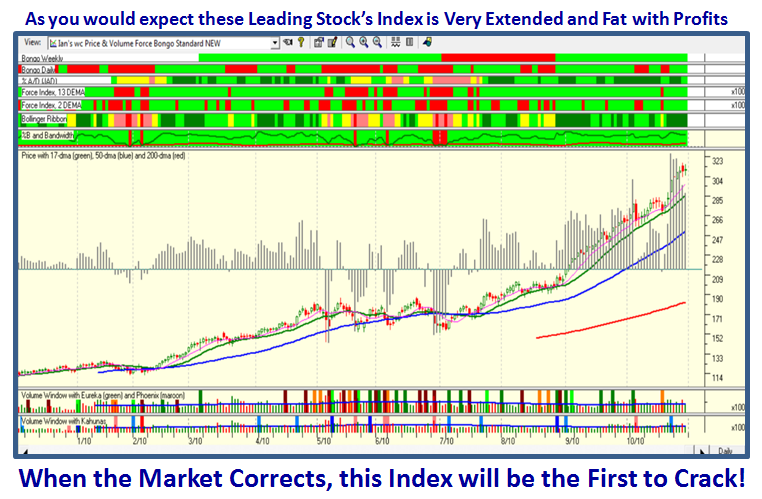
…And here is the overall Index for that Group;  Extended and Fat with Profits.  It should crack first when the market breaks:

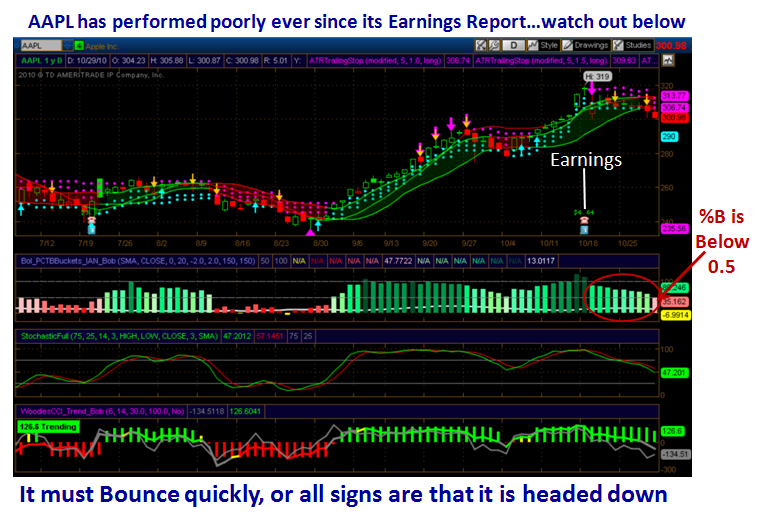
AAPL has been the Leading Stock in the market for quite some time, but since its recent Earnings Report came out it has been basing sideways with a 6% drop from Top to Bottom.  %B has been gradually deteriorating as shown on the chart to the point where it is now below 0.5, not a good sign.  It needs to Bounce quickly from this point or it will show us the way down:

And that’s My Story for Today!  It should be an interesting week to come.  Thanks to you all for your support.

Best Regards, Ian

Absence Makes the Heart Grow Fonder!

Wednesday, October 27th, 2010

I can tell from the “hits” I get on the blog that there is a faithful following that enjoy my blog, and I hope the picture below assures you that I had not forgotten you, but I was extremely busy doing the October Seminar:

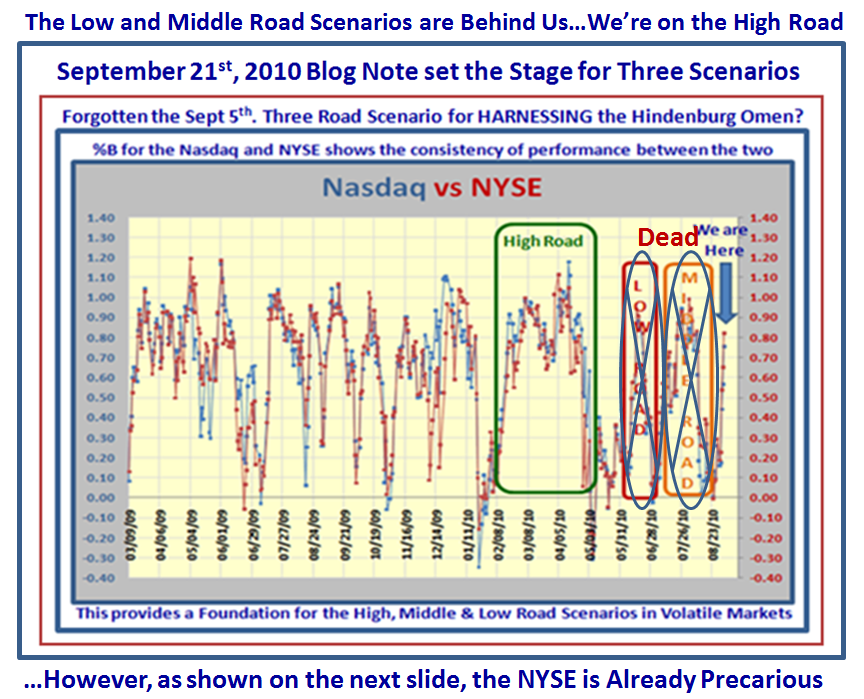
We are now less than a week away from the mid-term Election and regular visitors to this blog know that I set the stage to watch three scenarios over eight weeks ago.  We have seen both the Low and Middle Road strategies end and we are now on the last leg for the High Road Scenario:

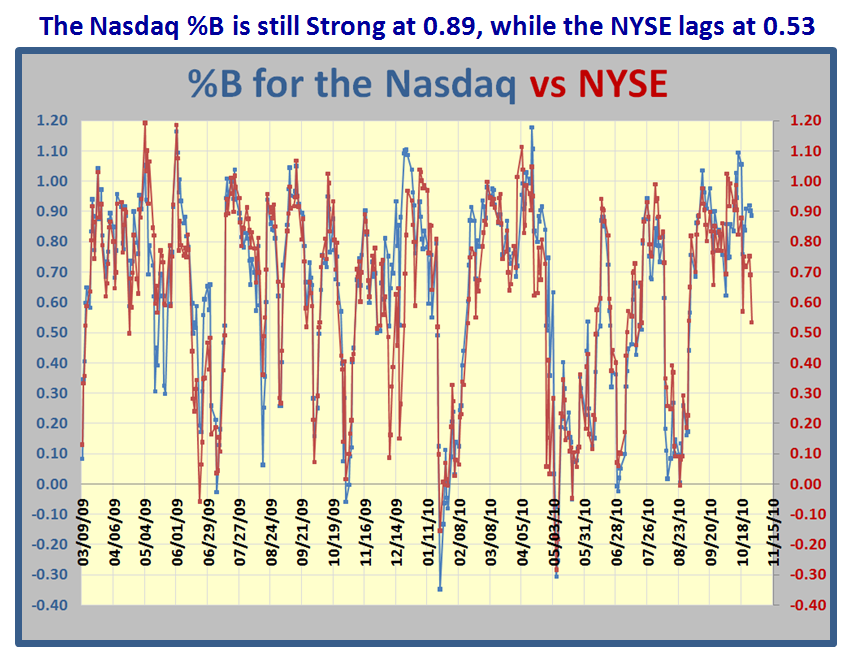
…And here is where we sit right now.  You can see that just today the NYSE is now precariously close to the Lower Middle Bollinger Band at a %B of 0.53:

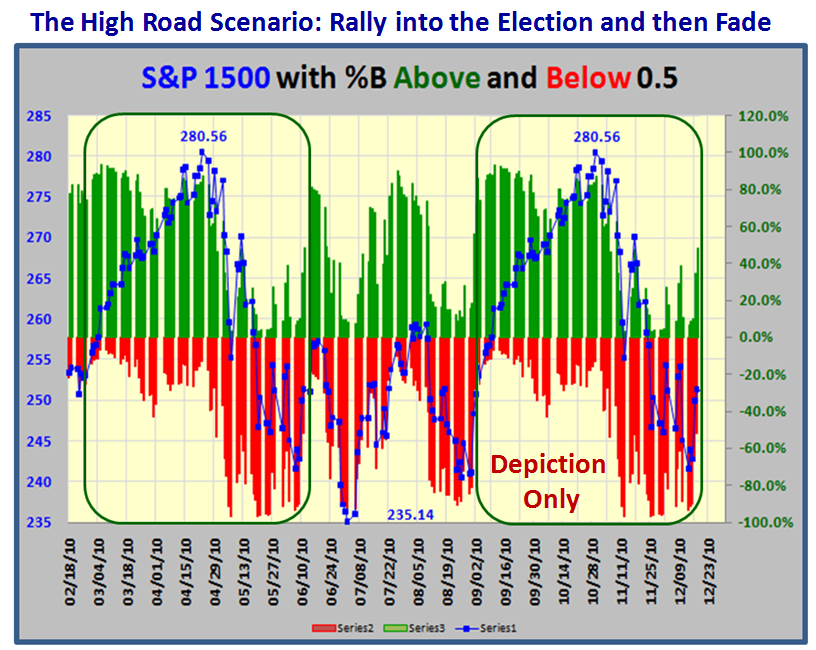
Here is the orginal “Template” for what we should expect for the High Road Scenario.  This is a depiction only, but it is important to note that the Rally was nine weeks up before it faded and that seems to be the time when things peter out.  As you can see we should fade anywhere between tomorrow and next week if it goes according to form:

…And you can see we have had a good run, though we have not reached the old high for a double top.  273.03 is last night’s number and we are currently at 272.33 for the S&P 1500:

The % of stocks above %B >0.5 is a weak 62%, so we are knocking on the door of heading down, and there is a strong possibility of a big fall in Bucket Skipping as shown below in red, unless we see a strong come back tomorrow:

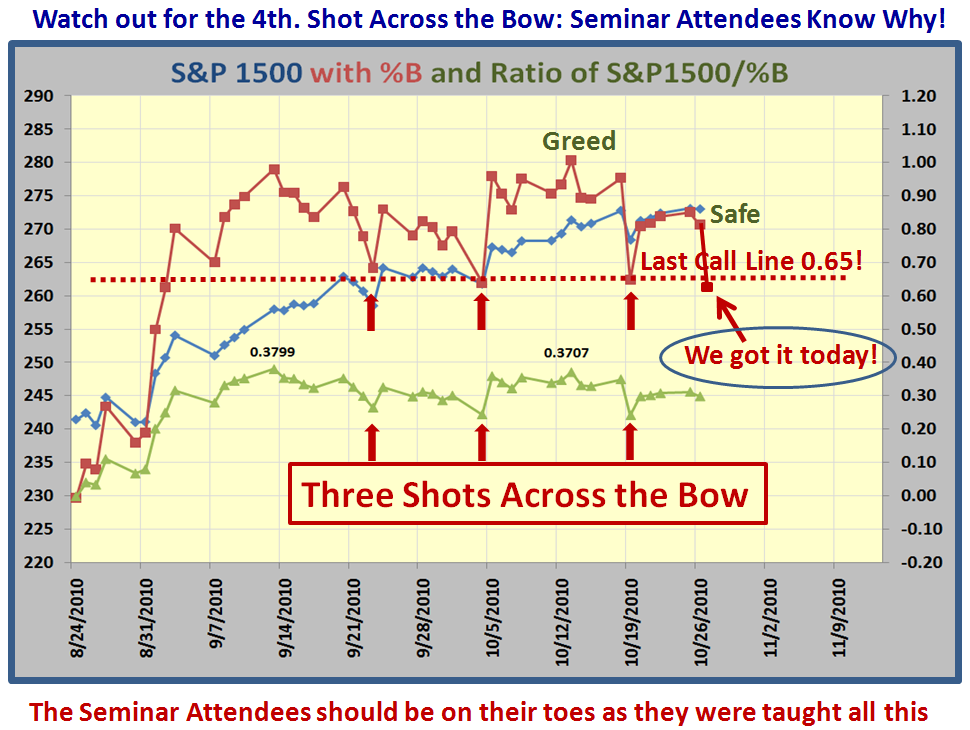
Here is the Late Breaking News from today’s action as the %B is down to 0.63, and that is on the hairy edge of falling down.  We really need a strong day tomorrow or the Bears will have a field day and we are due for a correction.  Of course we know that the Large Players are beginning to sway to the Short side, but it is not convincing yet:

One way we can tell that things are stirring to the downside is to watch how a Portfolio of Inverse Ultra Shorts along with the VIX are beginning to come off the bottom.  With sincere thanks to my good friend Chris White who is the CEO and owner of his Edgerater product, here is that picture which is worth its weight in gold:

Well there you have it; stay on your “Light Feet” and watch tomorrow’s action like a hawk.  The Bulls had better push back hard tomorrow or we head down.

Ron joins me in thanks to you all for your support and good wishes at the Seminar!

Best Regards, Ian

The Rally is Still Alive After a Shot Across the Bow

Saturday, October 9th, 2010


New Readers to my blog will need to go back and see the thread since September 5th to understand where we now stand since I suggested a Three Road Scenario for the Stock Market to take leading up to the Mid-Term Election.   As a brief reminder we had three main dark clouds over the market’s head at that time:

1.  The big fru-frau of the Hindenburg Omen raising its ugly head that had the Internet abuzz since August 12th.

2.  The second year of a Presidential Cycle is the most susceptible to Bear Market Corrections.

3.  We had 60 days or so to go to the Mid-Term Elections, which always cause concern in the Stock Market.

With that in mind I suggested that based on recent rallies which varied from a Fakey or Bull Trap of  just 10 trading days for the Low Road Scenario, to 20 days for a Middle Road Scenario, and finally as much as 40 or more trading days for the High Road Scenario would get us ultimately past all three concerns.

Two weeks ago we killed the Low Road Scenario as discussed in my blog note of September 21, and today Case 1 of the Middle Road Scenario is now officially dead and behind us as shown in the following slide:
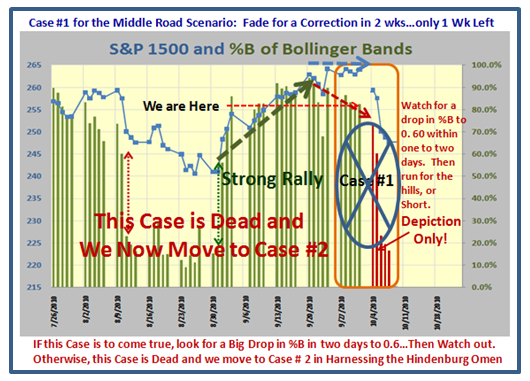
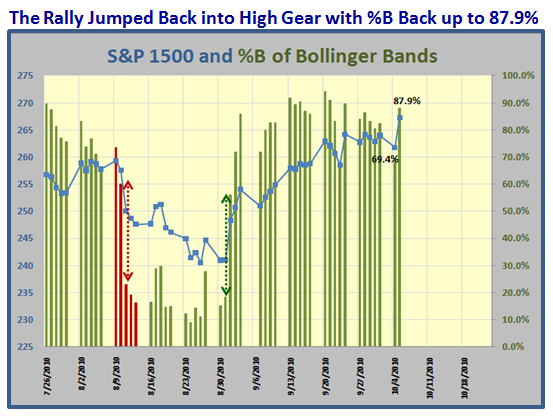
Mind you the Bears made a valiant attempt at killing the Rally just this past week on October 4th, when they provided a shot across the bow with several well known leaders getting slammed for big losses, noticeably in the Technology Arena where I pointed to the droop in the Nasdaq 100 (NDX).  Fortunately the internals of the market were still strong and in fact are getting stronger, so the Bulls came rattling back the very next day with a strong Eureka and drove all Market Indexes back above the 0.83 to 0.97 arena for %B to finish the week on a strong note.

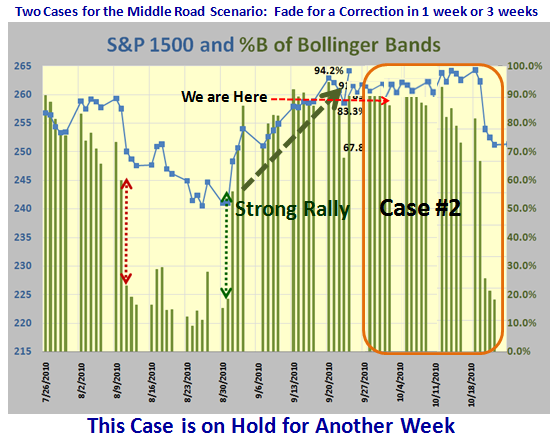
Along the way, I pointed out that Uncle Ben was dropping his leaflets again by firing up POMO, and it is painfully obvious that the Fed and the Administration will do everything in their power not to let this market slide into another deep correction until the Mid-Term Election is over.  So now we embark on Case #2 of the Middle Road Scenario which should take us into the weekend of the HGS Seminar from October 23 to 25:
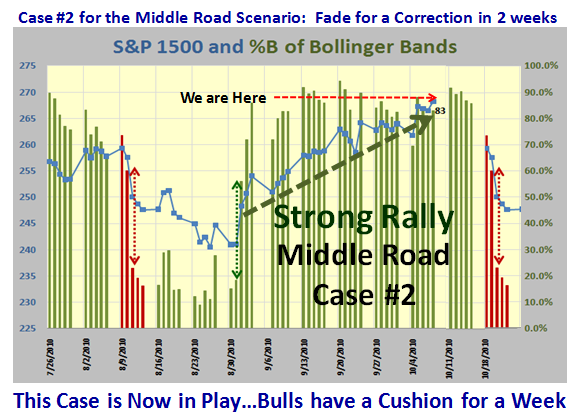
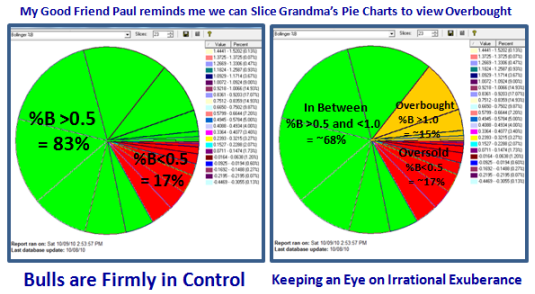
Understand that the purpose of showing this depiction is to suggest that if there is to be a correction it should happen in the next two weeks.  If  it doesn’t happen then we move into the Long Road Scenario which will take us into the Election and if that scenario holds up, then at least the concerns of all those dark clouds for an impending huge double dip before the Election will be blown away.  It so happens that the % of S&P 1500 stocks above the Middle Band of 0.5 is 83%, and my good friend Paul reminds me that it would pay to watch the overbought bucket of stocks with %B greater than 1.0 to make sure we do not get too overheated…so here is that picture:
I am sure by now that you have understood that a 1-Day reading of >300 for %B >1.0 shows strength and you need to see many of them during the course of a rally.  However, there have been three occasions in the last 20 months where %B >1.0 recorded over 500 stocks.  The measuring rod is that once that occurs, the days for the rally are numbered.  Expect the market to die within 12 to 15 days of such an event.  Building on Paul’s idea, I have developed a chart of  the number of Trading Days that each of the 5 Rallies have recorded since %B first hit 100 stocks in the >1.0 Bucket until the last time it hits 100 stocks in the same bucket.  It usually takes another 2 to 5 days to die after the trading days recorded as shown in the table, i.e., more stocks <0.5.   My point for all of this is that I repeat again this business of fast dropping %B and Bucket Skipping gives one a very quick early warning of impending major turns in the Market.  Here is that picture:
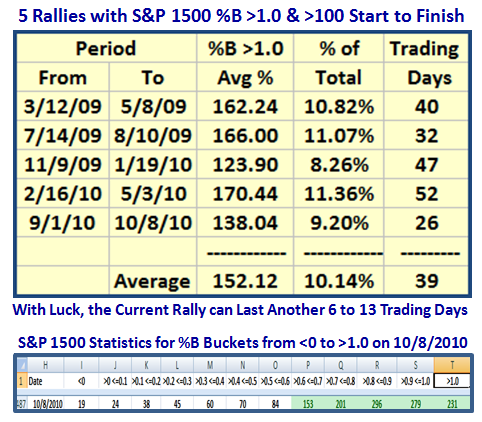
Contrary to what most believe this has been a powerful rally so far based on using the criteria I mentioned above.  During the period from September 1st to now, we see that the # of stocks in the S&P 1500 which have sat above a %B of >1.0 is 9.20% for that period of time, and it has done it in 26 trading days.  The chart also suggests that there is upside potential for the %B >1.0 to still grow 1.5% to 2.0% if the rally is to continue.  That implies we should see more occasions of hits above 300 stocks in this bucket and hopefully culminating in 500 or more.  Then we will for sure know that this market is truly overbought and it will be high time to think of serious corrections to come.   By the way, QE 2 (Quantitative Easing) or POMO (Permanent Open Market Operations) is again in full swing.   Heaven help us when that stops and rates go up, but that is a story for another day.   In the meantime, enjoy looking for the pony or ponies in this market! 

Ron and I look forward to seeing you all in a couple of week’s time.  Those who haven’t signed up yet had better shake a leg.

Best Regards, Ian.

Cock-a-doodle-doo…What a Difference a Day Makes!

Tuesday, October 5th, 2010


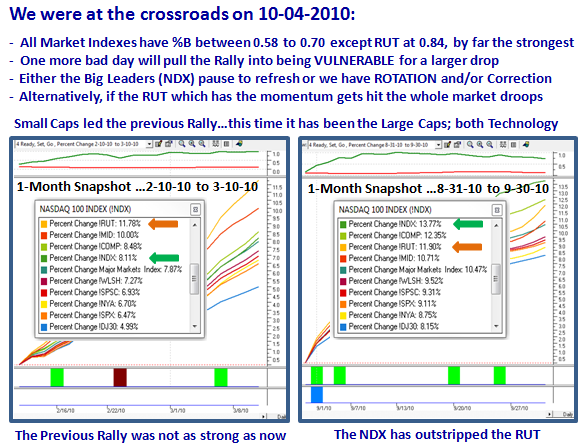
Question from Hsin who was concerned about the weakness in the NDX these past few days as shown by the %B being down at 0.58:  Does it mean the larger the drop in the NDX, the higher it bounces?

Hi Hsin:

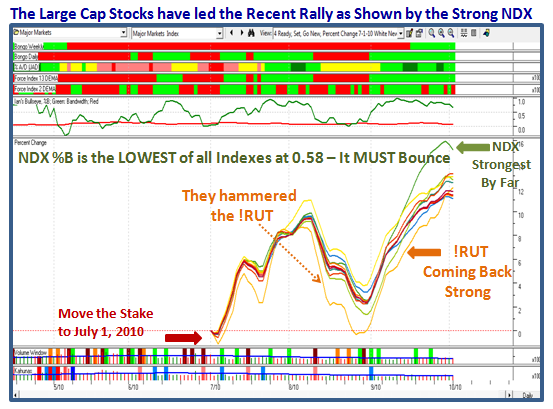
By all means watch the %B, but ALWAYS Understand “From Whence the Market Index Came”.  To illustrate what I mean you must look at the most recent Base Low (The Stake in the Ground) and the extent of the move to get perspective on whether the NDX remains the Leader, pauses to refresh, or dies and drags everything else with it:

1.  The NDX has been the leader over all the other Indexes…hence we have seen the Large Caps the dominant leaders the past month.

2.  Notice it has been hit the hardest the last three days…and so the %B is the weakest of the bunch.

3.  Therefore, it is natural that it should be the worst based on very short term measurements with %B at only 0.58.

4.  However, it is therefore at the crossroads…another bad day can throw it into the dumpster and the rot sets in.

5.  That leads to one of three scenarios:

    a.  It bounces back and gets back above 0.70 in a hurry, in which case the Rally continues

    b.  Because it was so strong it pauses to refresh further but not into the dirt (i.e, stays above 0.4ish)…the RUT picks up the leadership

    c.  It dies and the Rally is over and all markets head down…Leadership is lost

    d.  The measuring rod will be the number of Buckets the Indexes Skip from here…since most dropped at least one today.

The bottom line is watch the NDX and the RUT…If both die, this market is dead.  If the RUT stays strong there’s hope.

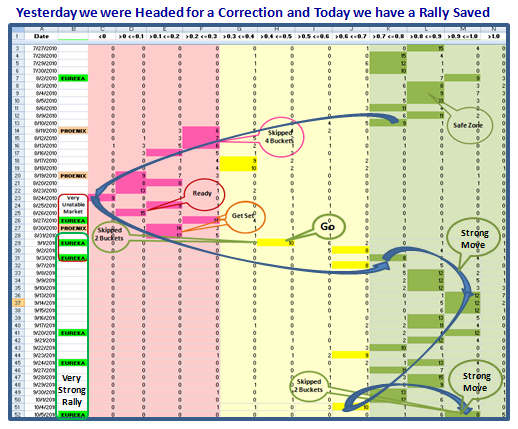
What a Difference a Day Makes…24 little hours! 

The following Charts say it all…you have seen them before and the recovery today leaves us in a strong rally:

Best Regards, Ian.

Surf’s Up on the Stock Market!

Sunday, October 3rd, 2010

This week could be critical to establish if the recent rally holds up or peters out.


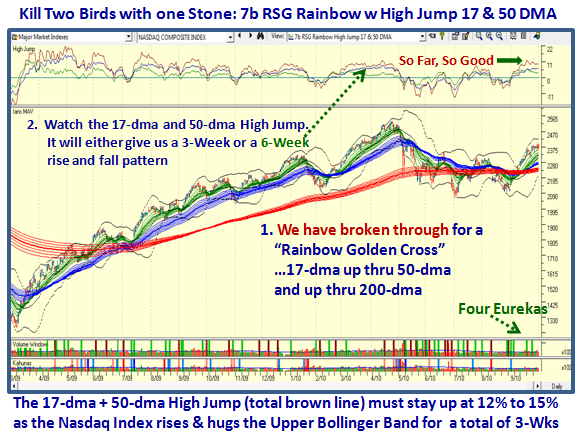
Last week I gave you plenty of fodder to watch so this week I will give you a review of where we stand and what must be achieved going ahead.  First, let’s look at the Golden Cross and High Jump Picture:

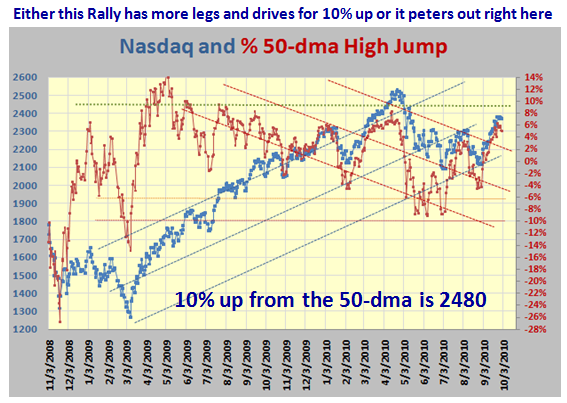
Now let’s take a closer look at the Nasdaq and 50-dma High Jump.  We can see that we are at a critical juncture.  The upside is that we could go 10% higher for the Nasdaq, which would put us at around 2480, but we are already showing signs of turning down and need a boost next week to send us higher:

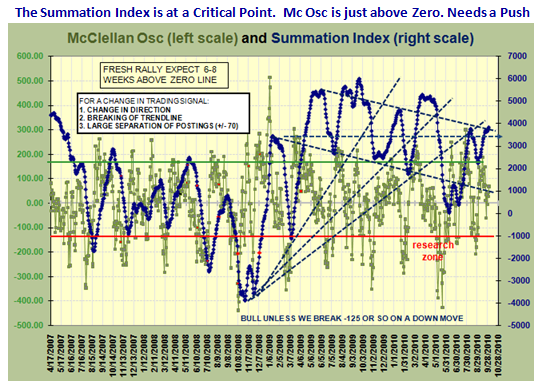
Thanks to my good friend Mike Scott, these next three slides come from his work.  The McClellan Summation Index is showing signs of fatigue and also needs a fresh push in the Mc Clellan Oscillator which is at the 68 mark, and must drive up to over 180 for comfort. 

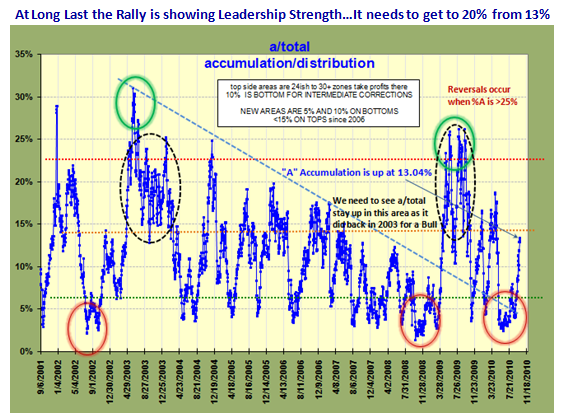
As I showed last week, this market has plenty of Leadership with High ERG Stocks leading the way.  However, I am sure you have noticed that the Nasdaq 100 (NDX) got hit this past week…I am not surprised as it has led all the Indexes since the July 1st Base Low.  None-the-less we show that the A Accumulation is now at a healthy 13% and A+B is very strong at around 62%:

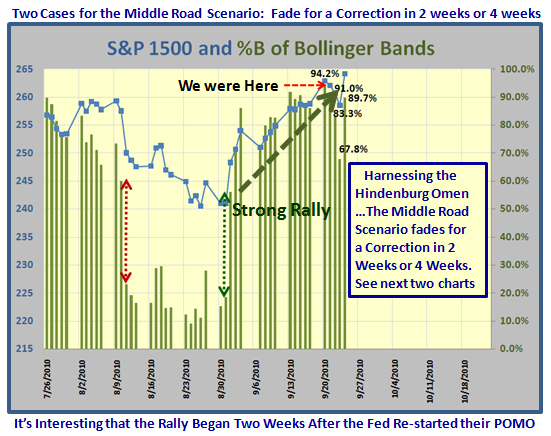
Last week I gave you two Cases to watch in the Middle Road Scenario for Harnessing the Hindenburg Omen where I am sure the Naysayers are itching to come out of their woodwork and crow “cock-a-doodle-do”.  Here is the slide to refresh your memory:

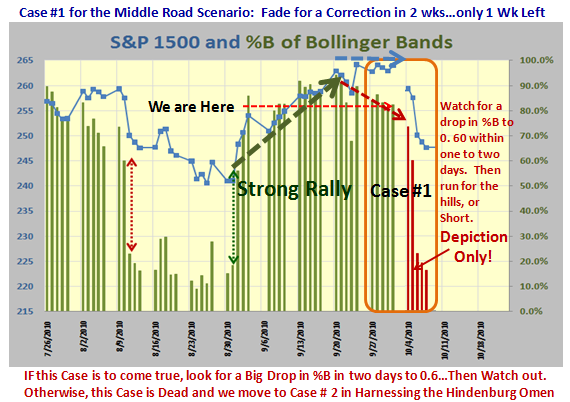
…And here is where we stand today on Case #1.  We have had a healthy week with the %B sitting up at 82% (0.82), but it has descended from its perch the previous week which reached into the low 90’s.  You will recall that we are on a Calendar Day track and this will be the critical week for Case #1 to either happen or be behind us and finished:

It doesn’t have to be at the start of the week as I have depicted, but the important point is to watch out for at least a 20 point drop in a couple of days in %B to around 0.6.  At least WE WILL HAVE AN EARLY WARNING.  If it skips buckets in doing so, watch out below as I have taught you.  In all probability it will mean the finish of the rally for now.  On the other hand if %B can stay up above at least 0.7 then we have a fighting chance that the Rally can hold for another couple of weeks.  Case #2 lies in waiting should such an event occcur:

The bottom line Message is that as long as %B of the S&P 1500 stays above 70% (0.7) and shows strength with well over 500 Stocks (33%) in the top four buckets above 0.7, the market will remain strong.   Otherwise watch out below, especially if we see skipped buckets to the downside and 500 stocks in the bottom four buckets below 0.3 for %B.  This rally will then be kapput!

Oh, by the way, Helicopter Ben is still pumping away with his Quantatative Easing (QE) or POMO as they call it, so that helps to keep the wolves at bay.  Unfortunately, it is a two edged sword and I suspect that one day we will see the dark side of all of this pumping action.

We have only three weeks to go to the seminar, so if you intend to come, hurry, hurry, hurry, but we do have seats available at this late stage.

Best Regards, Ian.

Copyright © 2007-2010 Ian Woodward
Disclaimer: Commentaries on this Blog are not to be construed as recommendations to buy or sell the market and/or specific securites. The consumer of the information is responsible for their own investment decisions.