 Ian Woodward's Investing Blog
Stock Market: Uncharted Waters for %B
What a turn up for the books when the Stock Market took off on Thursday, November 4th, 2010, a day before Guy Fawkes Day when the Brits celebrate with fireworks catching the crafty fellow just before he attempted to blow up the Houses of Parliament back in 1605! Uncle Ben flew in true to form with his POMO pumping of $600B, which drove the dollar down on that day, and shot the Market into new high ground for the moment.

As my good friend Ron Brown says “Watch the Dollar” so keep a beady eye on its direction and if it continues down so goes the Market UP! The Uncharted Waters came in the number of stocks of the S&P 1500 landing in the %B >1.0 Bucket, with a resounding 570 stocks as I discussed in earlier blog notes the last few days. Eventually we will pay the Pied Piper, but enjoy it while it lasts.

As we would expect, the Accumulation into A and B Industry Groups has risen to a healthy 70%, and there is still room to grow before we reach the danger zone of 75%:

We are now into the 11th week of this Rally, and although we suffered from droopy drawers a week ago, the Market has new life which should live for another five to ten days before we see some form of correction. Play this close to the vest but enjoy it while this rally lasts. The financials have a shot in the arm to help boost things along.

We are now into New High Territory since the Peak of the last rally and are sitting at 282.52 on the S&P 1500, with 82% of stocks above %B of 0.5:

Note that the S&P 1500 %B is ABOVE the % Stocks Above 0.5, which is a rare occurrence:

The Low Road Scenario is a Shot Across the Bow…even if there is a big knee jerk down we have a decent cushion. A one day drop of >1.5% in the Indexes should produce a Phoenix and a Little Kahuna to the downside, but one should only get nervous if the ratio of 1500 Stocks is <65:35 for %B above and below 0.5, respectively. If it drops below that level, as shown by the dashed red line, the party is over.

So let’s turn our attention to the Higher and Highest Road Scenarios, and there is no better way to estimate this than to use the High Jump Indicator. In addition, we can also use the recent statistics for when %B for the SPY reached these heights as I explained in a couple of Blog Notes ago. Here are the key numbers from that Note:

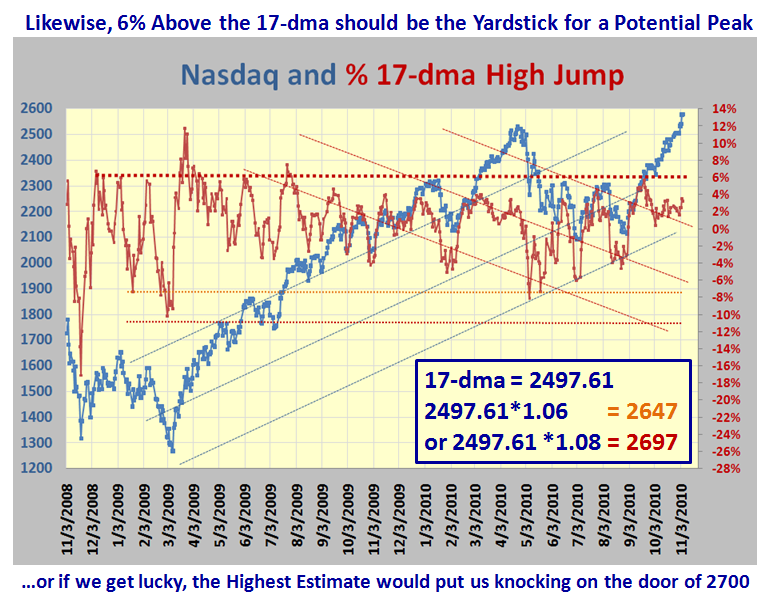
Provided the pundits try to prop this Market up, it would not surprise me if they aim for 2700 on the Nasdaq and ~1300 on the S&P 500. These are enticing round numbers which are certainly in reach for a climax run, and are not out of the equation for target setting:


Now let’s try my trusty High Jump for the Nasdaq using both the 50-dma and 17-dma:


Summarizing all of the above numbers leads us to watch 2610, 2650 and 2700 as High, Higher, and Highest on the Nasdaq. You know my sign off lines by heart now…Never fall in love with YOUR Scenario. By all means establish targets for the high and low road scenarios, since that is part of doing your homework. However, let the market tell you which one it is on.
I hope you are enjoying this new stuff on blending %B into the equation to give us a good feel for which way the wind is blowing.
Best Regards, Ian.
