Q&A on “Under the Weather”
I felt this note from Akiva was worth sharing with you as he figured out any possible confusion in the numbers for himself. The first two notes are from him and the last one with the diagram is from me, which confirms his findings. We are here to learn from each other:
Hi Ian,
Happy Christmas and a happy New Year to you and your family.
Thanks again for your continuous guidance and assistance.
Trying to follow your calculation on the first chart:
For the !SPC on the 12/08/10 it shows : 0.91 However from the lower chart: 81/ (81+19=100) = 0.81 As such the 0.91 should be 0.81?
Am I doing something wrong in my calculation? Thank you for your clarification.
Akiva
Hi Ian
Disregard please my previous message.
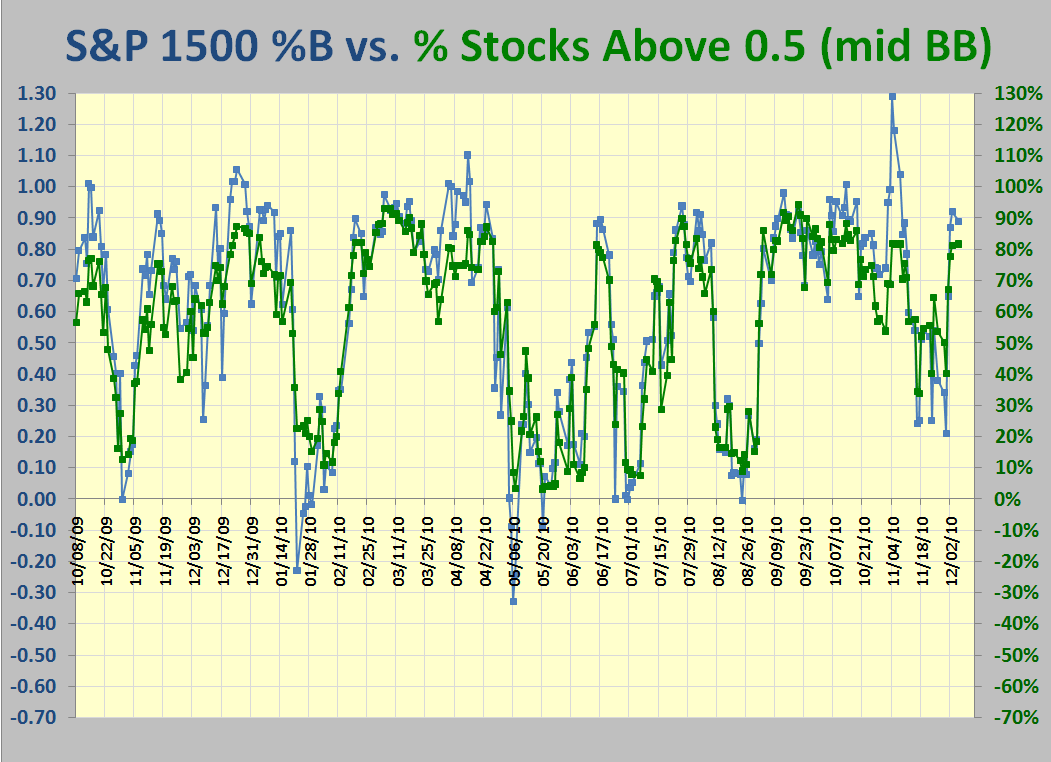
The confusion came that when speaking about %B for the S&P 1500: one is related to the Index itself position (Bollinger Bands % change) and the other is related to the HGSI calculation of “buckets” (> 0.5%)
Your “yardsticks” I assume relate all the time to the HGSI calculation only ( Disregarding what !SPSC index shows). I assume they are related somehow.
Thank you again.
Akiva
Ahhh Akiva! You figured it out for yourself…that is the best way to learn. As you have worked it out they are two separate factors. Invariably %B itself is a higher number at the peaks and valleys (above 1.0 and <0), since the other formula for % of STOCKS above or below 0.5 can ONLY go between 0% and 100%. Therefore one can watch for spikes at either end of the scale to establish when we are very overbought! See the chart below. You will also note that the “Natural” break in the chart is around 0.65…where have you heard that song before? Grandma’s Pies. Best Regards, Ian.
 Ian Woodward's Investing Blog
