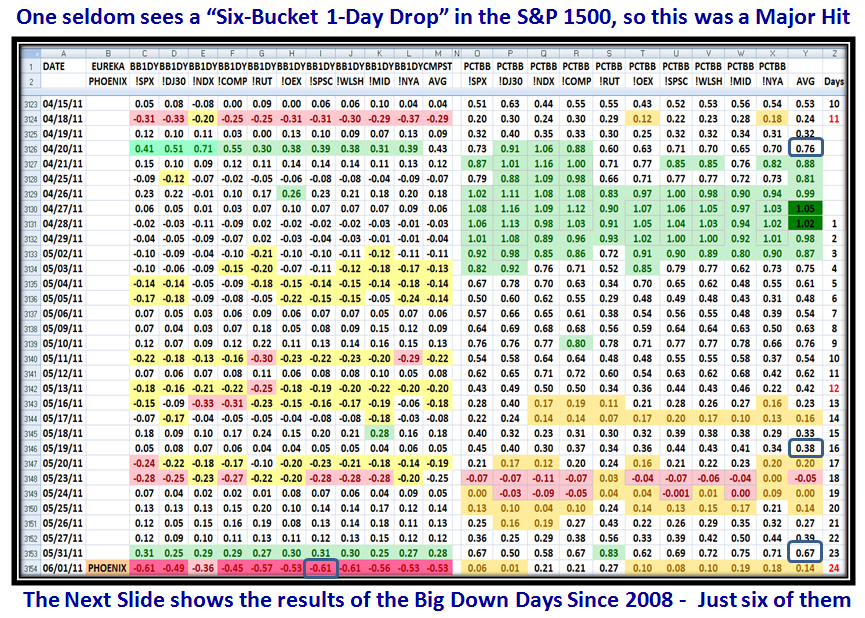
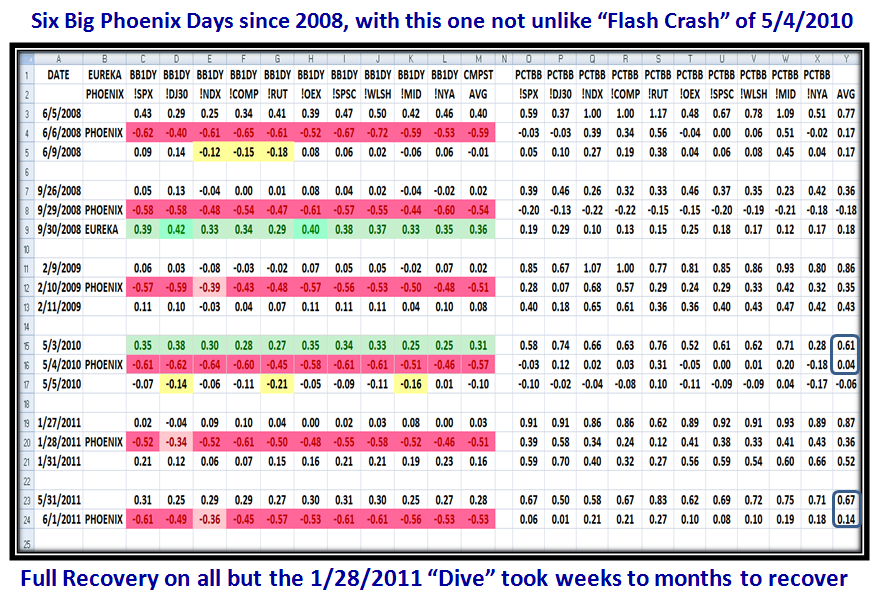
When we have a strong Phoenix Signal using the Arms Index parameters for unusual downward action with the -2.3% down move in the S&P 1500 and it is followed by another -1.0% down day two days later as we did yesterday, it is time to take stock of when the floodgates could open:

Let me make sure you understand there is by no means Panic yet, but it is best to have a plan while we still have a cushion that assures forewarned is forearmed. Here are pieces I have put together to guide you with the What, the Why, the When, the How and the So What?
1. The % down already from the high
2. How much “cushion” we have to get down to nervousness of -8% down
3. How deep the “oversold situation” is relative to past history as a guide for what more may be in store on the downside
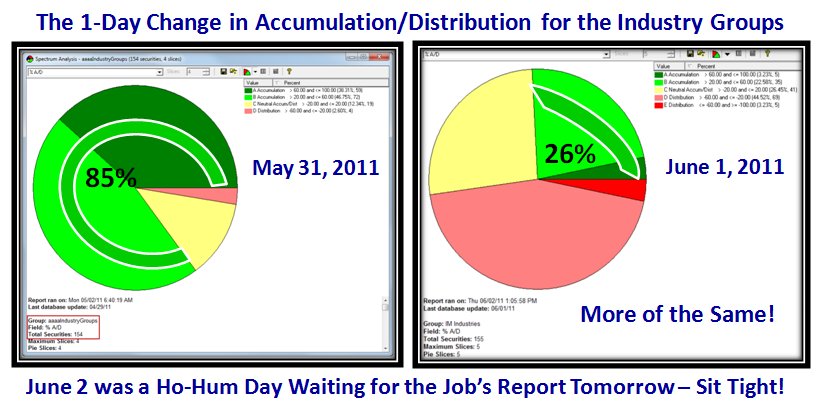
4. The status of the Accumulation/Distribution for the Industry Groups
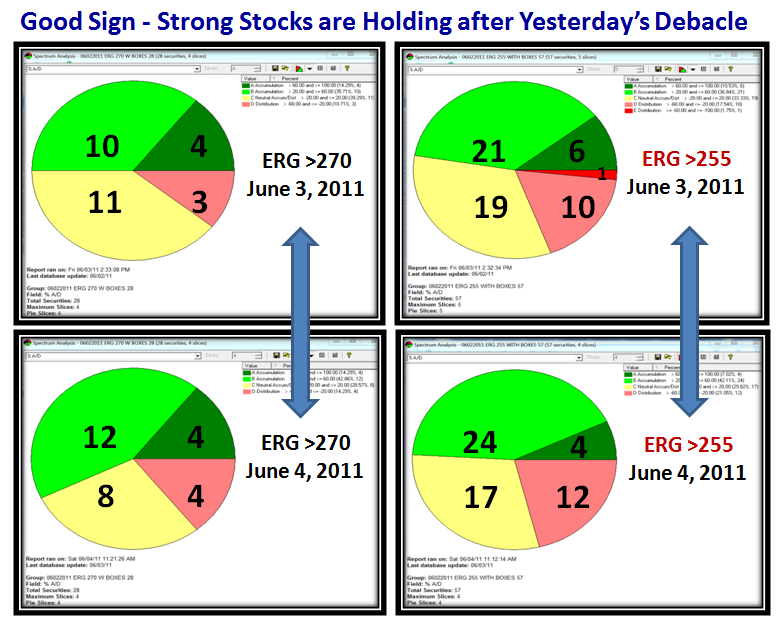
5. The most recent behavior of Leading Stocks with ERG >255 and >270 to see if they are holding up or dying
6. The reasonable targets for support and resistance
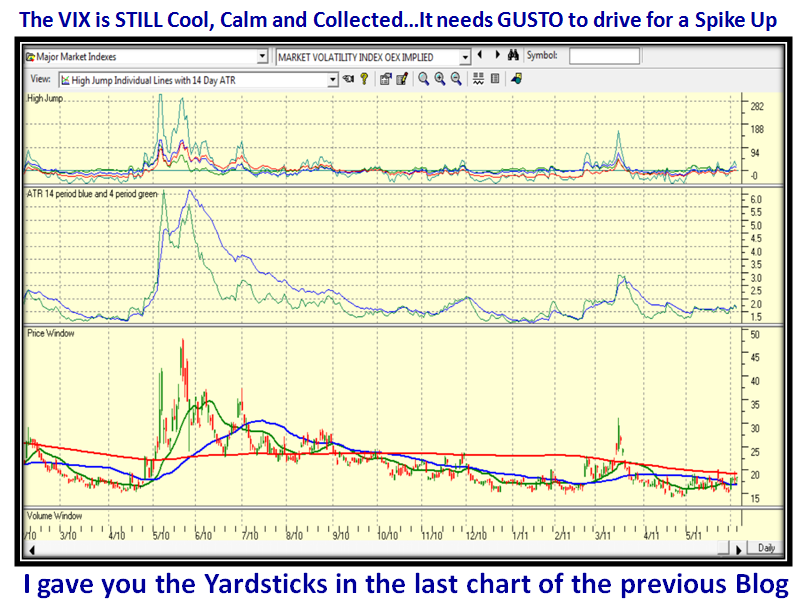
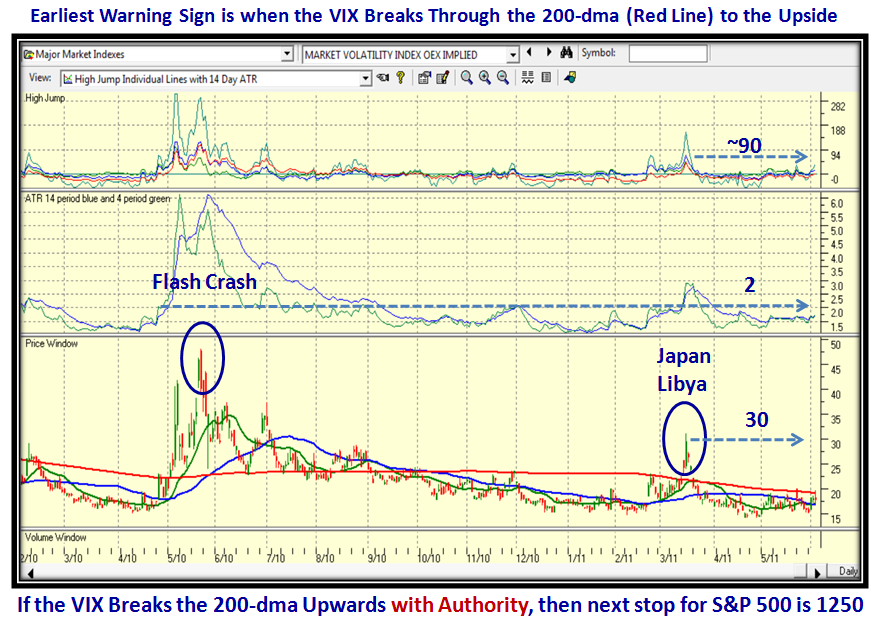
7. The Go to Index of the VIX with ATR and High Jump for the earliest warning sign of the floodgates opening
Most of the charts are ones that you are accustomed to so the charts will speak for themselves, and where there is something new I will explain what to look for and its value in the scheme of things.
So let’s start with the % down from the high and the extent of the cushion to get to -8% which would take us to 291 on the S&P 1500:
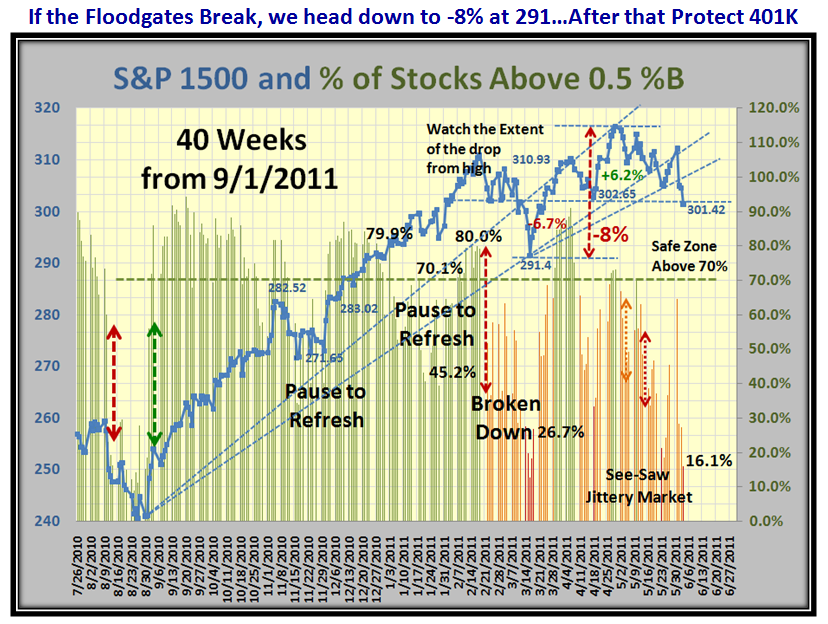
…And here is the update of the damage to the Market Indexes which I previously showed with a 6 Bucket drop (0.61) for the S&P 1500:

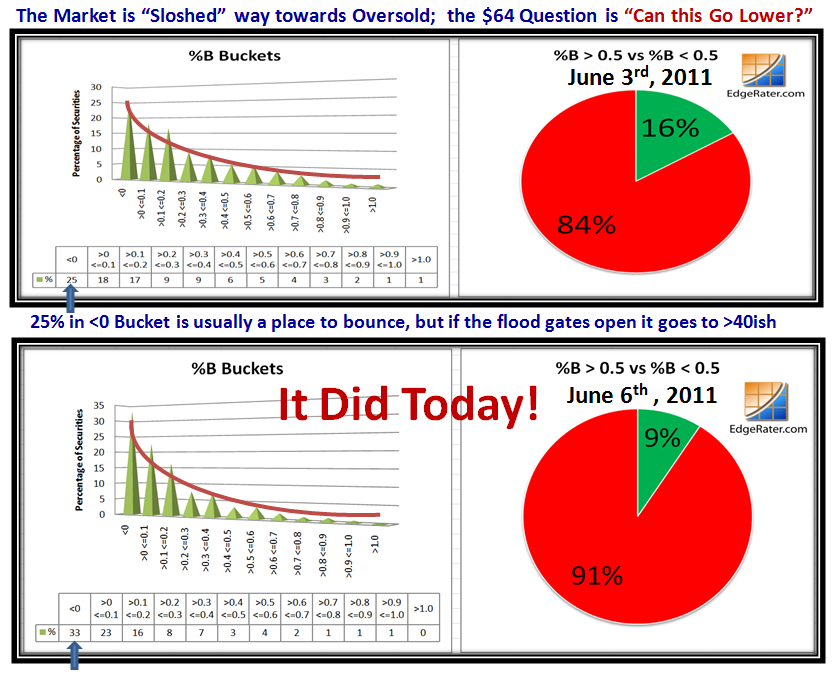
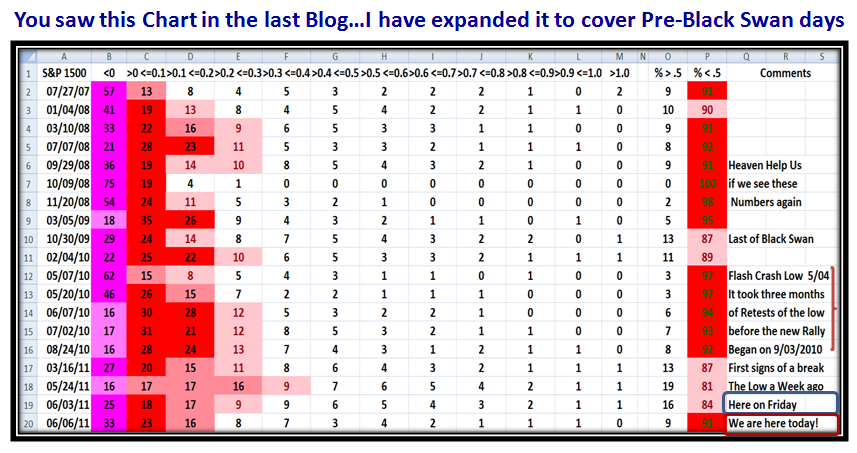
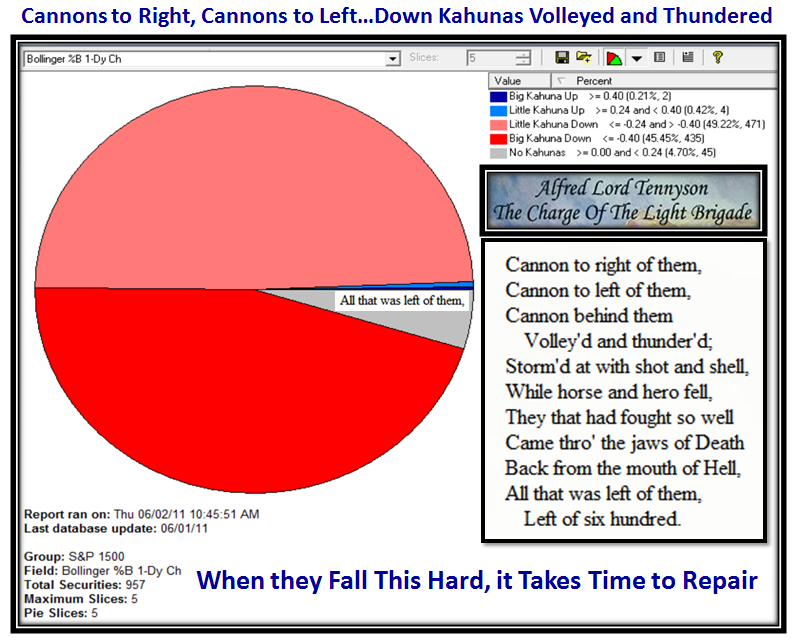
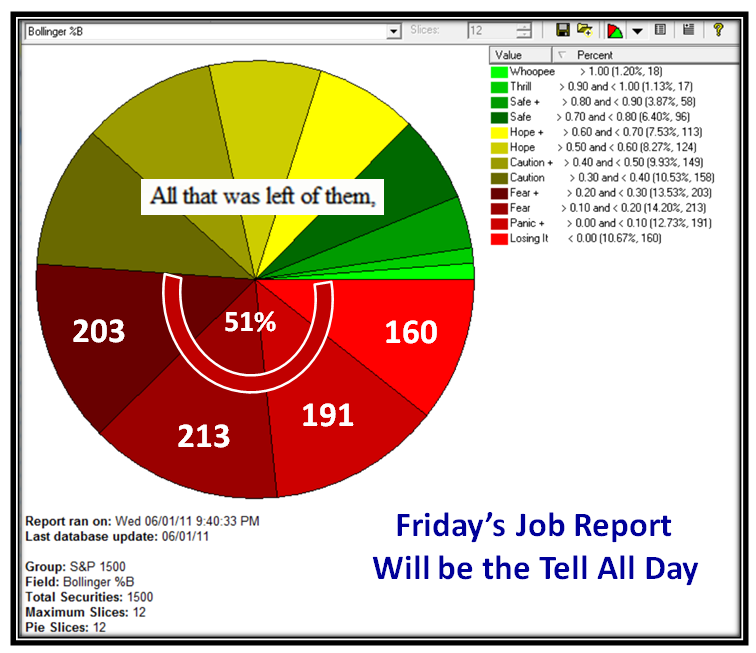
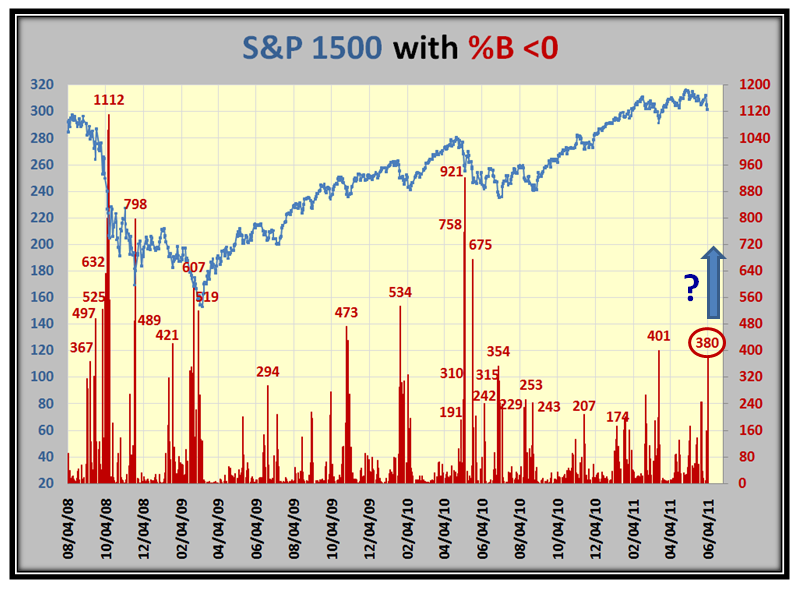
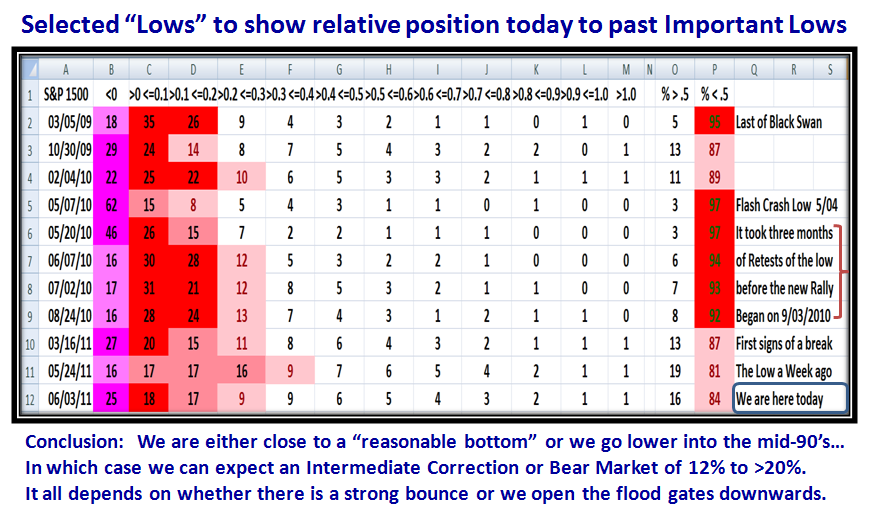
At times like these it is important to see the extent of the damage done by looking at the # of stocks in the S&P 1500 that are in Bucket <0. We are up to 380 and as you can see from past history, anything higher in ensuing days can start a steady decline if prolonged downwards:
Now here is a reminder chart, especially for any new members, who are interested in following the value of “Bucketology” with %B:
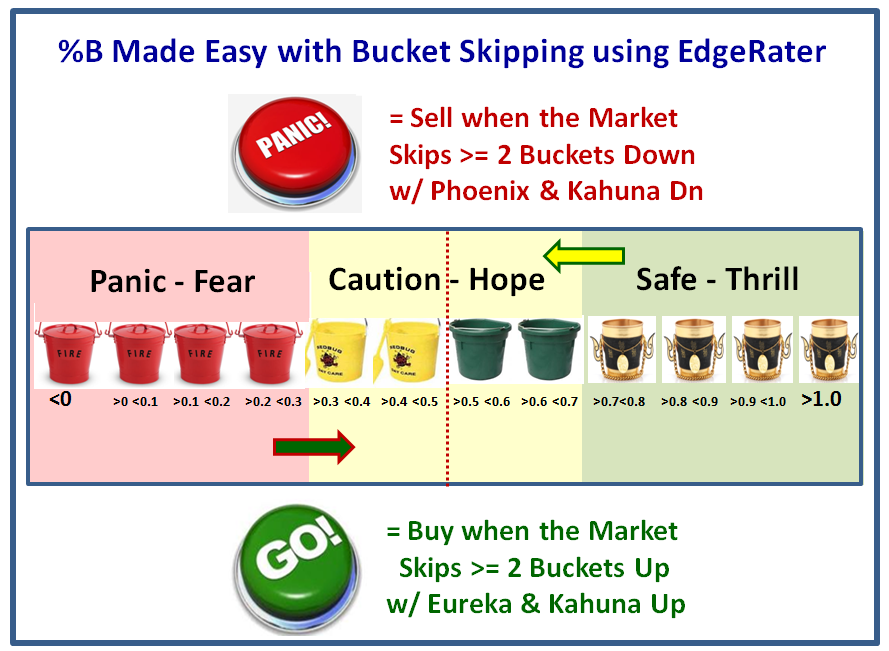
Couple this with the need to never fall in love with a single scenario, but have at least understood three so that you can identify the tides of the market as it sloshes from Overbought (high) to Oversold (Low) and points in between (Stalemate between Bulls and Bears):

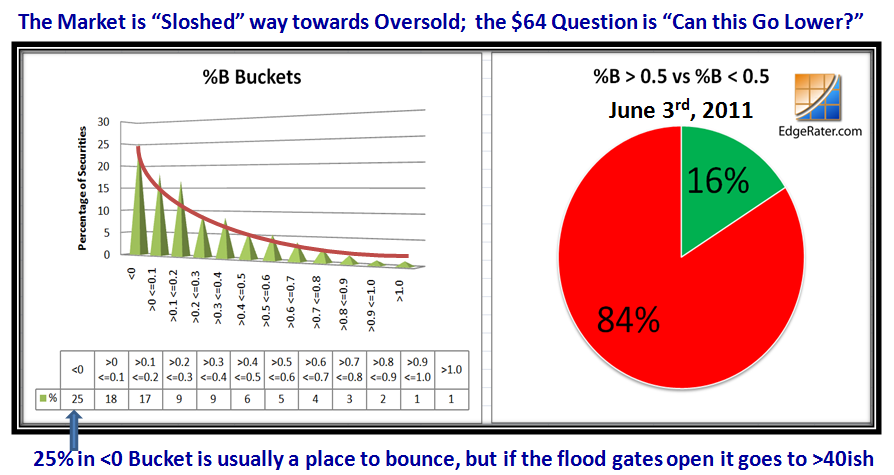
It goes without saying that we are currently sloshed to Oversold, but let’s try to understand the depth of the correction at this stage compared to recent past history of significant points in time we can immediately relate to. The next two slides do that:
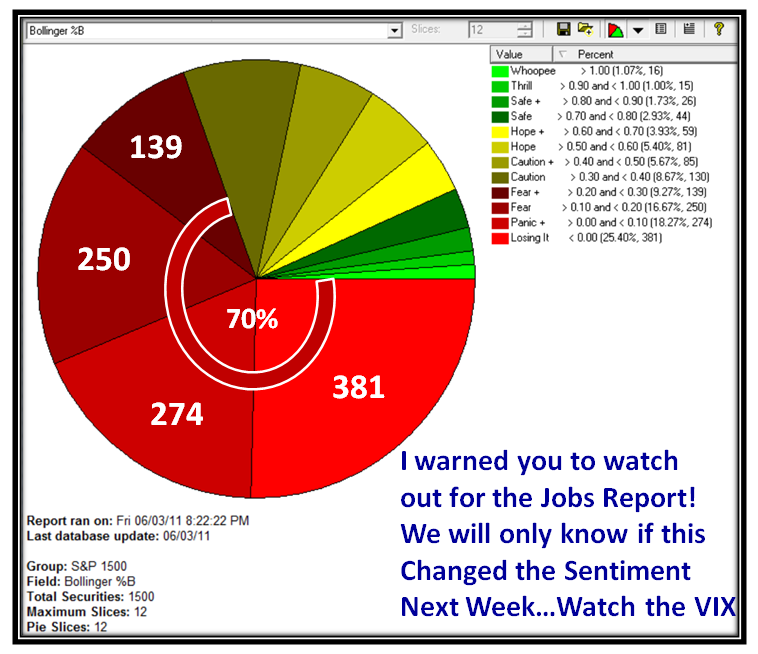
Last week I warned you to watch out for the Jobs Report, and it certainly caused a buzz to round off the week on that state of affairs:
It is never enough to just focus on the bad news. It has a habit of feeding on itself. The next two charts give some “hope” that all is not yet Gloom and Doom relating to what has transpired in the last two days. Always turn your attention to how the Leadership is behaving:
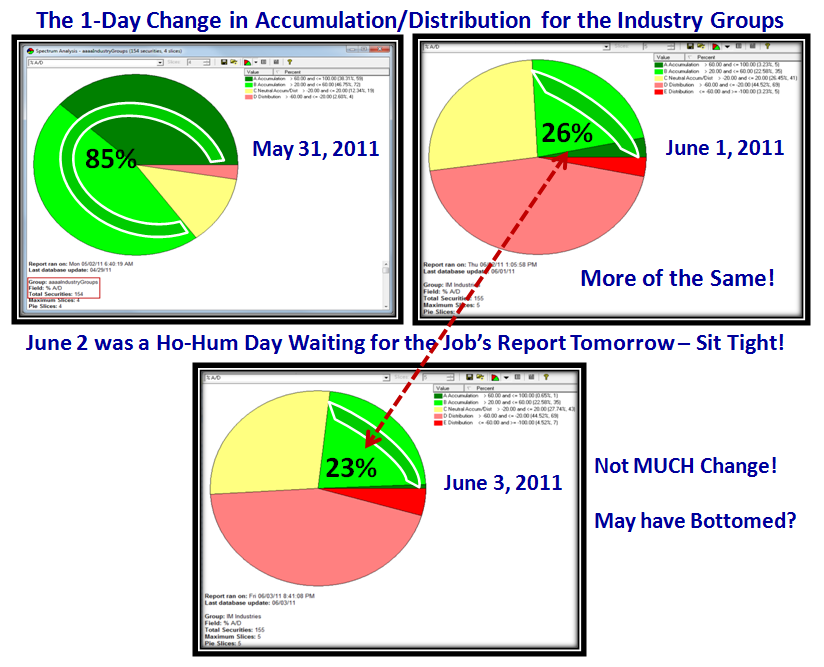
The above relates to the Industry Groups in terms of Accumulation/Distribution and below we have a flavor for Leading Strong Stocks:
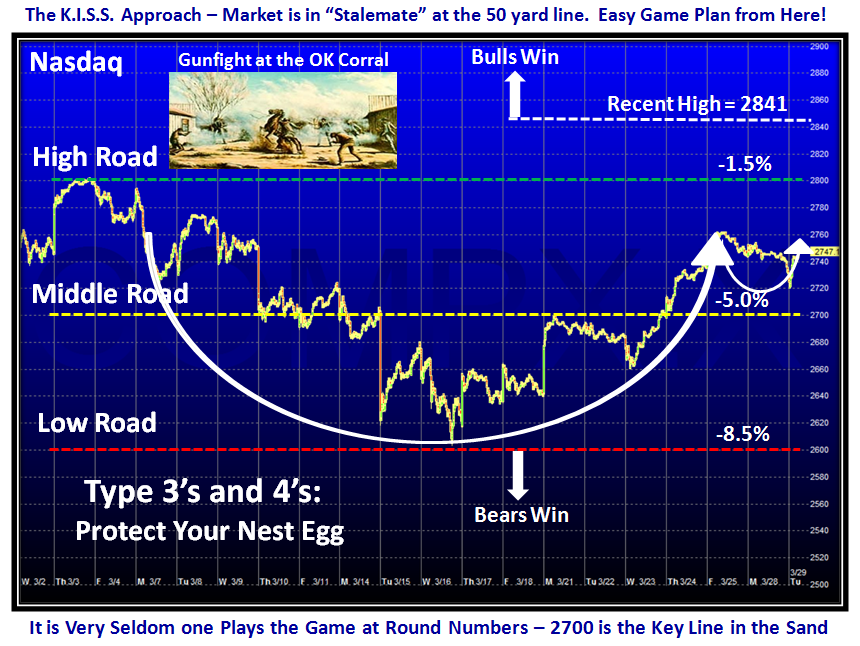
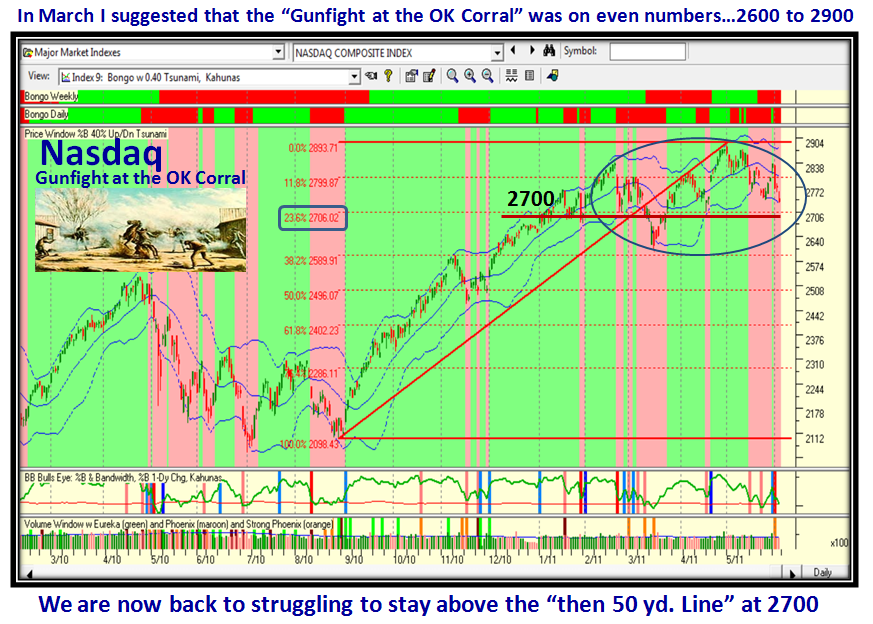
So let’s take two steps backward to come forward. It is now all of three months ago since I suggested that the Gunfight at the OK Corral between the Bulls and Bears was being played between 2600 and 2900, with the 50-yard line at 2700. That has held true so far but unfortunately we are now losing the cushion we had in the 2800’s on the Nasdaq and we are ominously back to retesting 2700:
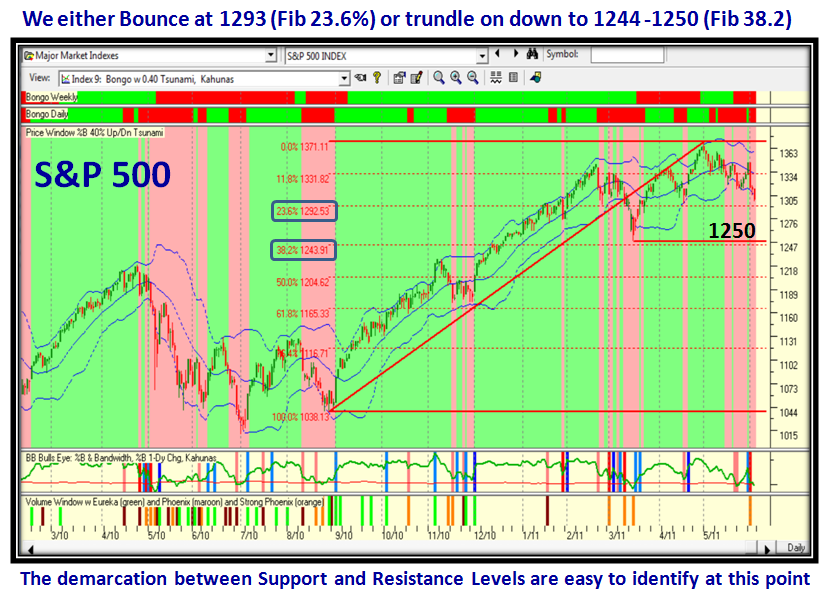
…And here is the S&P 500 for good measure. What we immediately see is that Fibonacci Lines come into play as well:
So given all of that, what one item will give us the earliest clue short of an obvious run for the floodgates of an early warning? The VIX:
Good luck. Best Regards, Ian.
 Ian Woodward's Investing Blog
