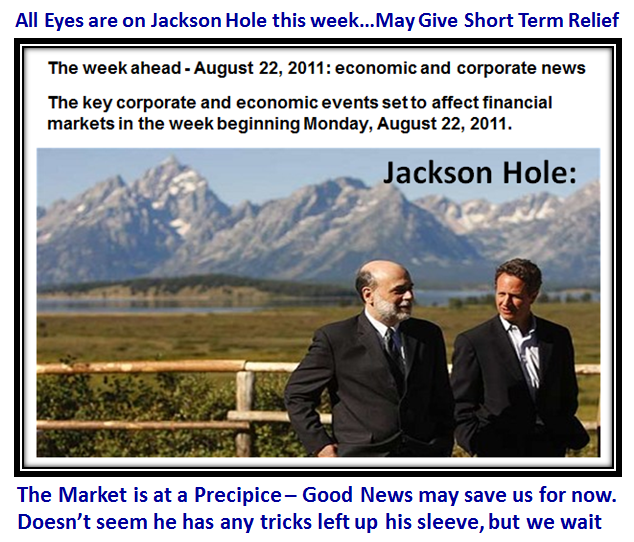
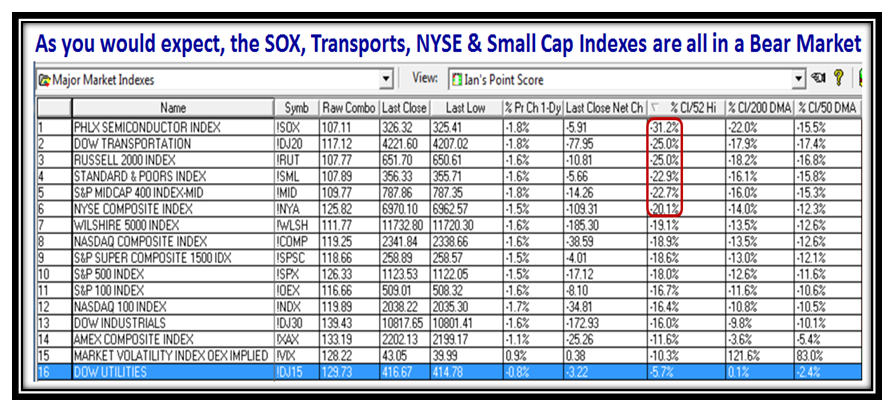
As I start this Blog Note New York City has been spared the Wrath of Hurricane Irene, and I assume the Stock Market will be open tomorrow morning, despite flooding in Lower Manhattan. The news from Jackson Hole was underwhelming, but it seems that no startling news was good news, and reading between the lines the market felt assured, for one day on Friday, that Helicopter Ben still had a few tricks up his sleeve. He implies that he is not out of ammo with “The Federal Reserve has a range of tools that could be used to provide additional monetary stimulus”. In addition, the FOMC is now meeting for two days instead of one to discuss how best to use them.

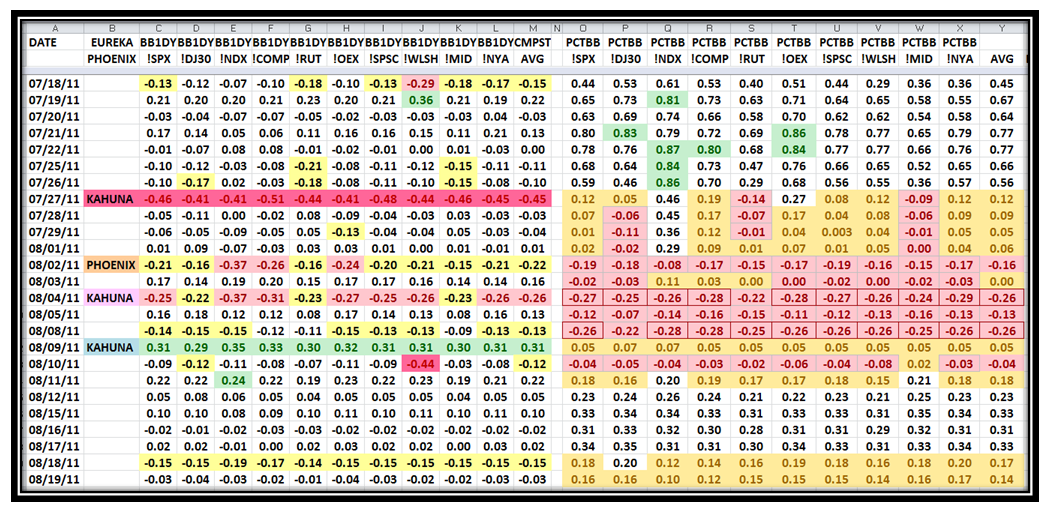
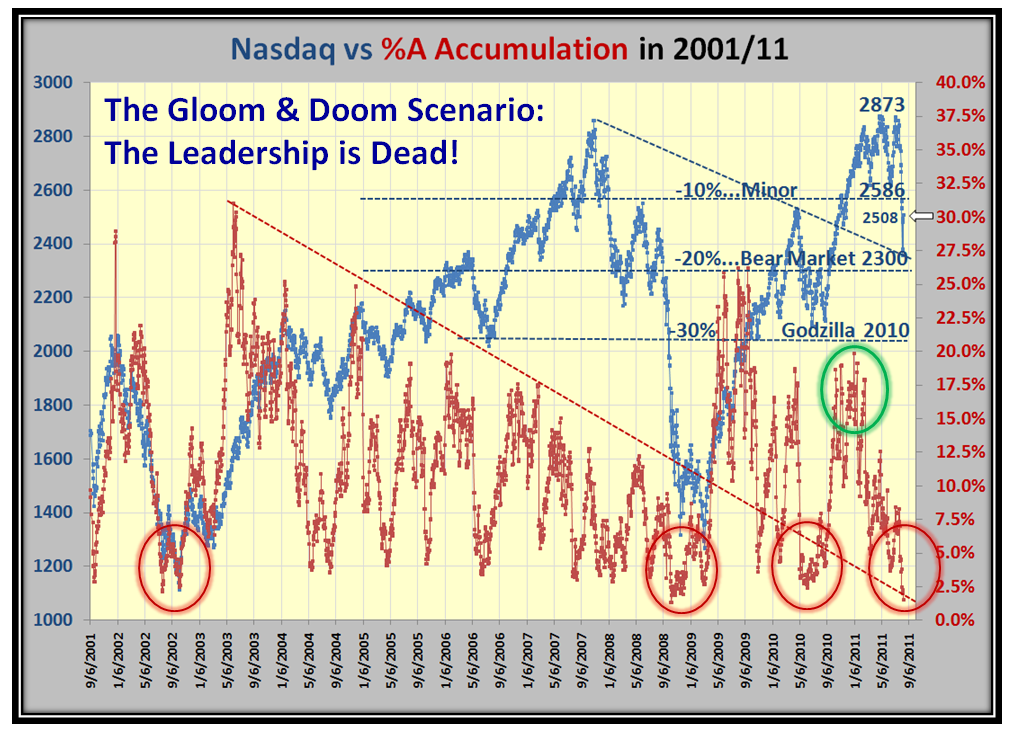
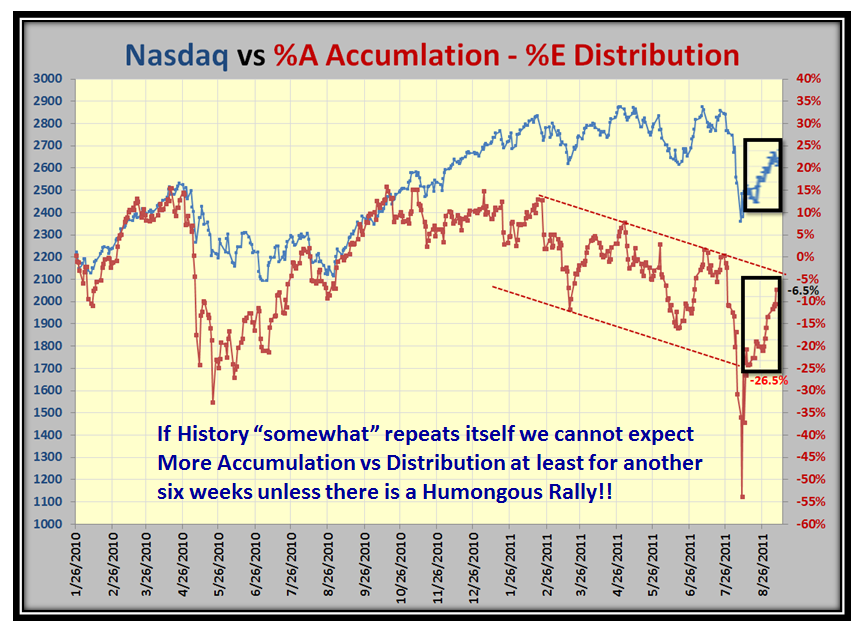
I trust they are not as befuddled as our friendly Financial Gurus who can’t seem to make up their minds if we are in a Market in a Confirmed Uptrend or Under Pressure with their yo-yo statements within four days last week. As my good friends Jerry Samet and both Mike Scott’s will tell us it is essential to watch Eurekas, Kahunas, and %A-%E Accumulation/Distribution along with the Coppock and McClellan Oscillator to assure oneself that we are on the right side of the Market. You know the drill, and we are by no means out of “Jackson Hole” on the Market as I will give you fodder, targets and reasoning to make up your own minds as to what to look for. Be prepared to play Yo-Yo or sit tight. You be your own Guru…it’s your Money!
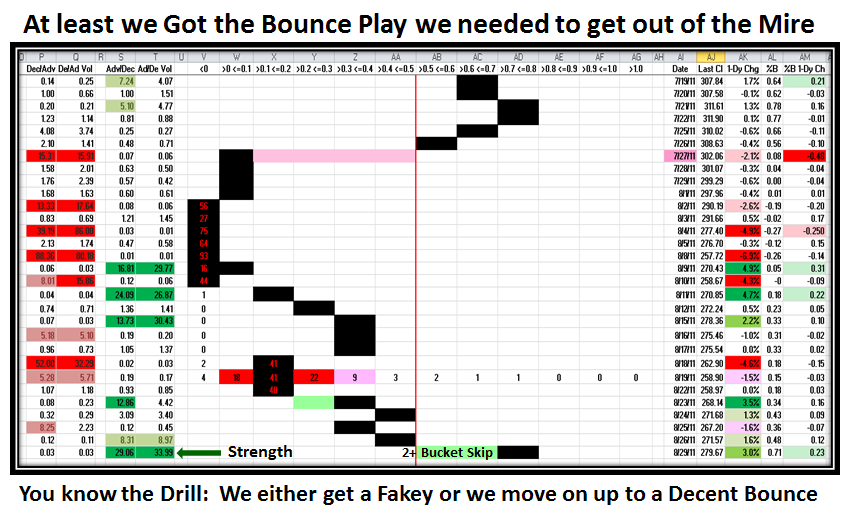
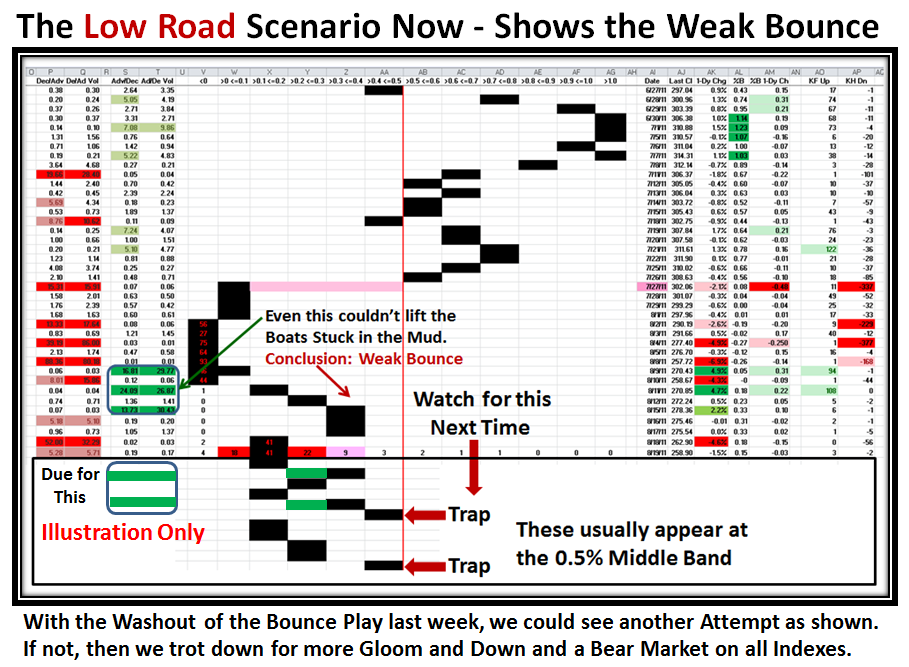
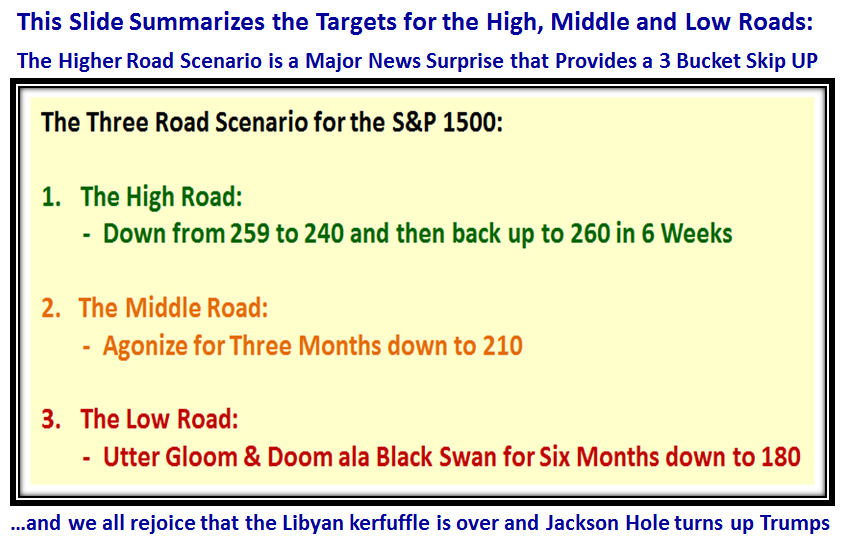
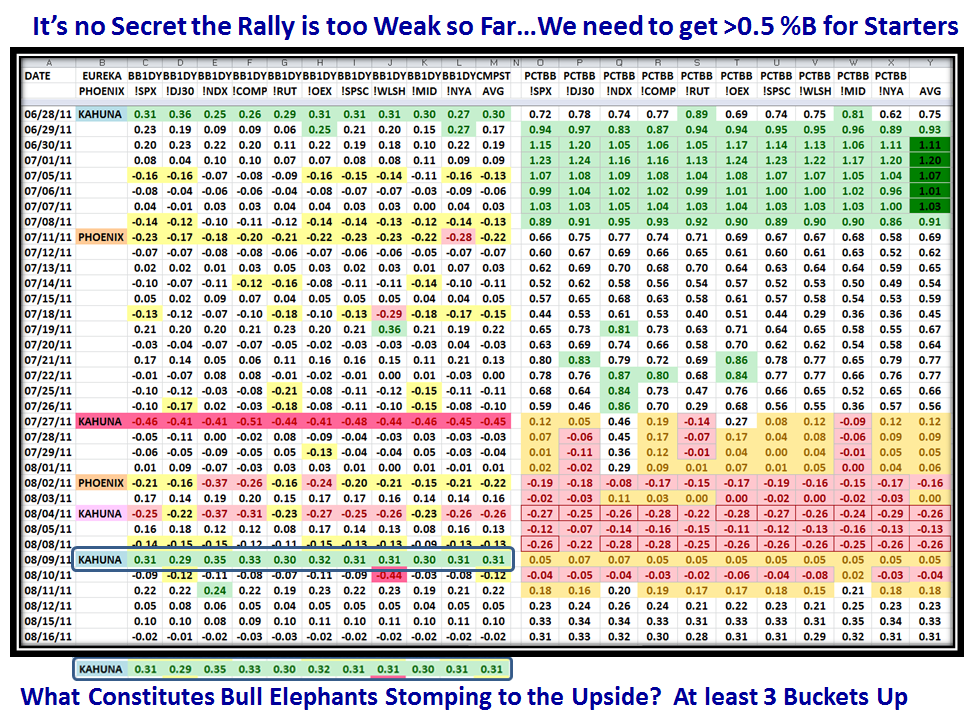
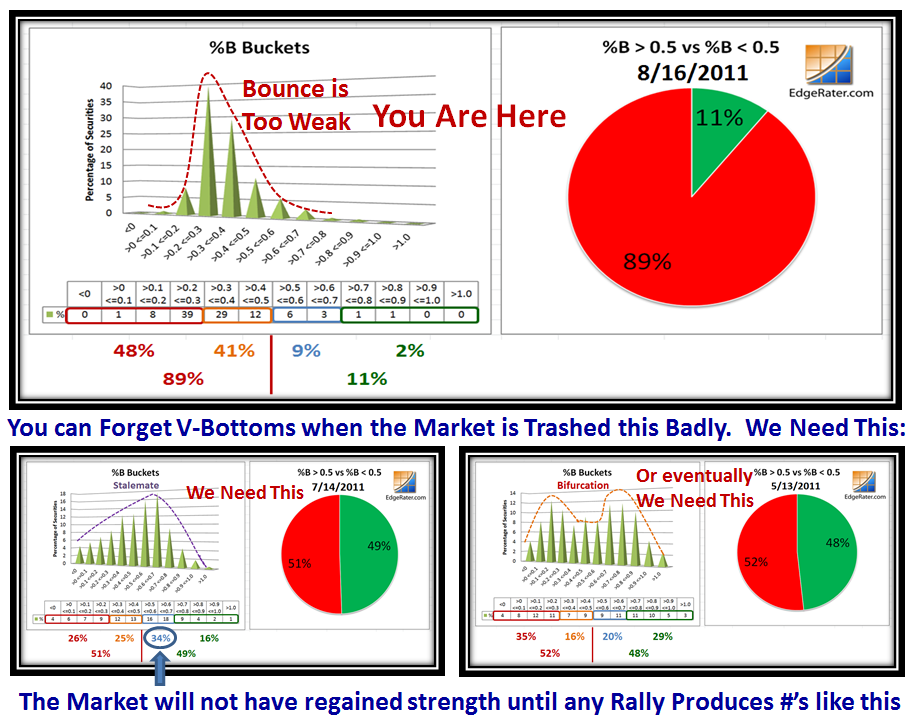
The Message in one sentence is “This Market is so oversold that all boats are still stuck in the mud and we will need a Substantial Move with a 3-Bucket Skip Upwards to at least show that the Bulls are back in earnest”.
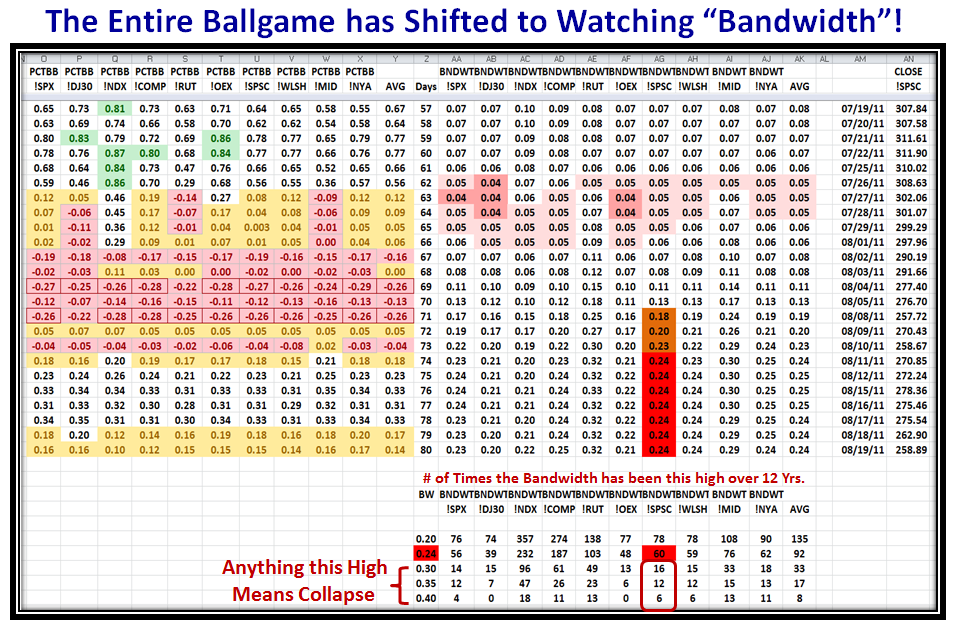
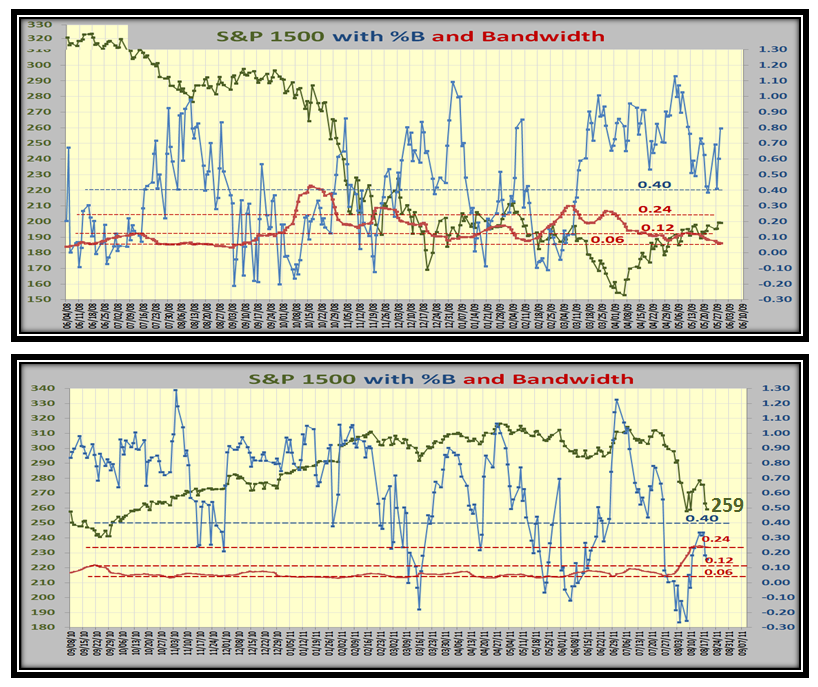
Let’s start with our favorite chart which now focuses on Bandwidth. Don’t get excited if you can’t read the numbers, I lead you by the hand with the colors and words at the top and bottom of the chart. The first thing to note is the definition of “Composite”, which I will be using in the two charts below this one. As you can see by the arrows, Composite applies to the Average of all ten Market Indexes shown and although the numbers are very even regardless of which Index you choose to follow, the beauty of this approach is “Consistency”. More importantly, the Highs and Lows of past Major Moves give us a Stake in the Ground and Measuring Rods that set the Reasonable Targets for good and bad.
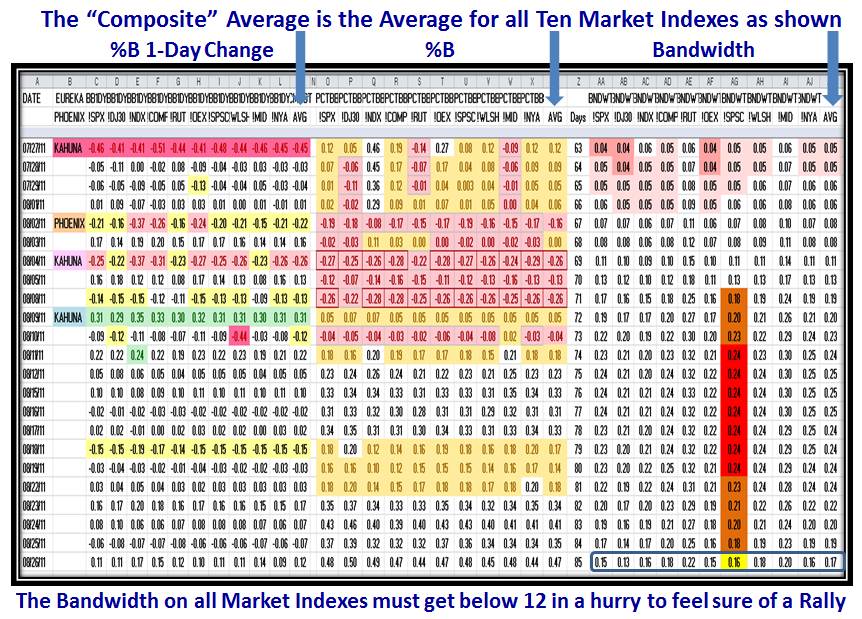
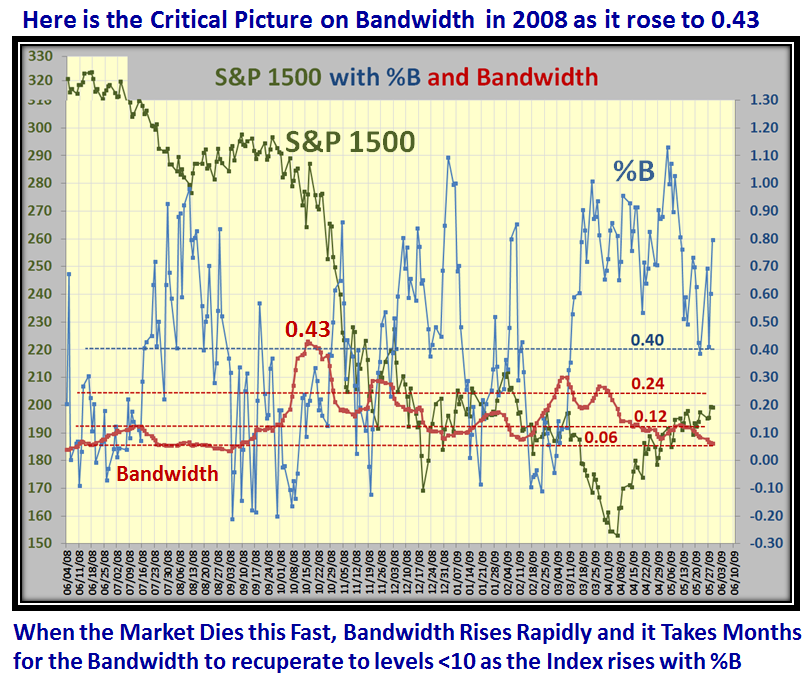
I will re-emphasize that based on past history and particularly for the Black Swan of 2008, the Bandwidth MUST get below 12 for us to consider that the worst is over FOR NOW. It doesn’t mean that we can’t get back into hot water, but what we need to identify is what transpires in the next few weeks, not months from now.
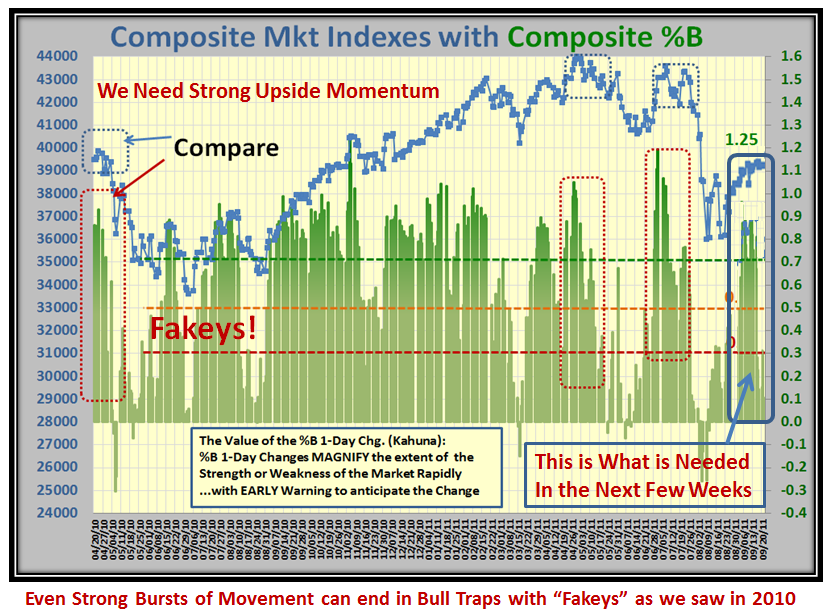
The next two charts are for the Composite of the Ten Market Indexes for %B. The first shows the dramatic effect of the swoon we experienced that took us rattling down close to Bear Market territory of -20% from the high. It shows where we are now and the second chart shows what must happen for us to be re-assured that the worst has temporarily passed, and we have a cushion of some sorts for the next buffeting should it occur:
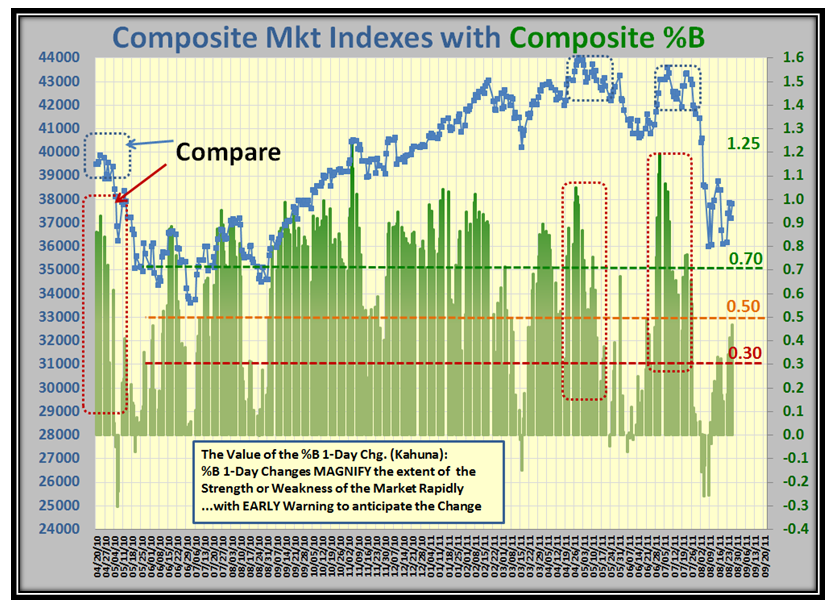
Note that the Composite Reading for %B is still below 0.5 and the beating we have taken compared to the Flash Crash period on the left hand side of the chart. Then observe the struggle it took for four months to recover to a new Market Rally starting in September, 2010. In this next chart I show what MUST happen the next few weeks before one can be assured we have at least a Rally, and even then we are at the mercy of fakeys:
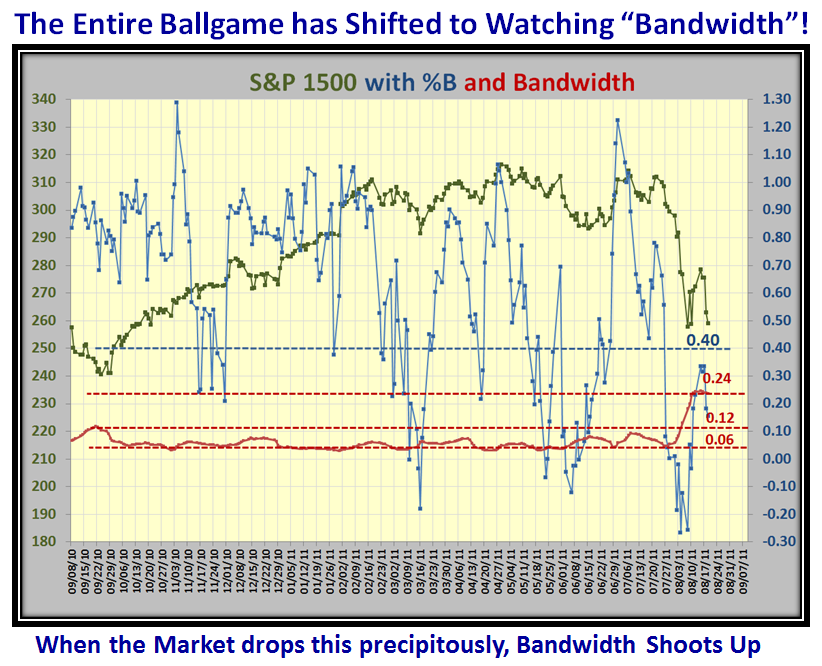
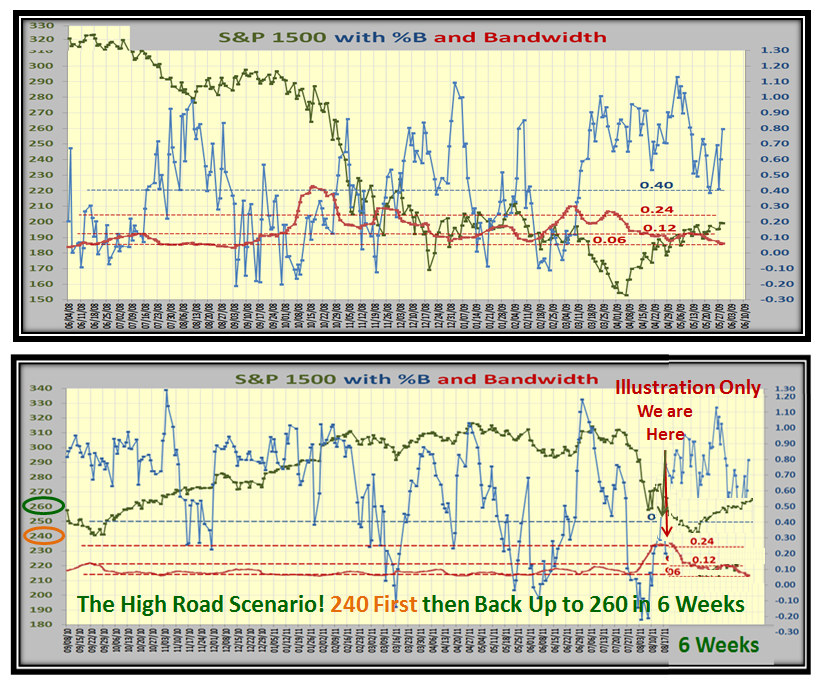
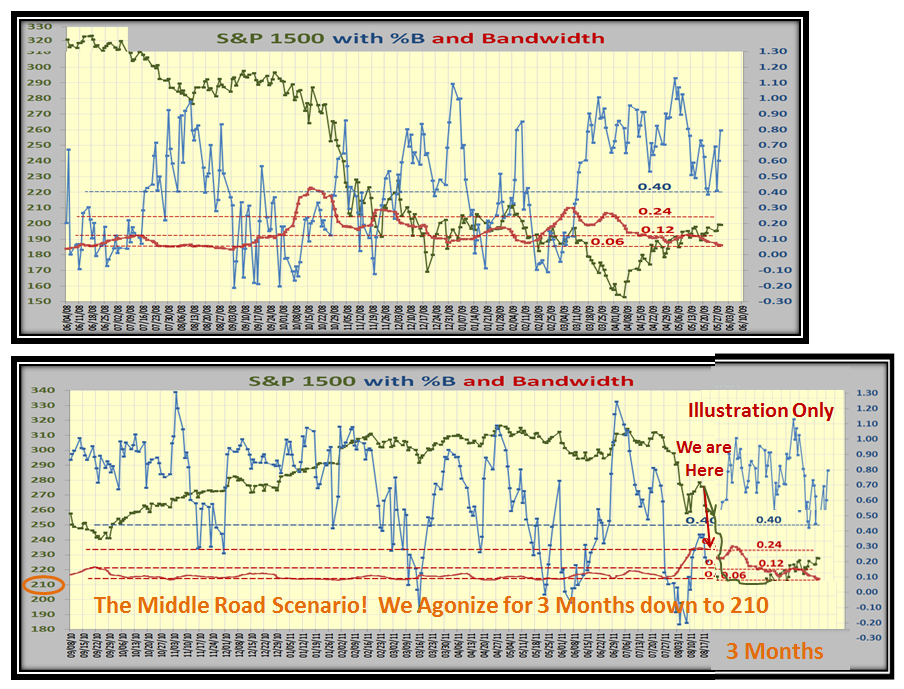
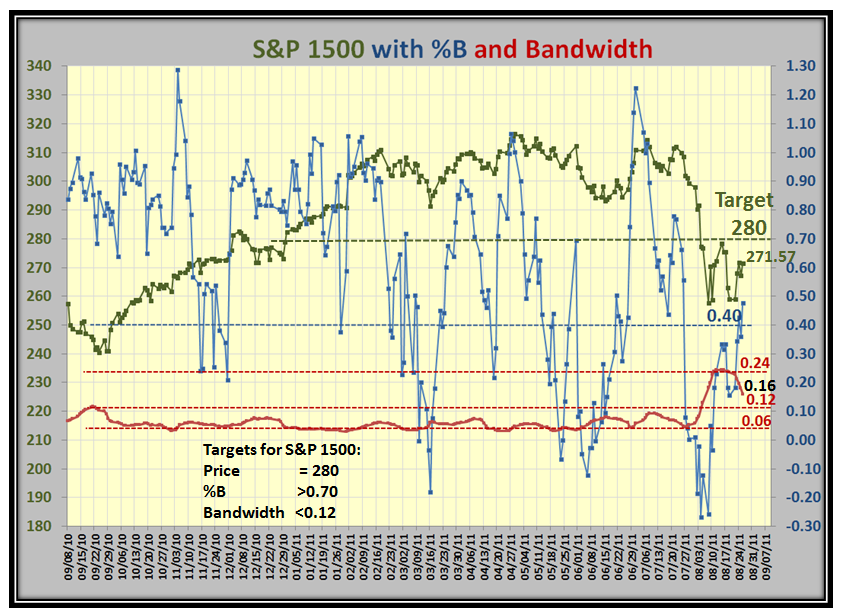
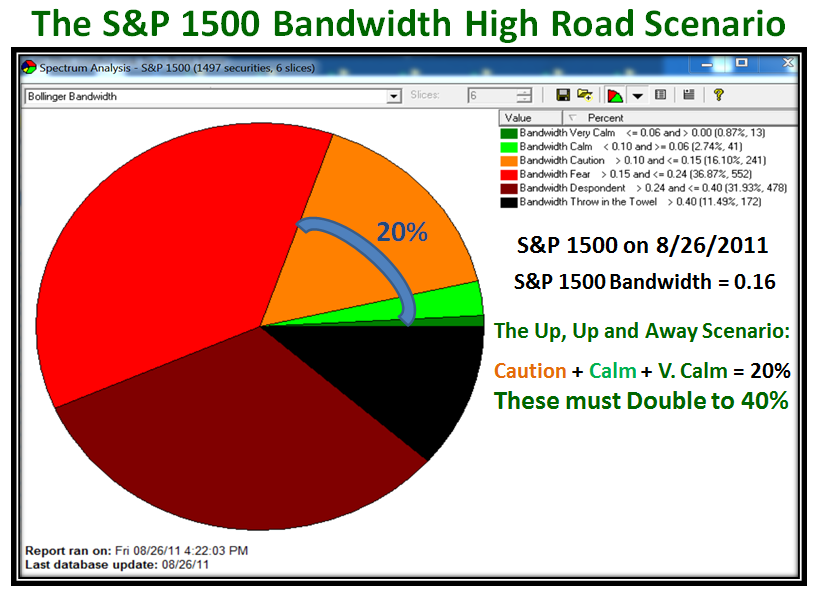
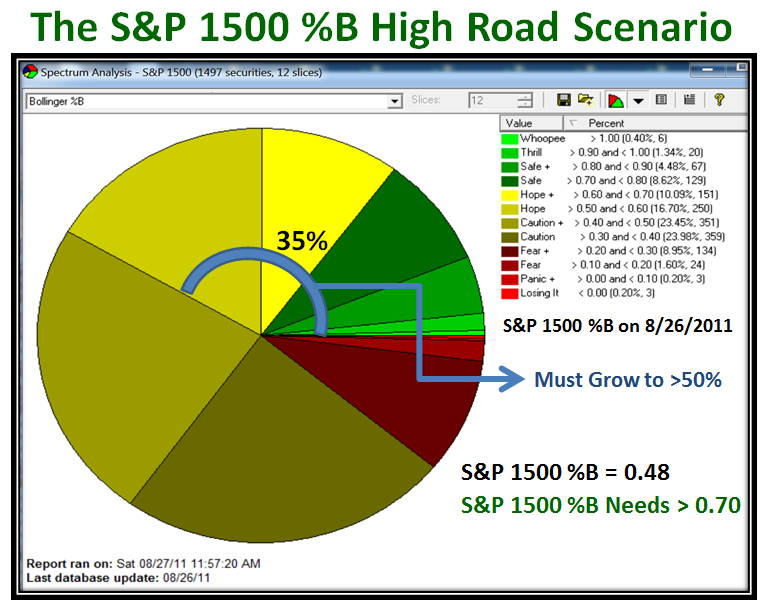
In this next chart, I am back to the S&P 1500 with %B and Bandwidth shown. It doesn’t take two seconds to see that the KEY TARGET is to get the Bandwidth down to being CALM with readings below 0.12. We are currently at 0.16, so there is hope, but it requires the push I showed above:
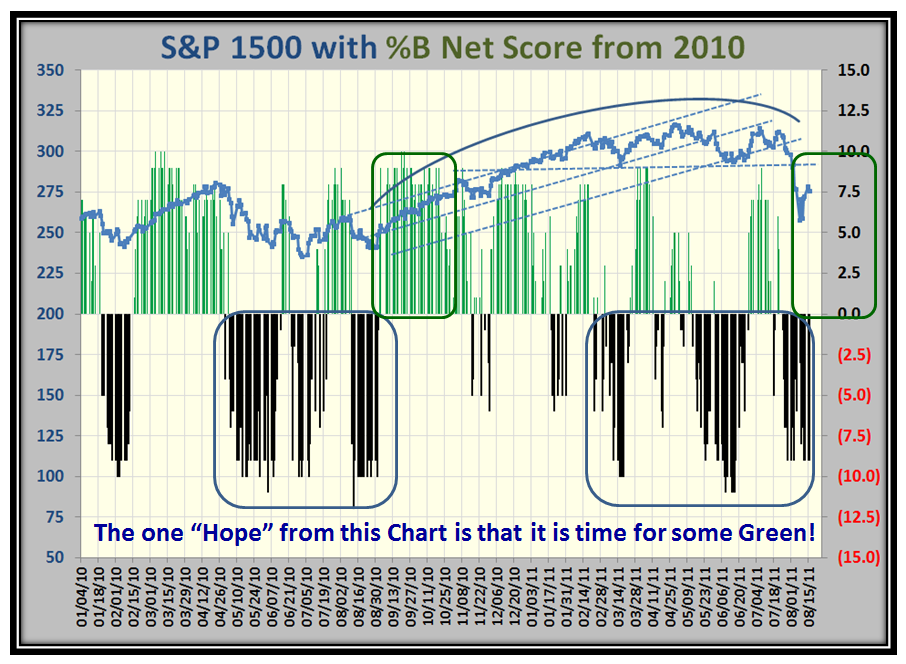
The “Score” has improved from -9 to -2 but again we need to see the bias turn upwards before the score is positive to at least show Stalemate:
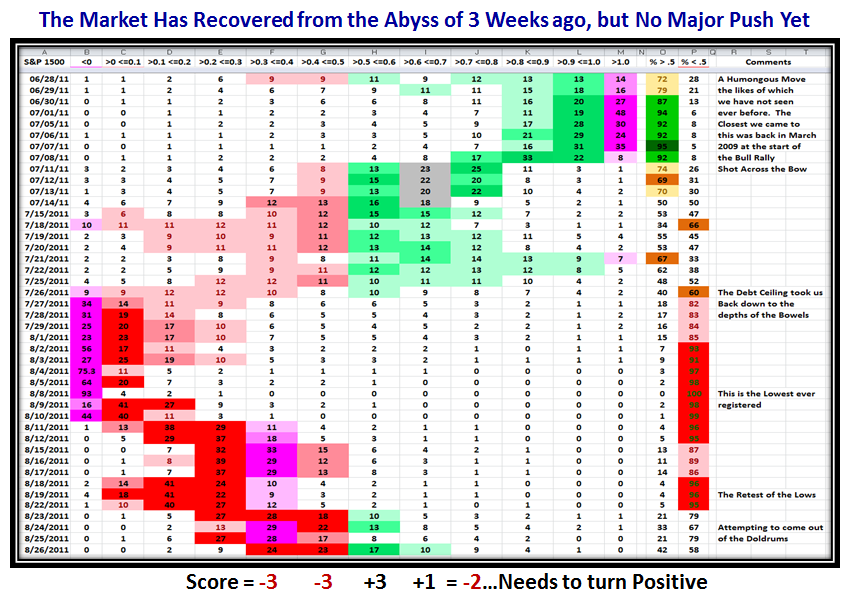
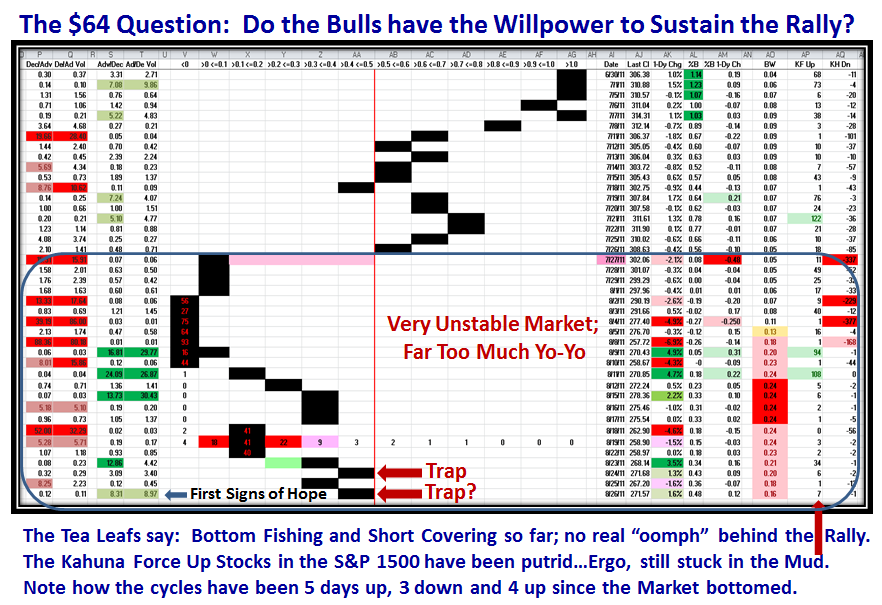
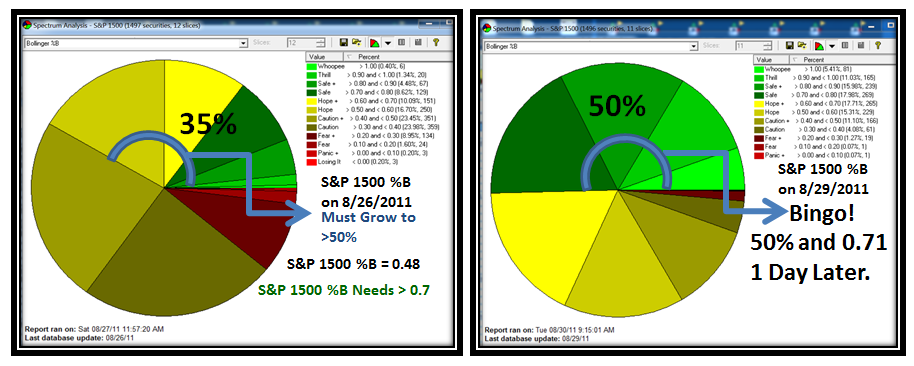
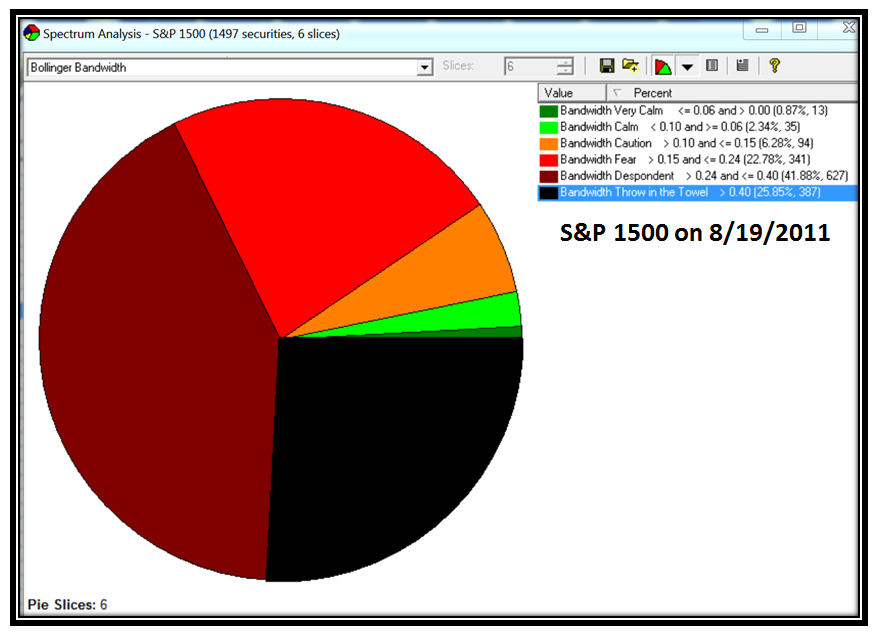
Now the question you are asking I am sure is “How can I track this good stuff, EASILY?” The next three charts show you how in HGSI. Now please don’t all shout out at once that you don’t have the Bandwidth slices I show. You either put them in yourself or you wait patiently for the next upgrade when it will be in the Slices Folder of the Spectrum Analysis Pie Chart. Here are the targets for the High Road Scenario:
…And here is the picture for %B which is in your Slices Folder, so you can easily track this inside five minutes on HGSI:
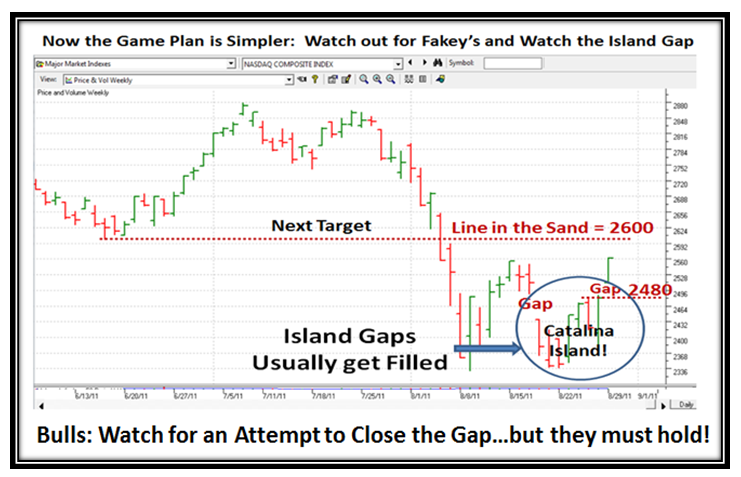
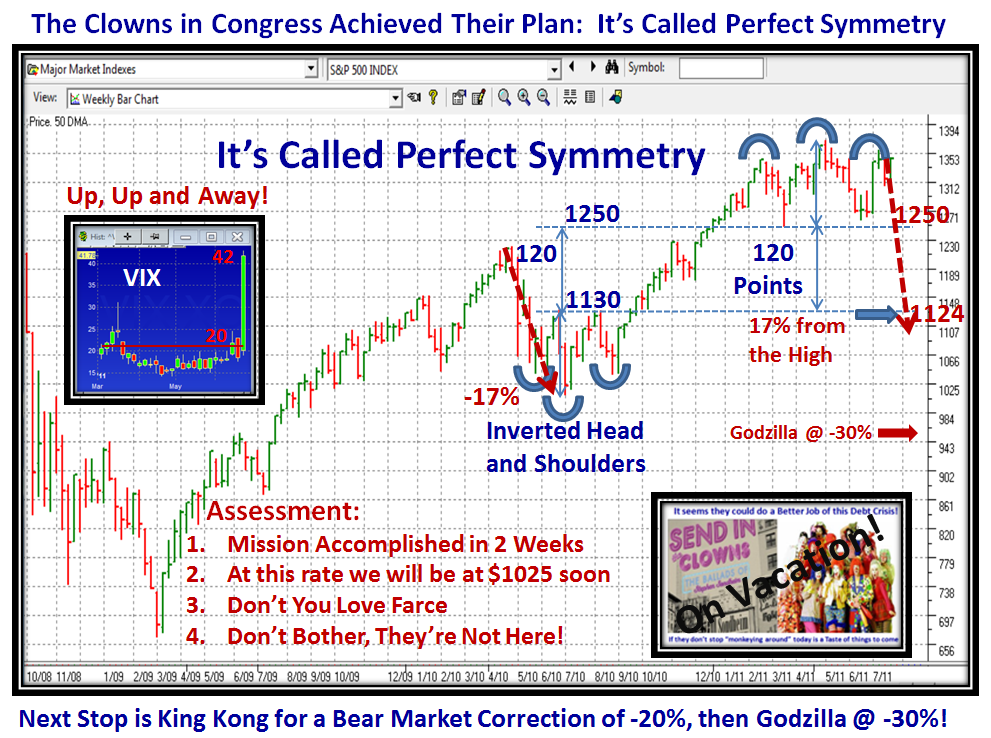
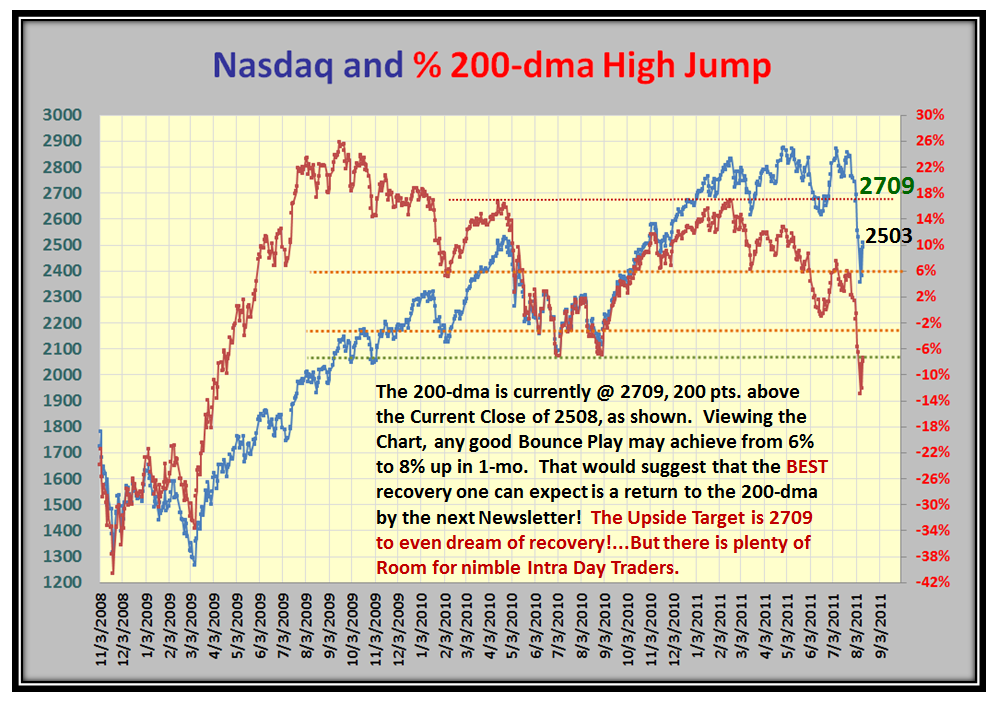
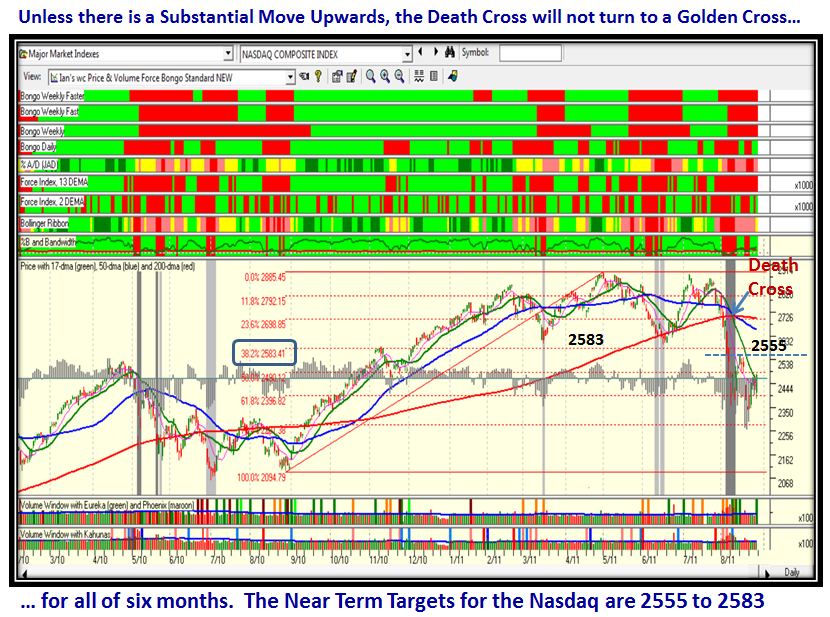
Now let’s look at the Nasdaq with its Price Targets for the immediate future. Please note the Death Cross predicament shown on the chart:
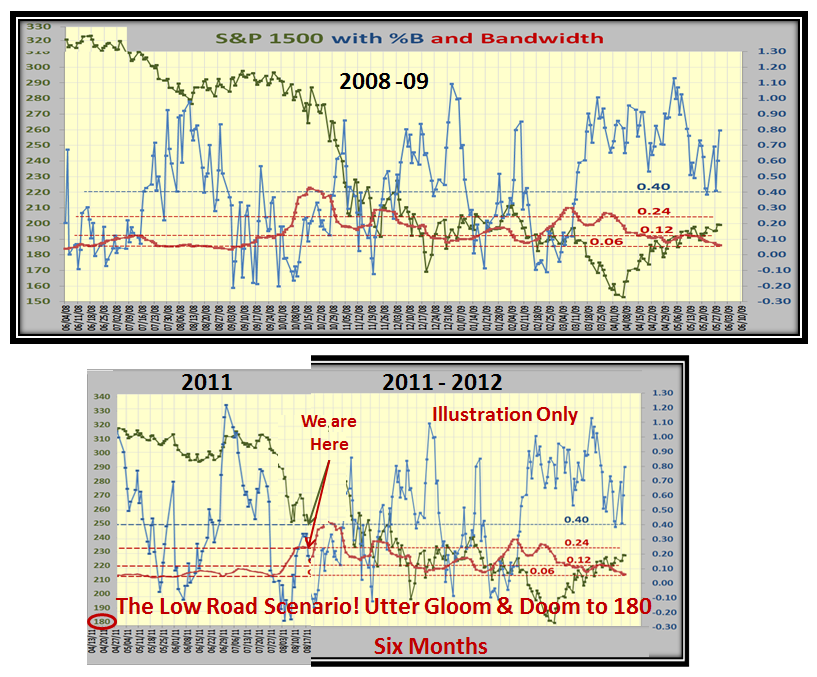
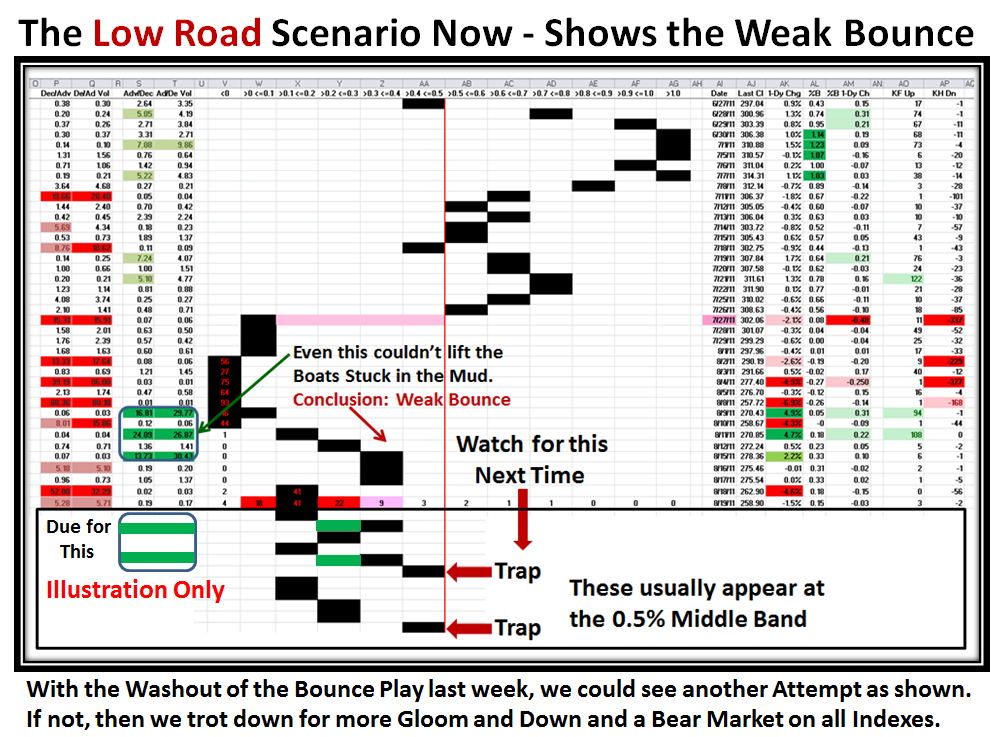
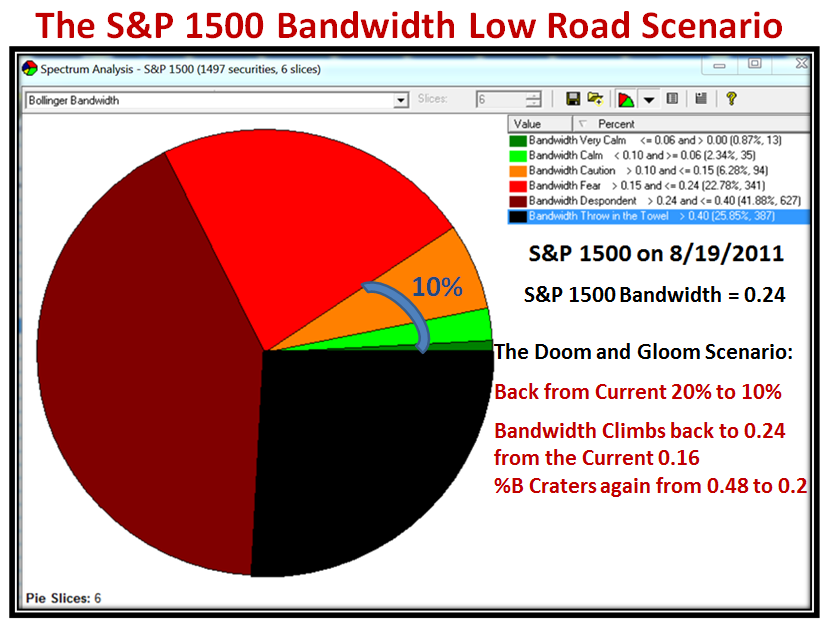
…And Finally, we have one picture for the Low Road Scenario, besides all the other warnings I have given you above:
My Thanks to those of you who chose to drop me a line of appreciation for my work which is a labor of love. Please drop me a line and let me know if you are coming to the Seminar from October 22 to 24 which is now only seven weeks away. It is on, but we need to hear from you NOW. There will be plenty of new “Good Stuff” that Ron and I will cover, to say nothing about all the goodies in the Substantial Upgrade to come in a few weeks time.
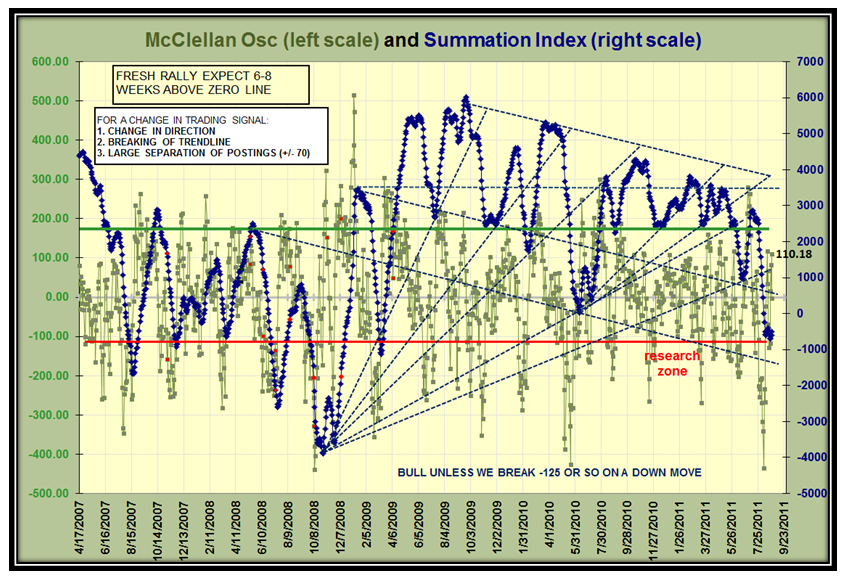
Late Breaking News: Paul asks: What are your suggestions to look for with the McClellan Oscillator?
Your wish is my command. The Oscillator is at 110.18 so that is good…it needs to move up to above 200 for the rally to continue. The Summation Index has bottomed for now, but needs to start moving up with wide separation of postings and break up through the down-trend-line with gusto. We would like to see it get above 1200, but that is wishful thinking for now:
Best Regards, Ian.
 Ian Woodward's Investing Blog
