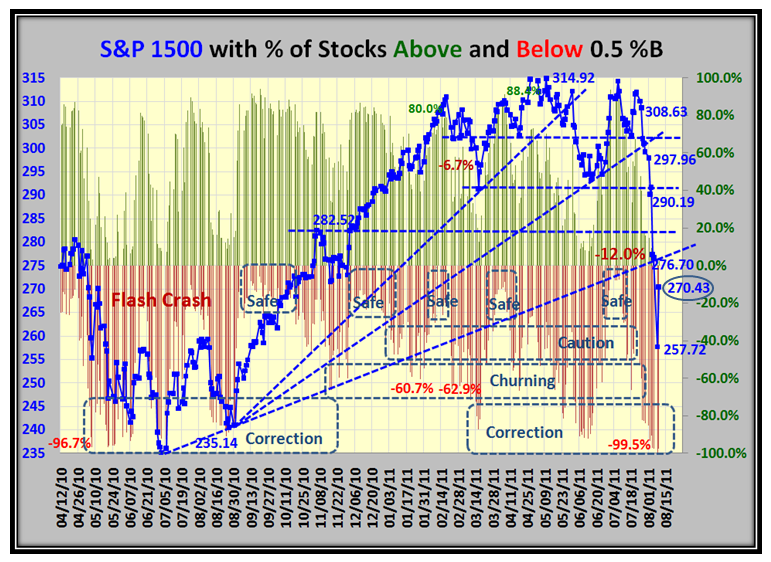
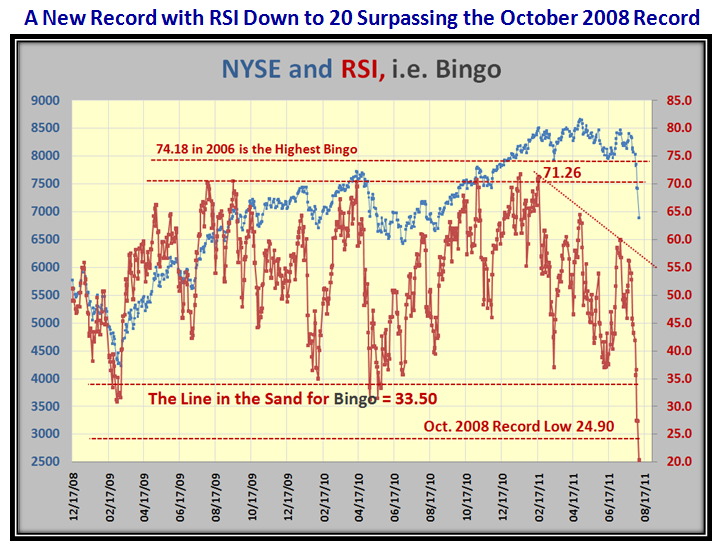
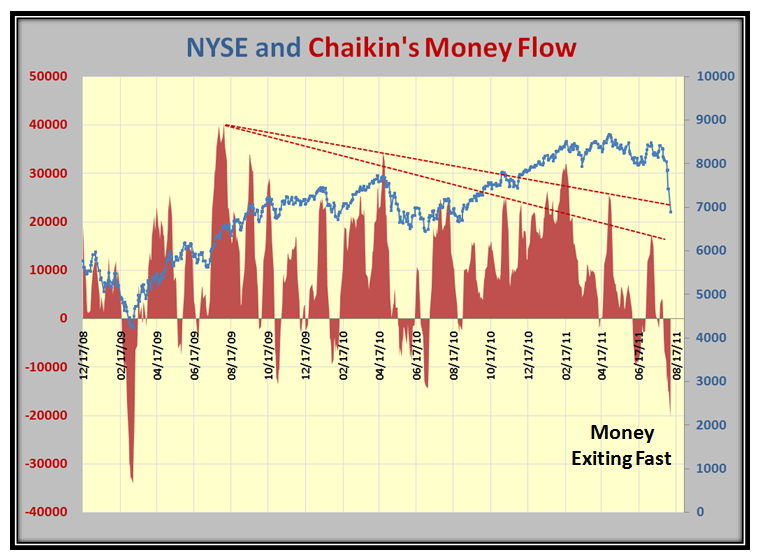
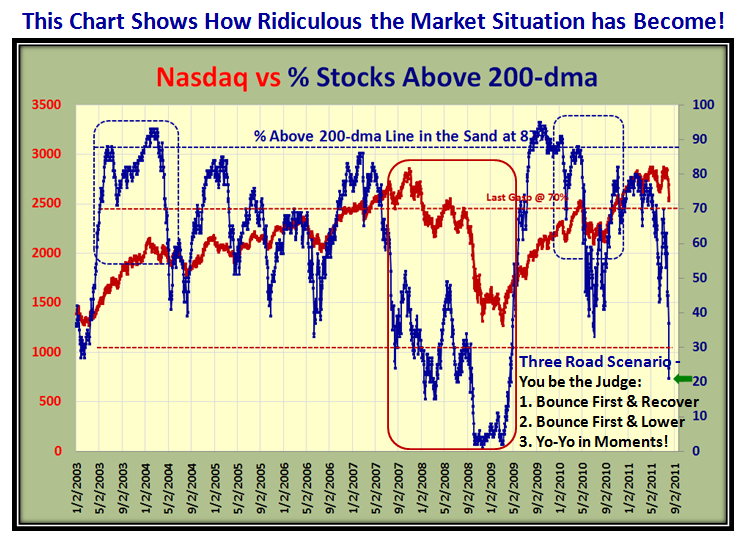
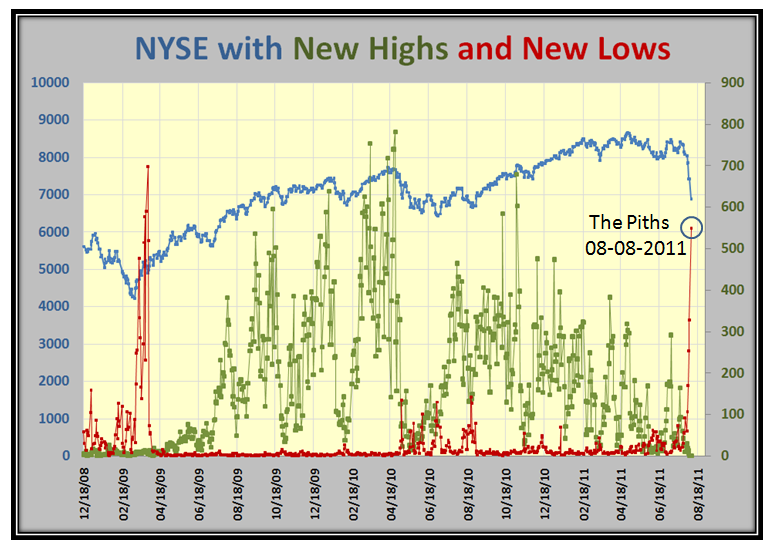
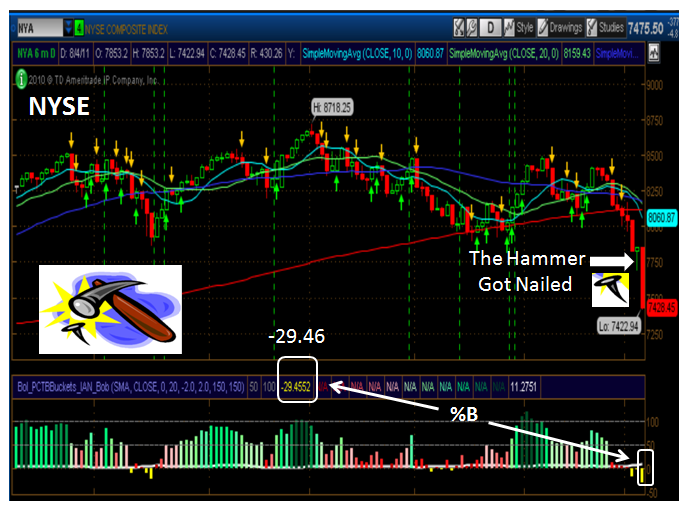
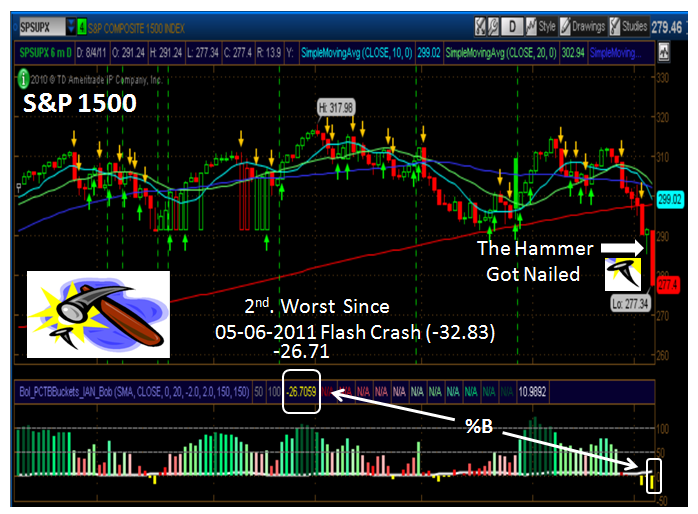
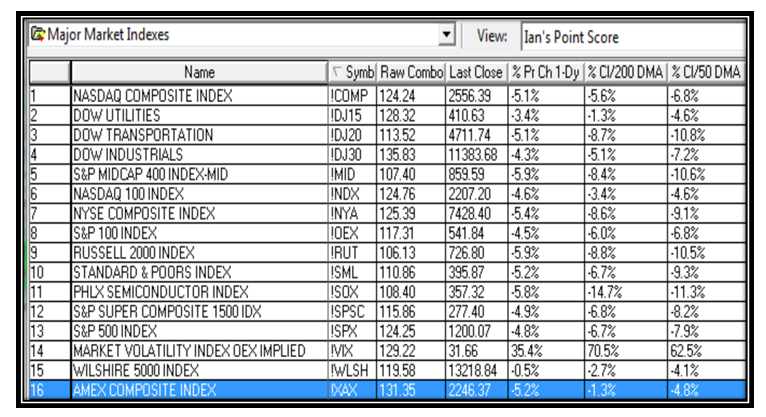
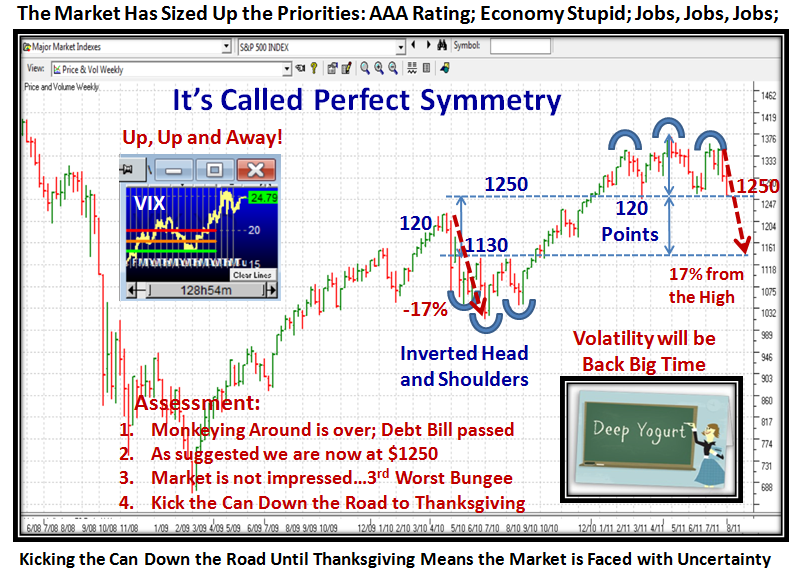
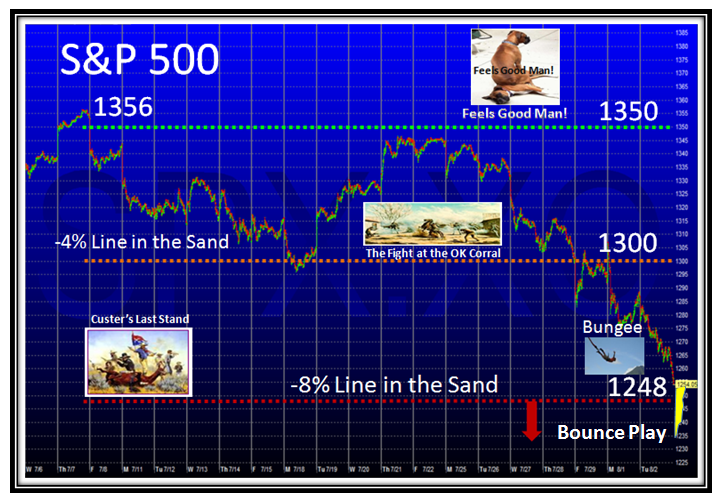
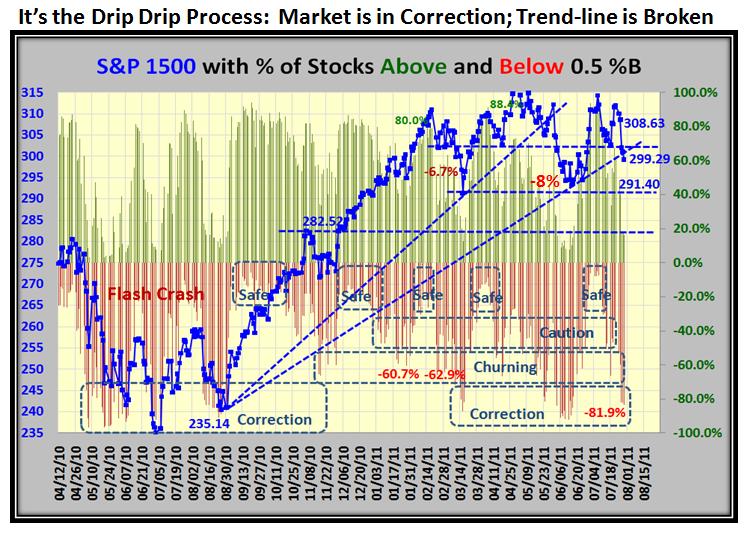
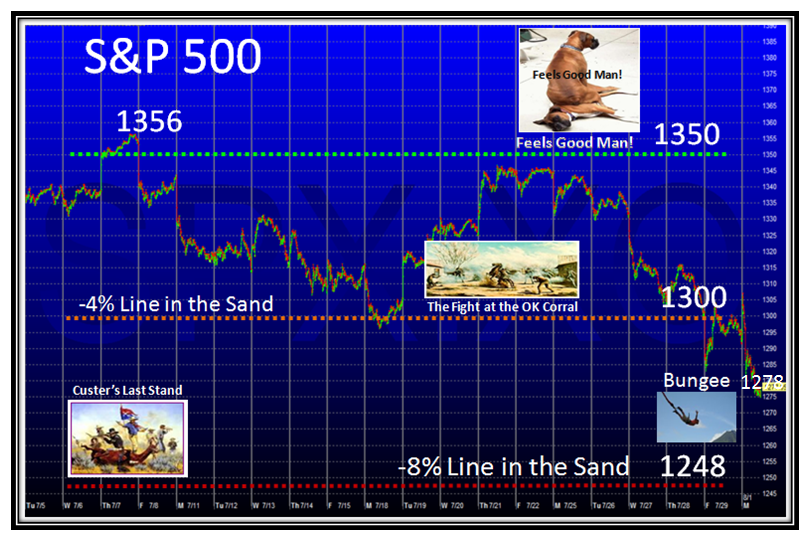
It’s no news that the Stock Market is already in the toilet, but now even the chance of a decent Bounce Play from a very Oversold Market is overshadowed by the US Credit Rating being downgraded to AAa. In any event, Markets seldom recover from V Bottom’s unless they start from less than Minor Corrections of-8%, and that invariably when the market is starting fresh rallies and not going through the topping process we have seen for the past four months. We have only to go back to the Flash Crash of 05/04/2010 to see that with a similar oversold situation it took several attempts and “fakey’s” to finally get out of the mire after four months by 09/01/2010.
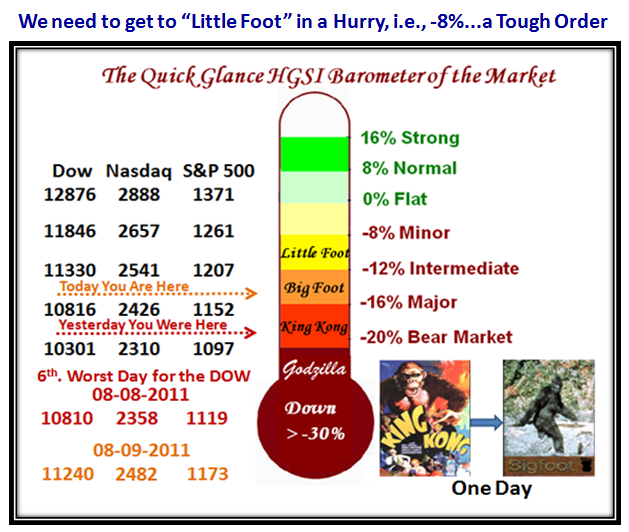
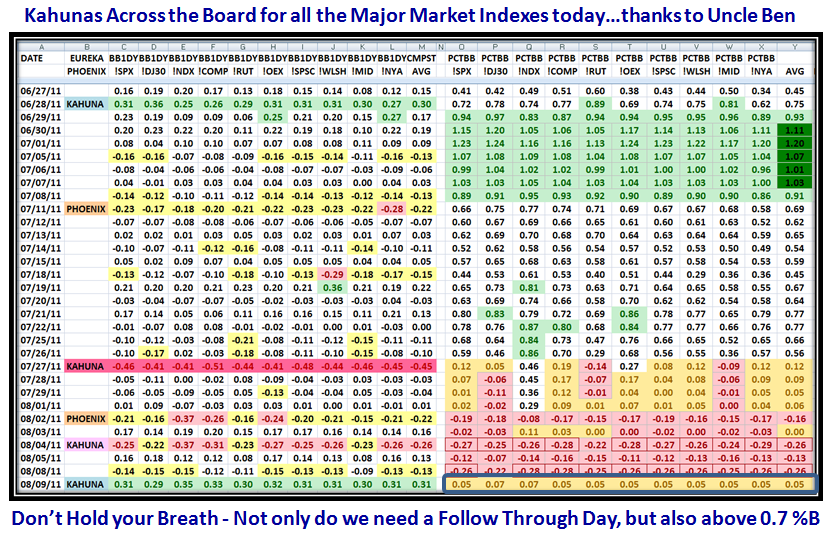
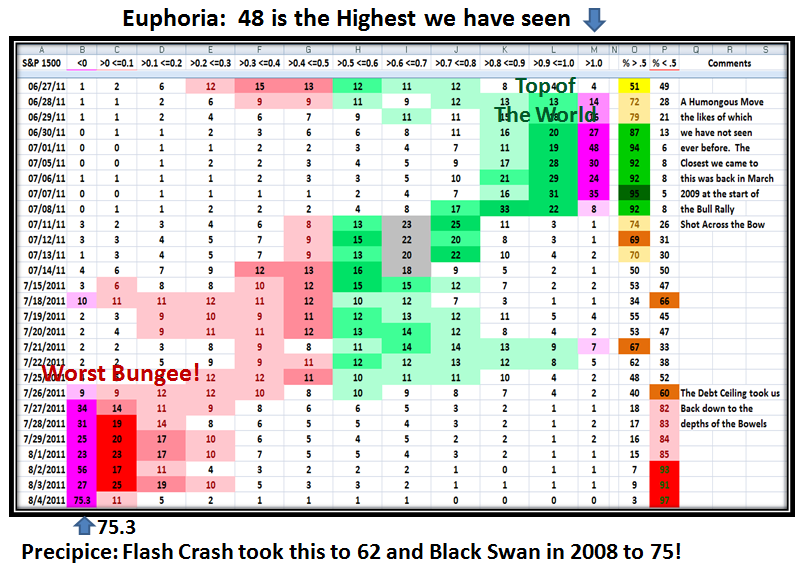
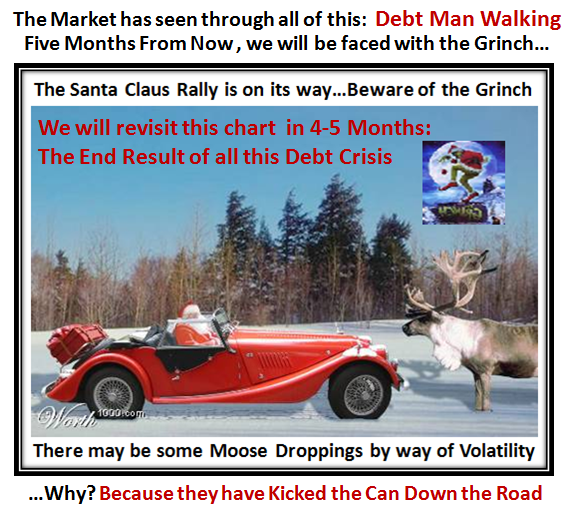
My good friend David Steckler suggested I make a Headline change to the Picture below…so with tongue in cheek, his wish is my command! See if you can spot it, but with what appears to be ahead of us this week, it fits the bill:

Many of you have responded to encourage me to keep up the good work and so I felt I should capture this moment in history to show you the value of what I see in using Bucketology to “Harness the Market with %B” at this critical juncture. Here is a synopsis of what I believe are the key values:

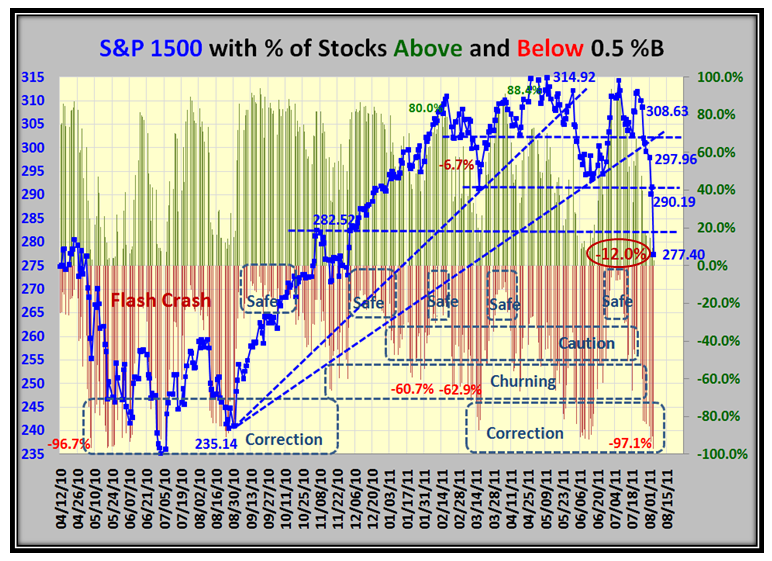
The concept of Bucketology, i.e., dividing the range of Bollinger Bands %B into 12 slices and measuring the number and/or Percentage of stocks that sit in each slice or Bucket as we call it for an Index, a User Group of Stocks or ETF’s, lends itself very well to my insistence of having three scenarios as a Market Plan and then letting the Market tell us which road it is on…the High, Middle or Low Road. Numbers are fine, but a Picture is worth a thousand words and when one can have both, life becomes far easier to manage the analysis and synthesis of the Market:

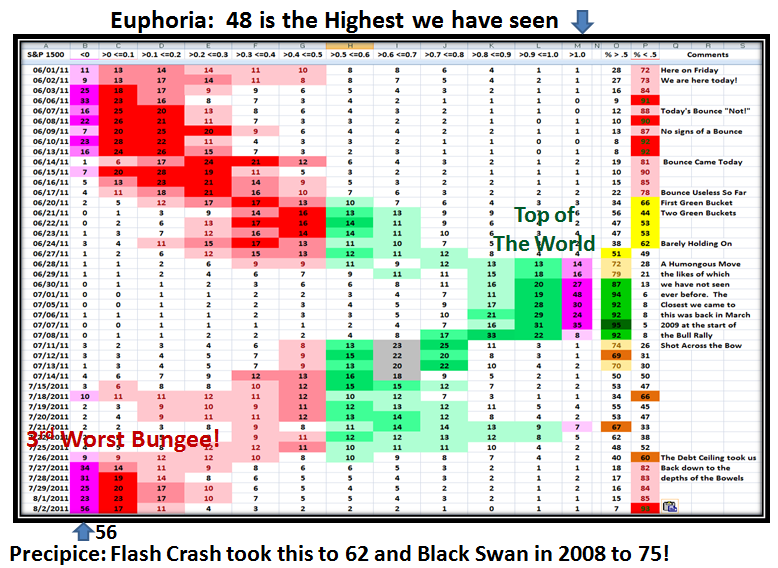
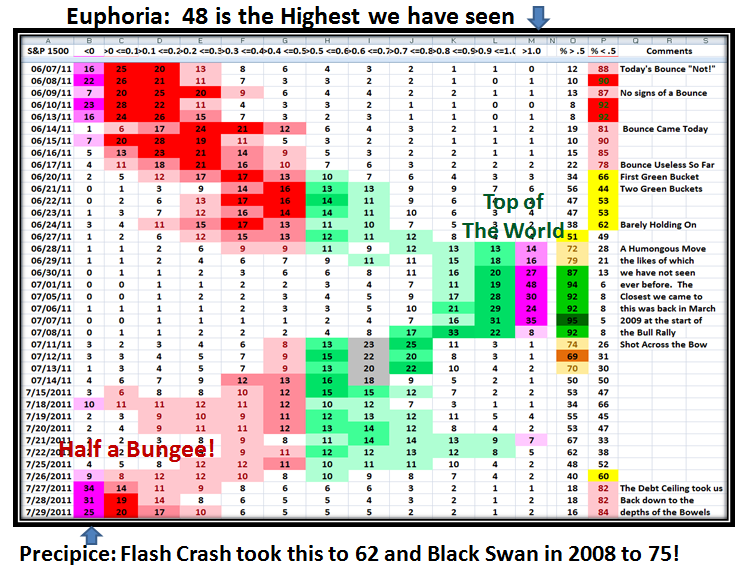
I use the S&P 1500 as the basis for most of my analysis, but as you well know I also use ten key Market Indexes in my work. I have updated the following chart right up to yesterday so that you can see how the numbers change as the days roll by. The color coding of red and green gives you the quick demarcation between below and above the Middle Bollinger Bands of 0.5, respectively. The numbers in this case are the % of S&P 1500 stocks that sit in each bucket on that day, as the Market ebbs and flows back and forth in its cycles from low to high and back again:
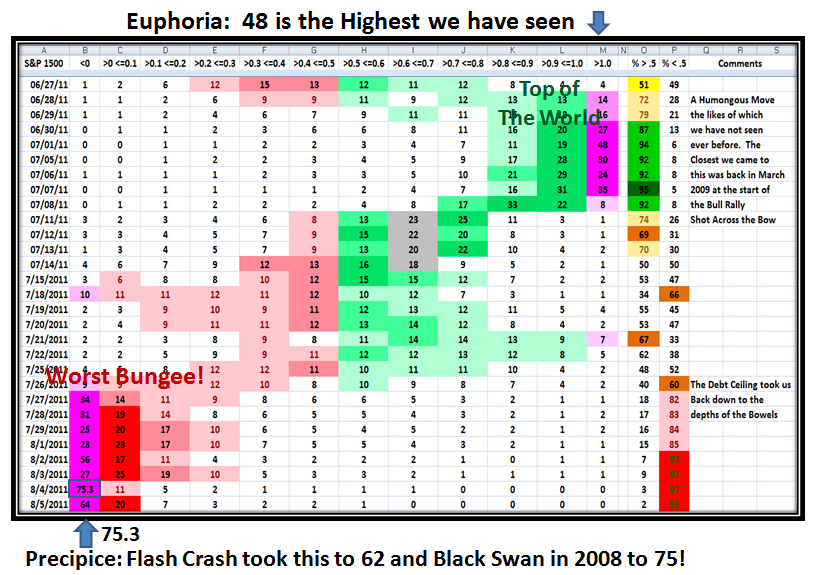
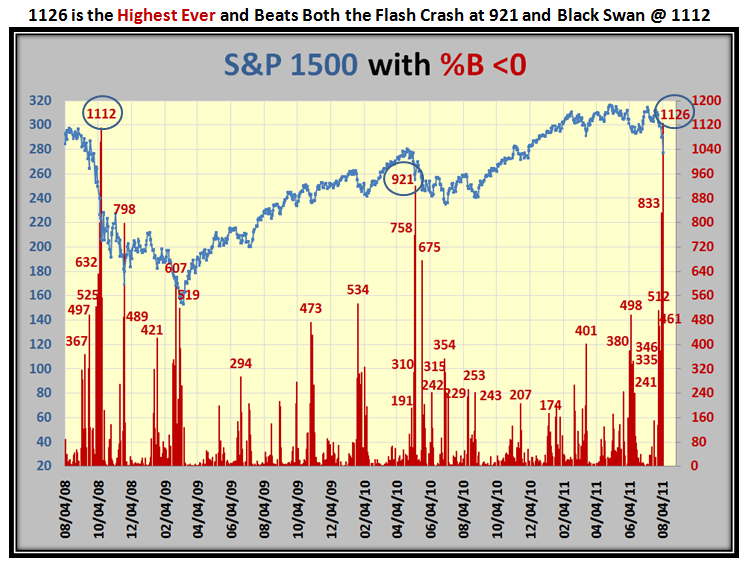
These extremes are seldom seen especially when we were at the highest momentum ever recorded on July 1 with stocks above the Upper Bollinger Band of >1.0 and the % of stocks reaching a peak three trading days later on July 7th. with a Score of 95 for Stocks above 0.5%B. Just one month later we find the Market down in the bowels of despair, with yet another record of 75.3% of stocks with %B <0, below the Lower Bollinger Band. It doesn’t take two seconds to see that the Markets are totally trashed by “Grandma’s Pies” and the numbers side by side:
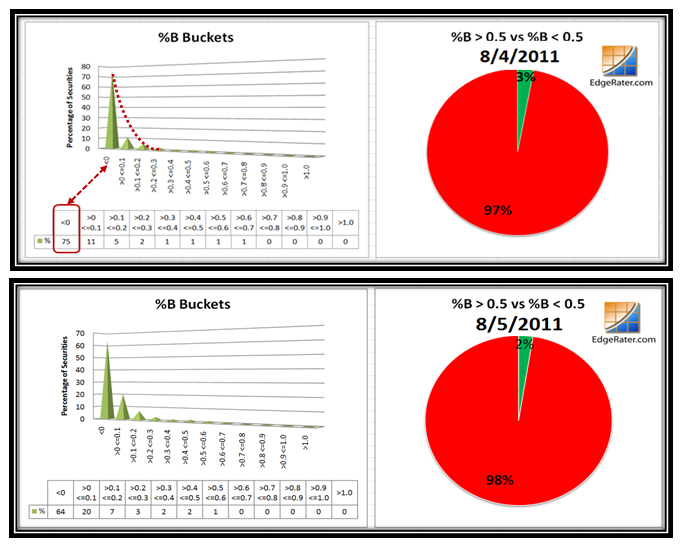
As we well know, Friday gave moment traders fits and starts with the moment to moment swings in the direction and magnitude of the moves all day, particularly on the Dow Jones Industrial Averages. Although there were attempts all day to produce a Bounce Play, it can be chalked up as a pip-squeak although there was some movement from <0 to bucket >0 <0.1 with 75% to 64%, respectively, by bottom-fishers buying beaten down stocks.
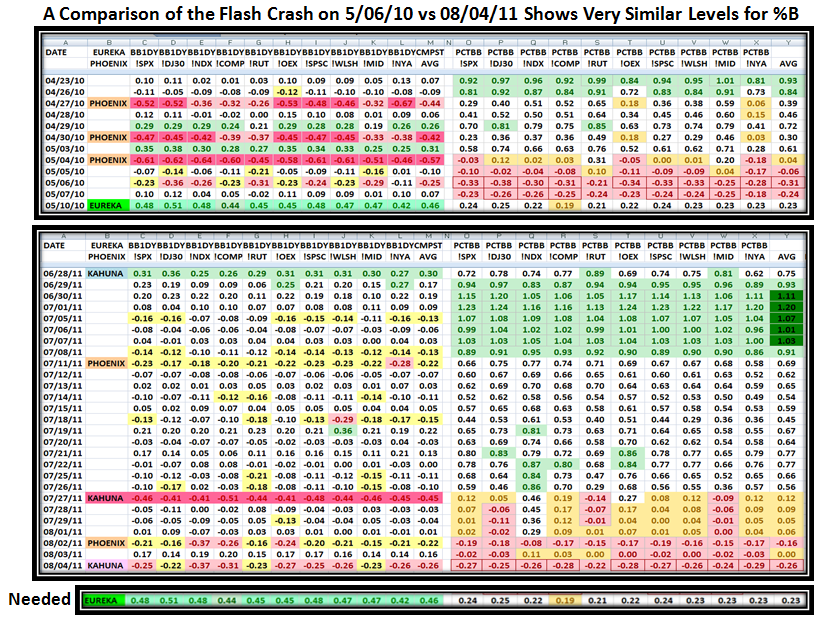
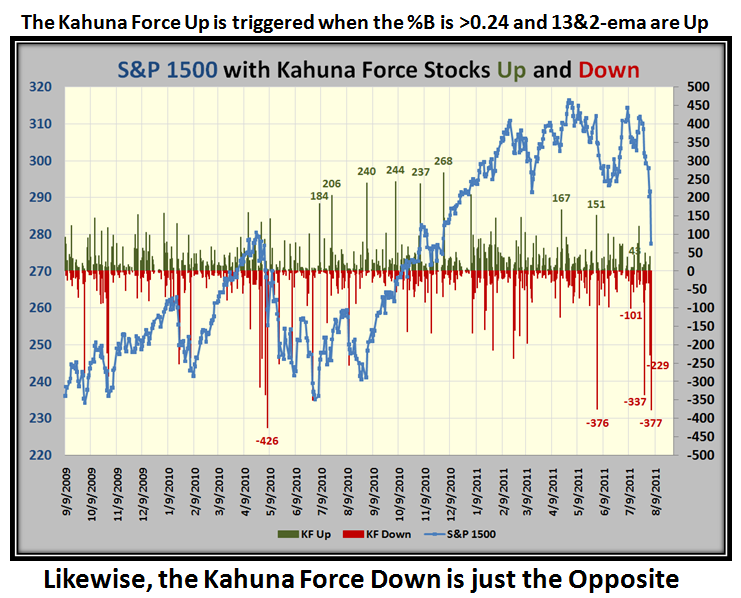
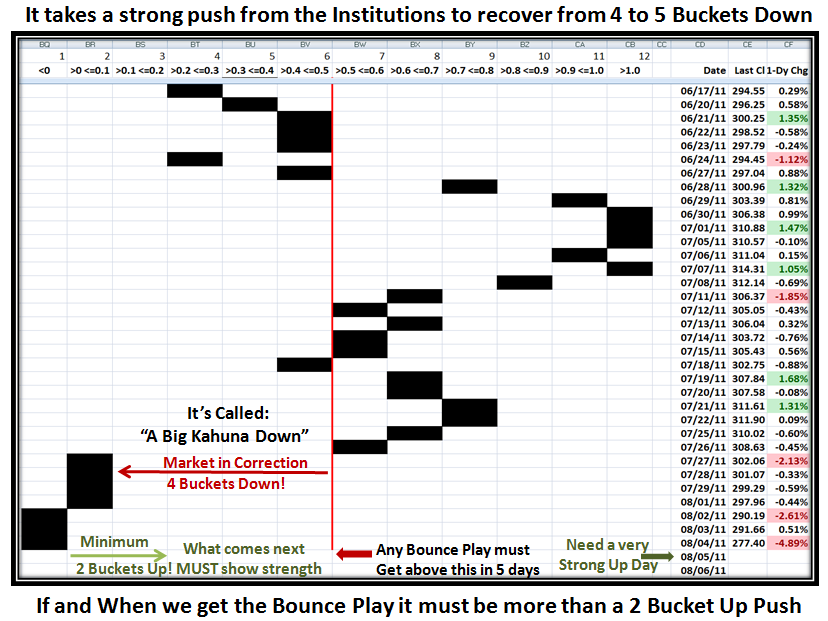
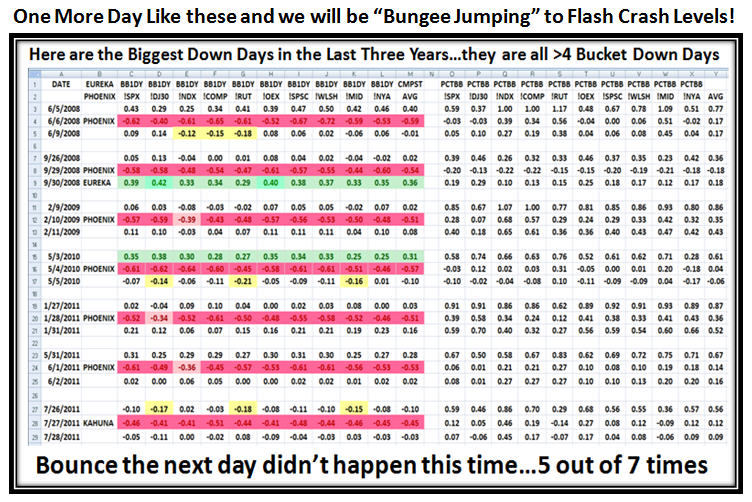
Sad to say that the news at the weekend of the downgrading of US Credit Rating by Standard and Poors will add more turmoil and pressure to the markets and could even squash any immediate attempt to give a decent Bounce Play with good momentum. Here for the record are the Kahunas both up and down for the last three and a half years. The message is at the top of the chart, but for emphasis it is worth repeating…Note that 4 to 6 Buckets Down signals a major change in Market Sentiment, and that it is most unlikely the Market will recover anytime soon:
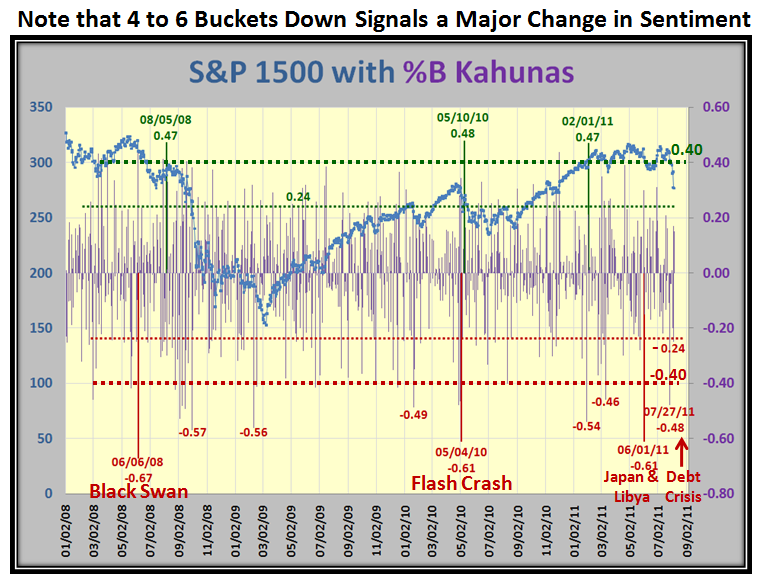
Please understand that there are two types of %B you should track…one related to bucketology for the Stocks in an Index as I have shown above in several different charts, and the other the %B of the Entire Index for the S&P 1500. They are different and as I have shown you many times before on this blog the difference betwen the two, which I call the “Purple Chart” is very illuminating.
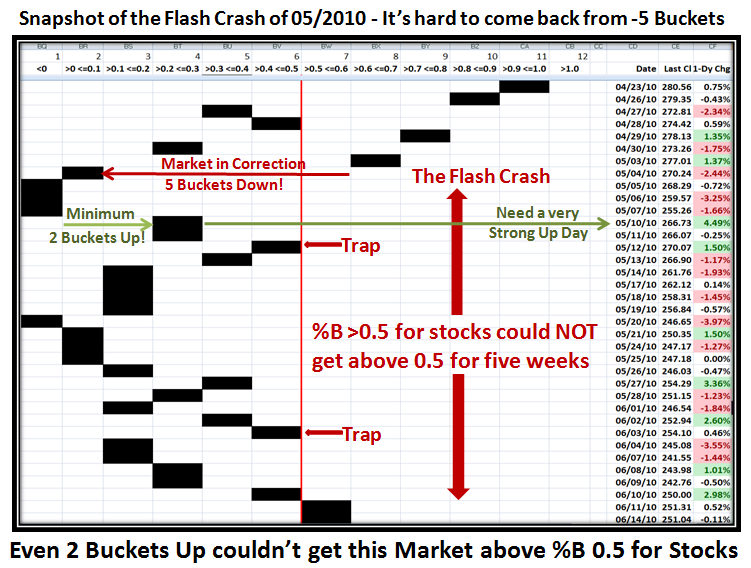
The next two charts relate to %B of the S&P 1500, one for the Flash Crash and the other right now for the Debt Crisis comparison:
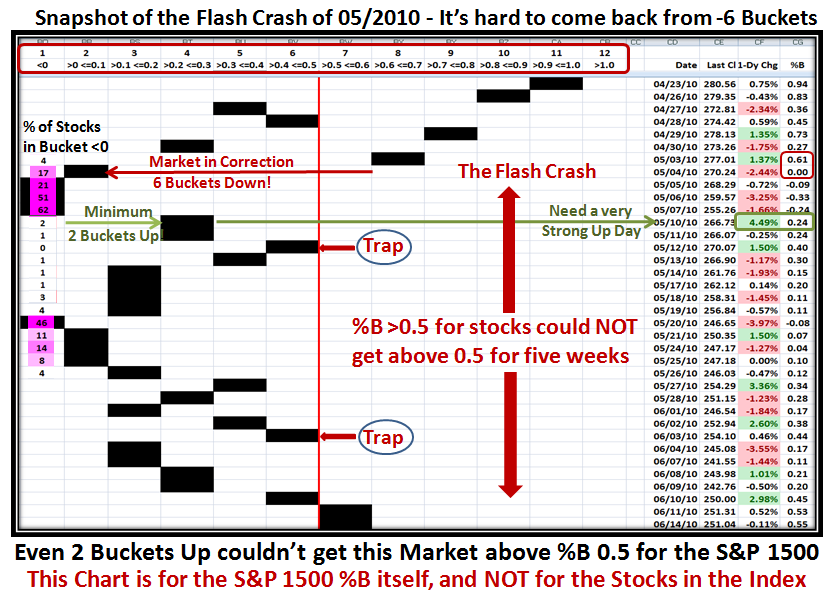
I have updated the chart I showed previously, and point you to the last column which shows the %B reading for each day. You will note that the Flash Crash took us from a reading of 0.61 to 0.00 in one day…in other words a six bucket drop, which is depicted by the Black bars dropping from and to their respective buckets.
The second thing to note is that I have superimposed the % of stocks in the first column. Note that immediately after the 62% of stocks on 05/07/2010, the very next strong up day lifted all stocks to give just a meager 2% in that column with a 4.49% gain in the S&P 1500 Price. You will also notice that within three days the %B had risen to 0.40, and immediately fell back, essentially with very little lift off…a TRAP! It didn’t take but six trading days before the Index was down in the dumpster. Also note that the second attempt also found itself trapped and as I mentioned before it took several Fakey’s before we had a fresh rally starting on 09/01/2010.
This next chart shows the pertinent flow for this recent peak and valley we are currently in. The chart shows the key PROBLEM with nearly FIVE Buckets down from 07/26/2011 to 07/27/2011 for %B of the Bollinger Bands, in ONE Day. It was a humongous drop and was the signal to get out fast! That is tantamount to the Institutions and the Herd trampling over each other to get out of the Exits.
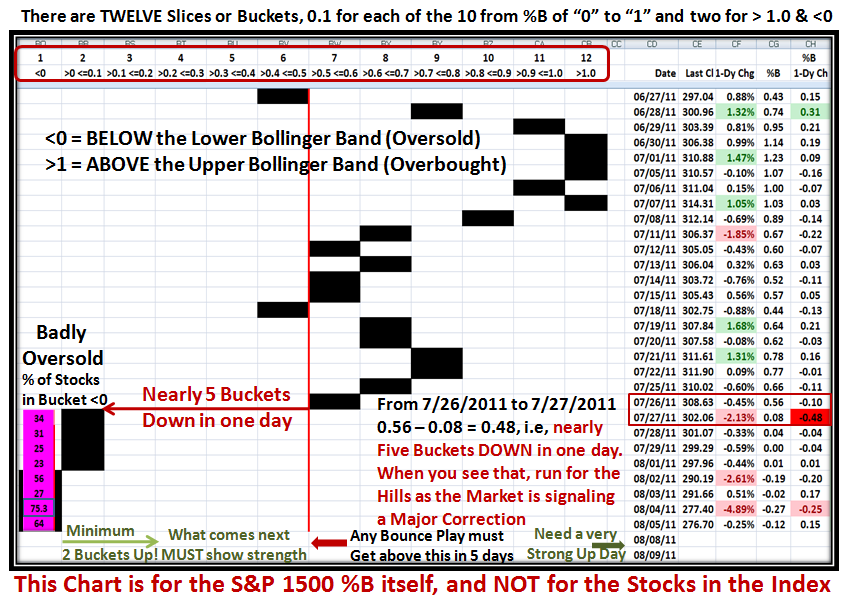
Likewise, you need a decent number of bucket skips to the upside to ensure you have the momentum and the wind at your back. However when the Market is trashed as it is now with 75.3% of all S&P 1500 stocks sitting <0, below the lower Bollinger Band, the tide is completely out and all boats are stuck in the mud until there is a sea change in the EMOTIONS of the Market, with the tide coming back in and the wind at your back to raise all boats. It takes several attempts to get back to a normal market, and so you must expect TRAPS along the way as I showed in the similar Chart for the Flash Crash. It is most unlikely we will get a “V Bottom” with the market so badly trashed.
So there you have it all in one place as to how the Bucketology concept provides the instantaneous reaction to Market Fluctuations, and that it brings into focus of what to expect in the Ebb and Flow of the Market at its extremes for useful clues to call you to action.
Best Regards, Ian.
 Ian Woodward's Investing Blog