The Gold Bubble Burst but Don’t Count it Out Yet
Monday, September 26th, 2011Bruce who is a fellow investor I have known since the days of chatting on Prodigy over 20 Years ago asked me today “Ian, I would be interested in your opinion on Gold and whether it might have bottomed. It often goes the opposite direction as the rest of the market, especially the dollar.”
I don’t pretend to be an expert in Gold, but in view of the alarming fall these past three days, I did a little research today to see if I can shed some light on the subject. This precious Metal is tops with the Middle and Far East Markets, and particularly in India of which this is an example of a shop in a Bazaar in Mumbai, originally Bombay:
If we look at the SPDR Gold Shares ETF (GLD), we can immediately see that once the shares went into a steep climax run lasting almost two months and finishing in a double top, its days were numbered. The precipitous drop came four days ago and may have been triggered by the Bubble in the price but also fueled by the uncertainty of the Greek Crisis and all the fru-frau regarding European Banks, and the Euro, which may have caused a flight to cash. At any rate, it is surprising to see that Gold may even beat the S&P 500 and the Nasdaq to a Bear Market of -20%!
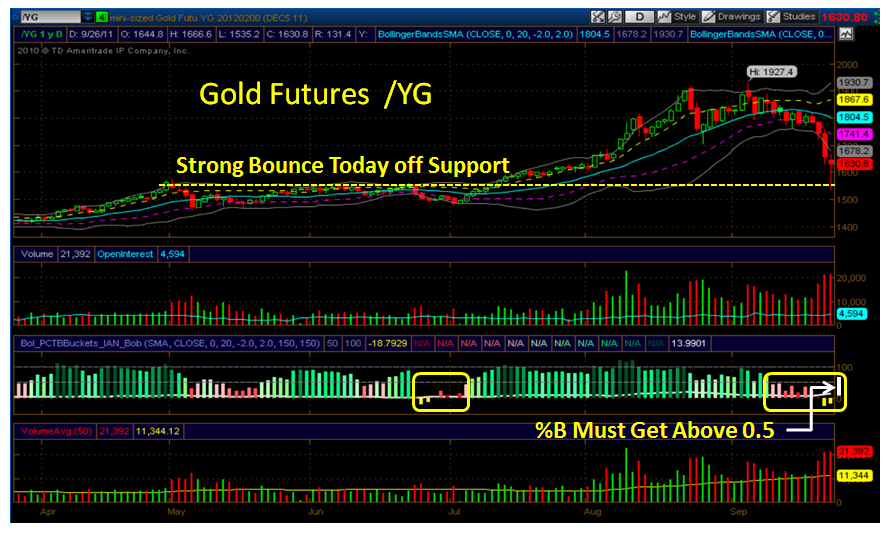
Although we woke up to a precipitous drop in Gold Futures overnight, the subsequent Bounce Play was encouraging. The damage was done the previous two days when the price gapped down below the Lower Bollinger Band, and that is what must be watched carefully. With a close to 17% drop from the recent high don’t expect a miraculous recovery…these kinds of shocks take time to work themselves out of a hole. The clue for recovery is typically a retest of the Low and a “W” Double Bottom. If the Index moves sideways inside the Lower Bollinger Band on the retest, that is a point in time when there may be a serious rally to the upside.
Looking at the recent behavior of the Gold Futures for clues to recovery, %B is down in the mire with a reading of -.1879 as shown on the chart below and I show you what to look for to get a quick recovery on the extreme right hand side where I suggest %B must get above the middle band of 0.5 in a hurry.
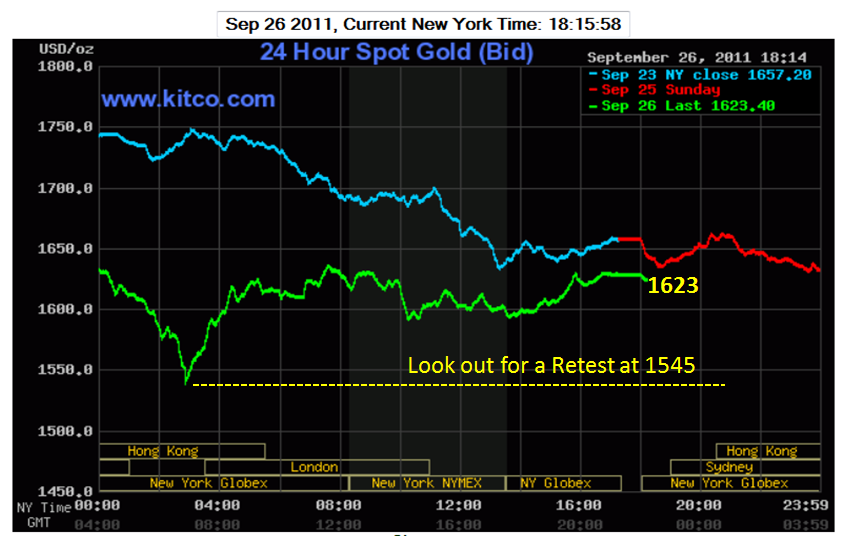
I found a good site in www.kitco.com which covers several precious metals with statistics coming out of its ears, and here is just one snapshot I captured which shows the one day performance of the Spot Gold, where you can immediately see that it got back to where it started the day, but gave up 100 points from top to bottom and back again. Note that the entire move was accomplished in the first six hours, so it ran into resistance at the 1625 level…so look for a retest of the lows somewhere along the way.
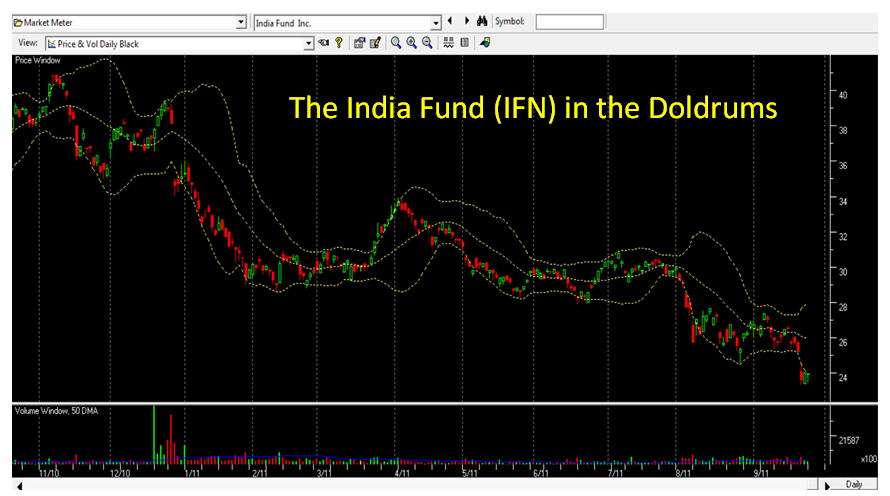
One other thought is to put yourself in the shoes of the Investors in Mumbai India. In other words, it pays to watch the likes of the India Fund (IFN) and you will see the Far East which includes China has taken a drubbing this past year. So it is no wonder that eventually this would flow over into the gold market. I don’t have to tell you that the pundits have been touting Gold 2000, and with it the super hot commodity of the year, it can surprise us all and rebound quickly.
The temptation is to jump in with both feet, but when a Security is broken it is usually prudent to wait for a base to form or at least some sign that the worst is over before you barrel in.
Best Regards, Ian.
 Ian Woodward's Investing Blog

