Ian Woodward's Investing Blog

Archive for November, 2011

Get the “Edge” with %B x Bandwidth!

Wednesday, November 9th, 2011

With the Yo-Yo Market we have tolerated these last several months, I feel that No Longer do we need the Blind leading the Blind for Short & Long Term Market Direction.

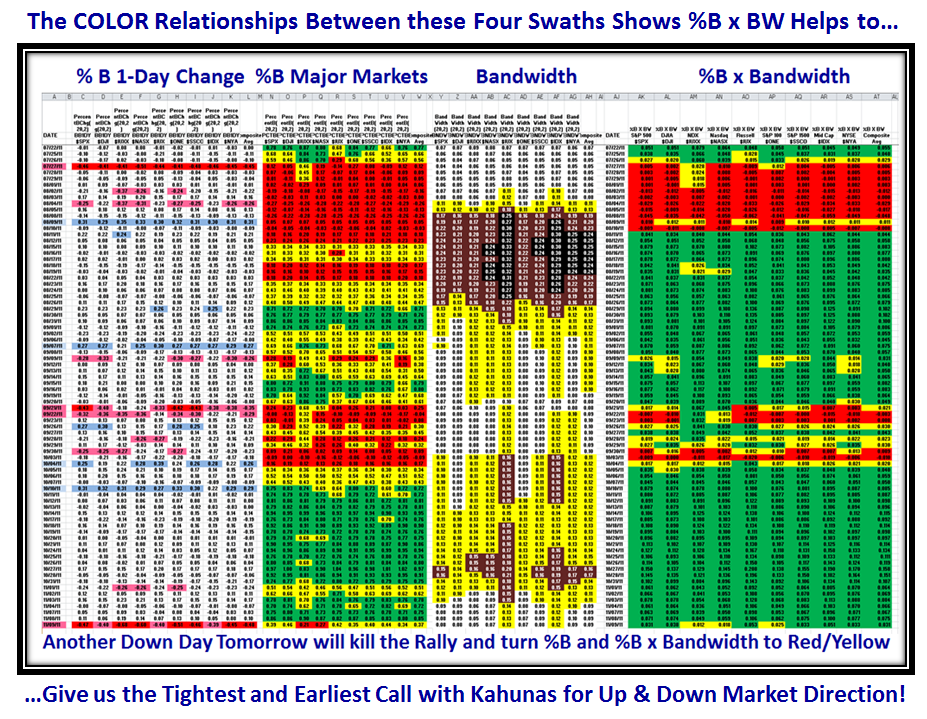
With the Help of Chris White, the CEO of EdgeRater, we now have a Template that will make life a lot easier with the introduction of a new gem which I have conjured up to find an “Edge” with %B x Bandwidth.  We will need to watch this phenomenon to be absolutely certain, but on a Day like today, there is no better time than now to introduce this new concept.  I will save that gem till the last chart in this note, but thank Chris for this improvement in the EdgeRater Template for Major Market Indexes, which makes life easy for EdgeRater and HGSI Software Users:

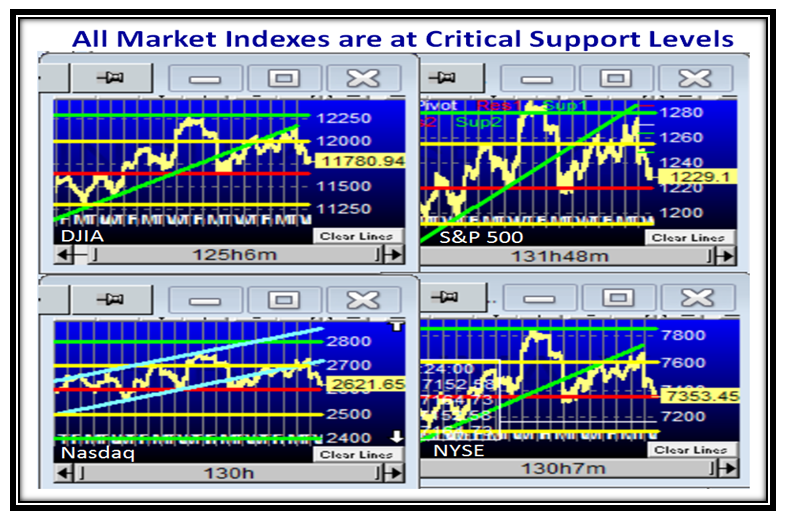
But, let’s first take a look at the hairy edge the Market Indexes are at given a huge down day from the Italy debacle.  They are all within a hairs breadth of breaking the Major Support level I described in an earlier Blog Note.

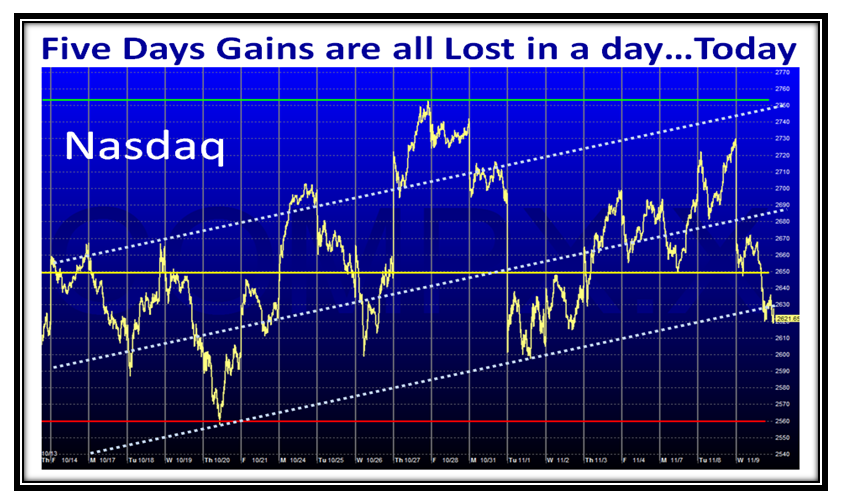
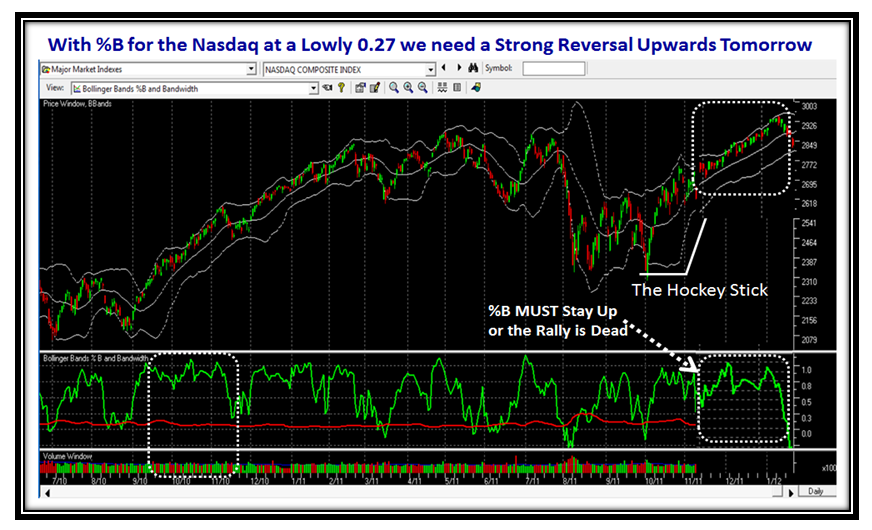
If we zero in on the Nasdaq, we see that the previous five days gains were all wiped out by today’s major drop:

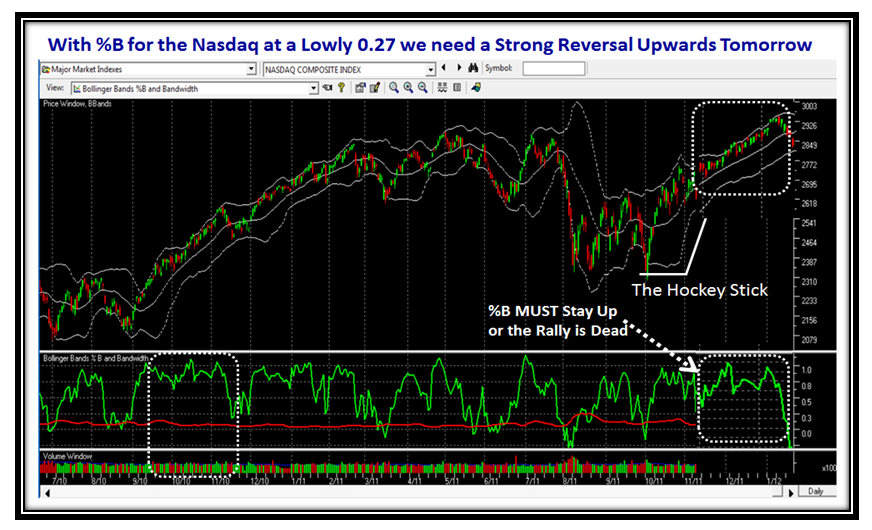
The Nasdaq along with the other Indexes took a major dumming today, ending up with a %B of 0.27…precariously low:

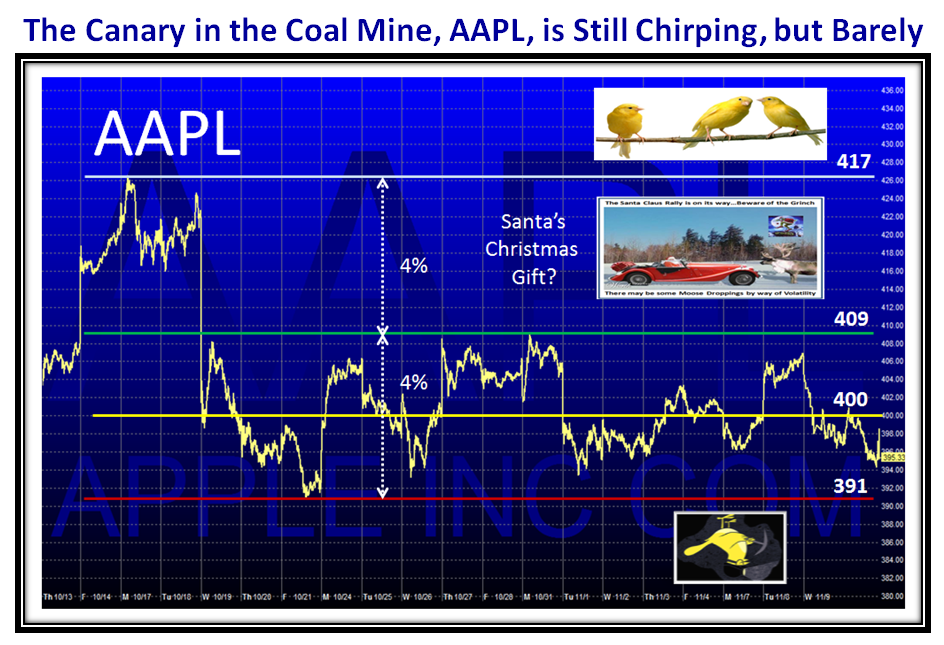
When things get really rough, always turn to the “Go To Canary” in the Coal Mine…AAPL:

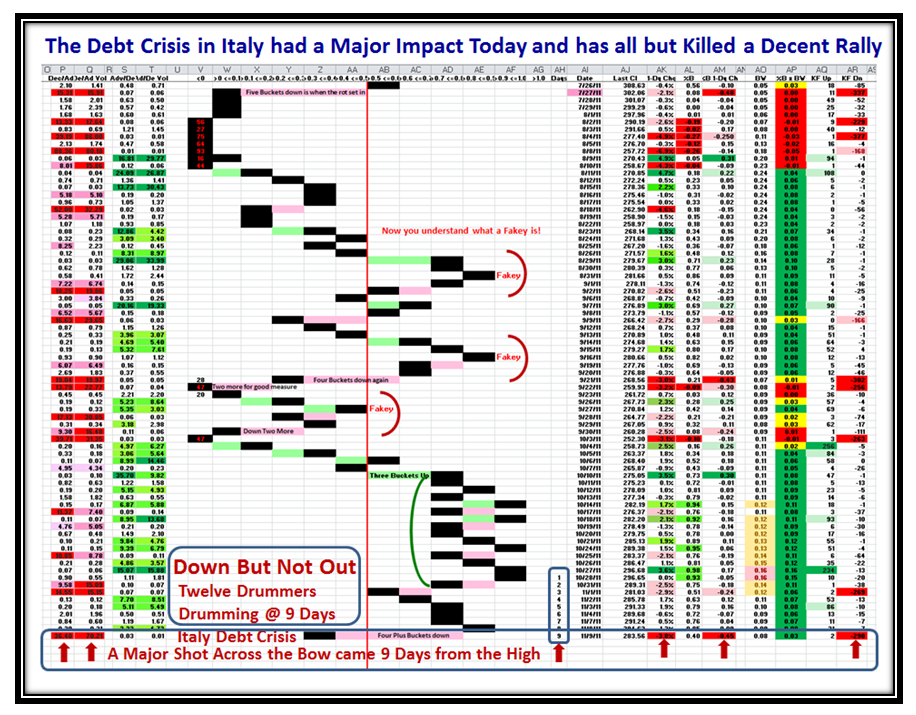
This next chart shows the Four Plus Buckets down we suffered today.  Please Note all the Red Arrows at the Bottom of the Chart.  So far we have had nine days from the high, so the Signal of “within 12 days that the Drummers are drumming” for an expected correction seems to have come through once again.

The Hockey Stick formation has formed so far, but it is obvious it is in jeapordy and tomorrow will determine whether %B breaks down through the bandwidth or can hold and return to its original glory of staying above the Middle Bollinger Band, with %B >0.5:

…And last but not least, here is the chart I promised you at the beginning.  Study it well and let’s follow what transpires:

Many thanks to Chris White for this Template which makes life easy to follow with regard to Market Direction with hopefully the earliest calls both up and down.  Note the Kahunas on the Left in Red and Blue coupled with the change in color with %B x Bandwidth on the right hand swath for the earliest calls.

Best Regards, Ian.

Stock Market: Bonuses vs Jobs

Saturday, November 5th, 2011

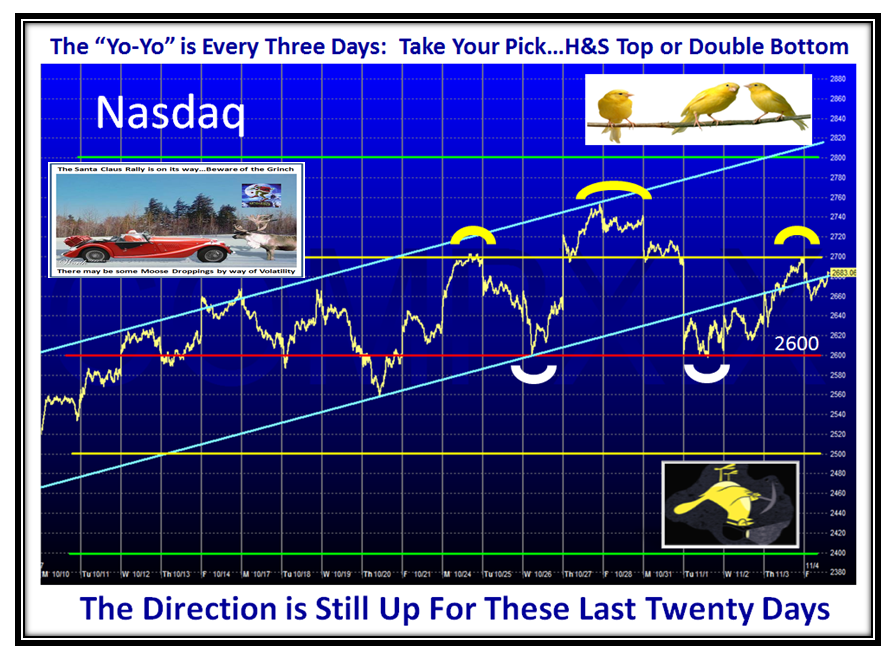
With the Constant Yo-Yo we are tolerating of three to four days up and down in the Stock Market these days, the only worthwhile Game Plan is to play it both ways to that tune.  The Large Players don’t want to see this Market fall right now, especially when they can taste their bonuses.  Yet the Global status of the Debt Crisis pokes its head up every few days to trot the market down.

Seasonality suggests we now look forward to the Thanksgiving and Santa Claus Rally, and that is not a bridge too far.  However, the Greek and Super Committee gang of twelve provide the current dark clouds to potentially spoil the fun.

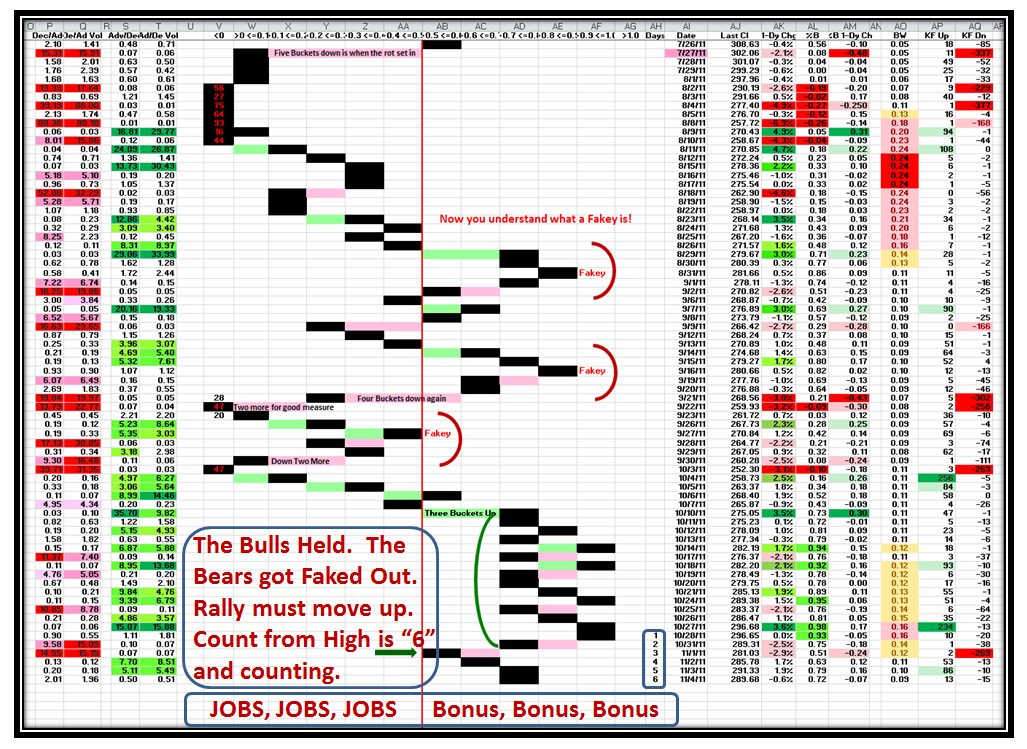
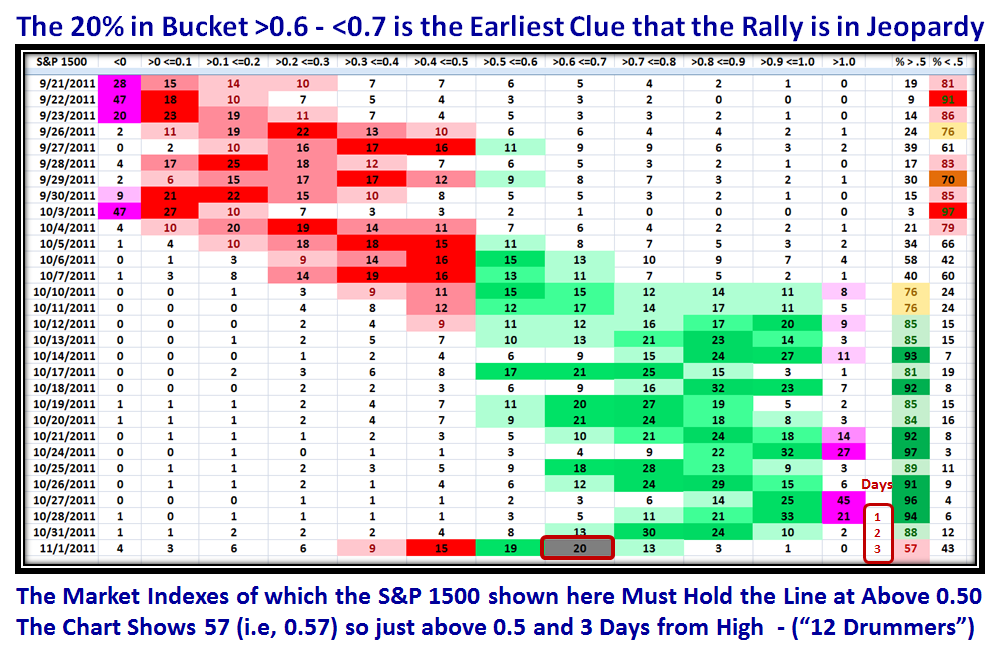
The Bucket Brigade is still flying high to keep you on the right side of the Market since the Rally began.  The twelve Drummers Drumming Scenario is half way with a count of six.  For those who do not recall, the market will break %B 0.5, or the Middle Bollinger Band or the 20-dma line…take your pick, usually within twelve days.  When the internals are this strong, any correction is short lived unless there is a Major Surprise of negative news.  We are back in safe territory sitting with %B of the S&P 1500 at 0.72, so we have a decent cushion.  We want to see the Index trot up higher and beat the recent 0.98 reading on 10/27/2011 for the count to get reset.  I’m sure you know how to read this chart by now…Arms ratios on the Left, Bollinger in the Middle and W&B on the right, but the latest “Good Stuff” is in Red circled in Blue :

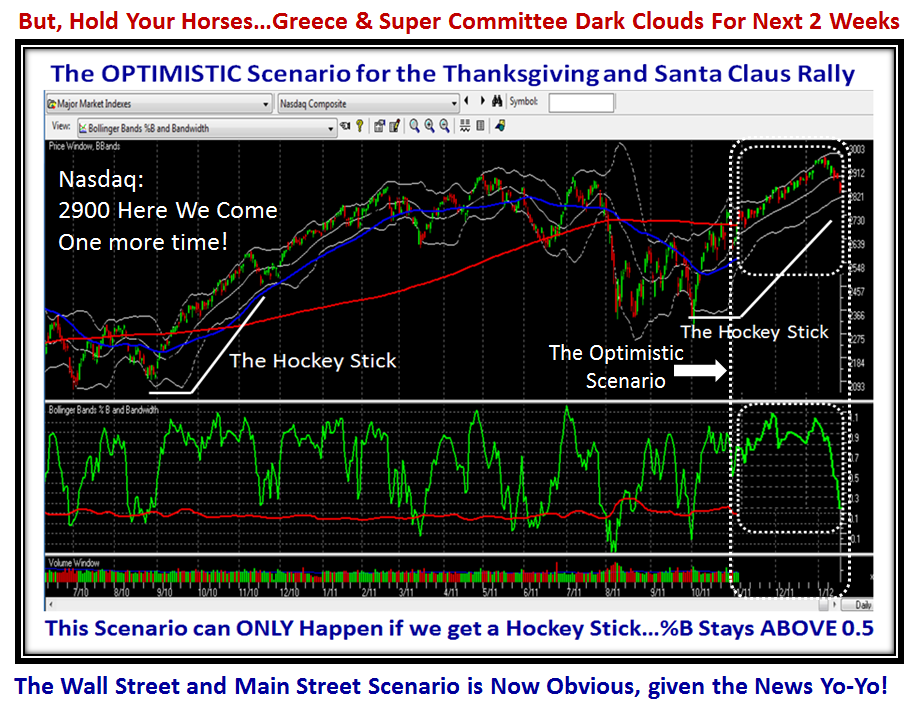
So here is the Game Plan for the OPTIMISTIC Scenario that takes us into the New Year.  In a couple of words “Hockey Stick”:

Net-net:  As long as %B for all the Indexes, of which the S&P 1500 is a typical Surrogate, stays above 0.5 and preferably 0.7 the Rally is safe and we head into a Santa Claus Rally.

Best Regards, Ian.


Stock Market: The Opera Diva is Rehearsing

Tuesday, November 1st, 2011

Tonight as I write this note after two big down days in the Market, the Rally is on the hairy edge.  The Diva is Rehearsing, but not Singing yet!

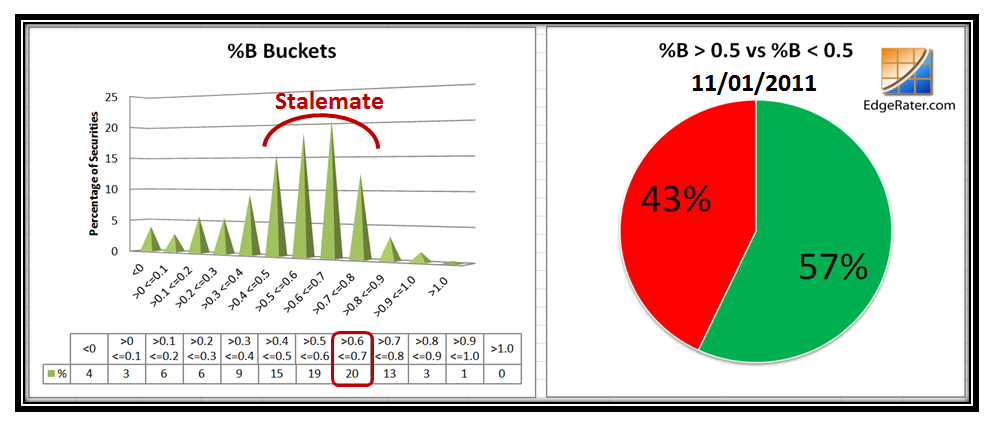
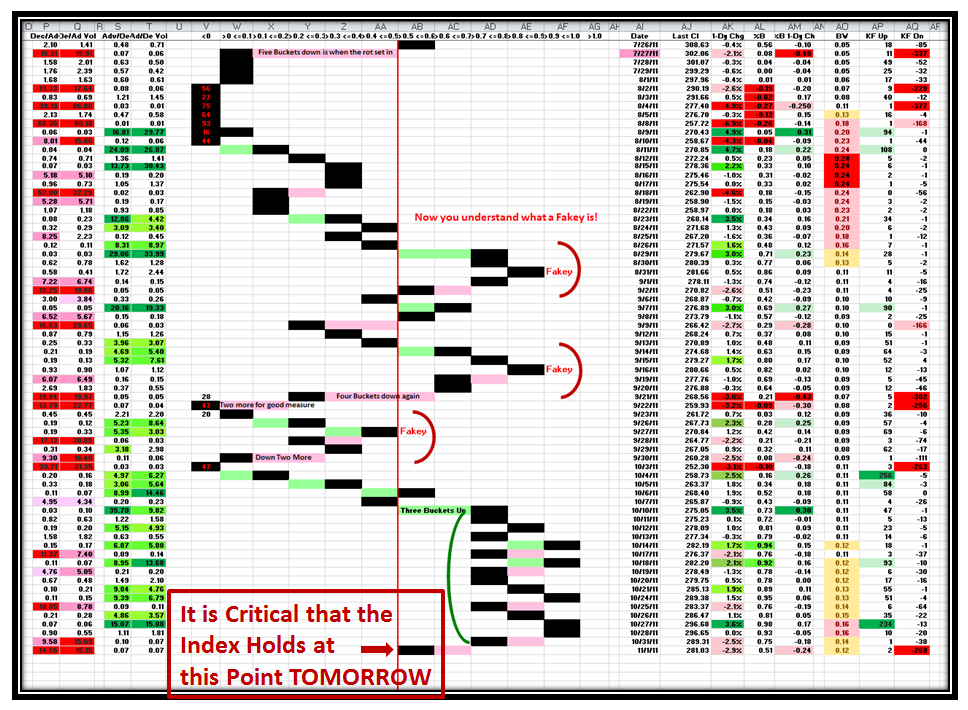
The following three charts are self explanatory to explain why this Market must respond strongly to the upside Tomorrow to keep the spark alive:

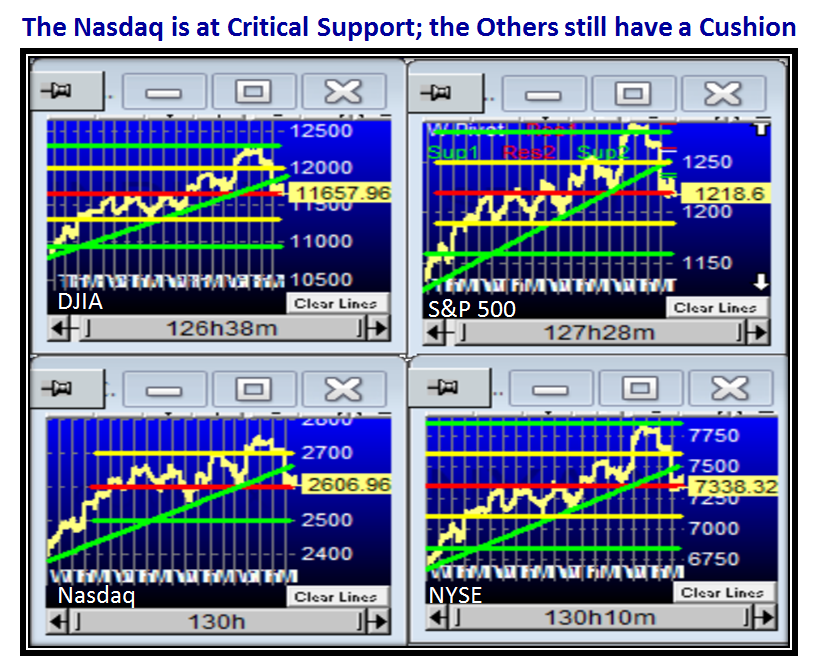
Now let’s turn our attention to where the DJIA, S&P 500, Nasdaq and NYSE sit relative to their Critical Support Levels:

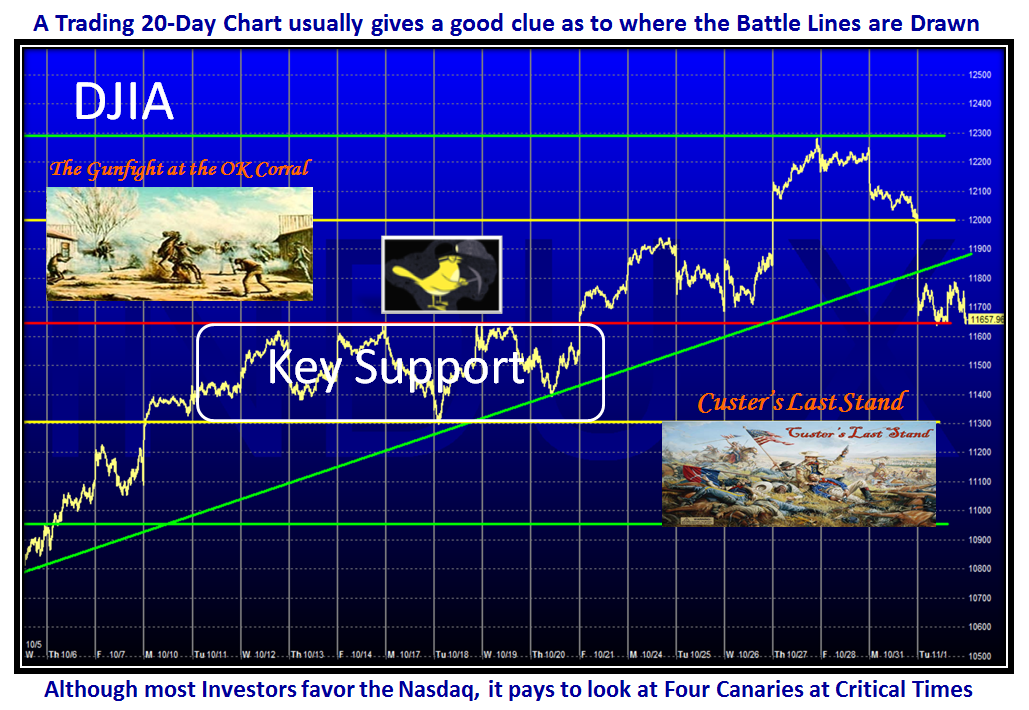
Let’s look at them one at a time to understand the degree of “Cushion” each has before the floodgates open to the downside.  Here is the DJIA:

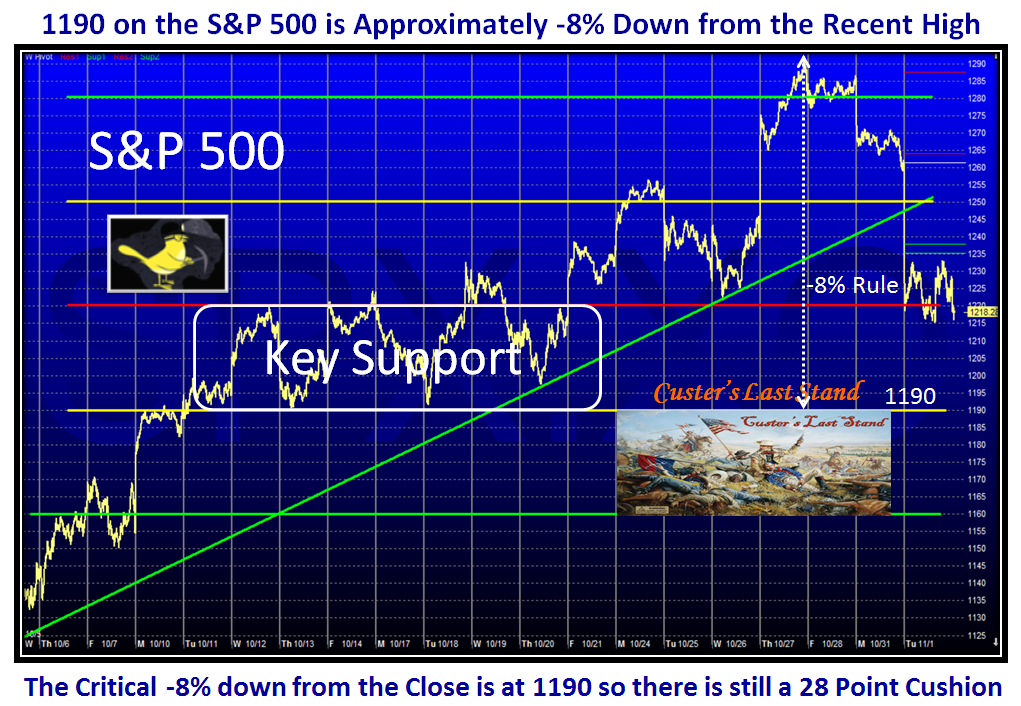
The S&P 500 also has a Cushion, as we watch critical support and the distance from the high of -8% for the point at which the Index must turn up:

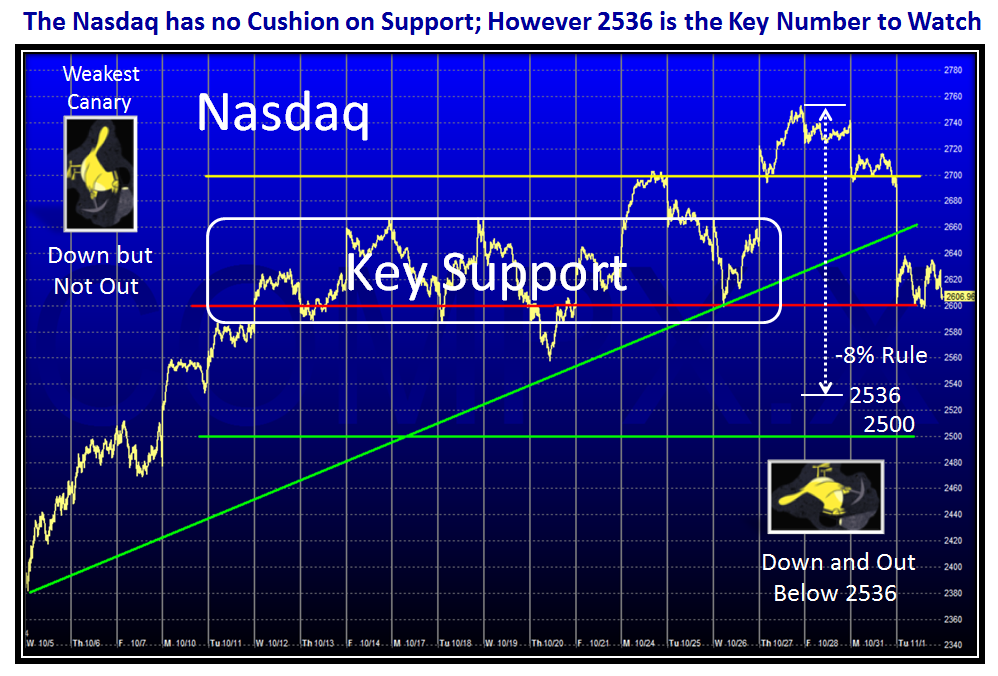
The Nasdaq is at the Critical Level…any lower and it will be the Canary in the Coal Mine that has rolled over first of the four Indexes featured:

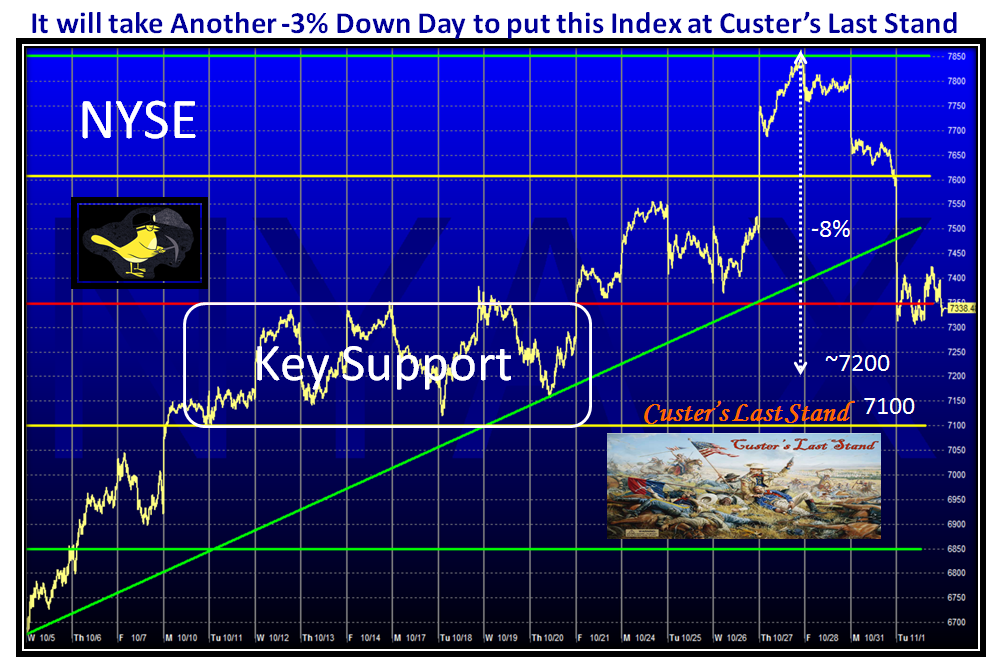
…And lastly we have the NYSE which like the DJIA and S&P 500 have Cushion.  So we have three still safe and one in jeopardy:

So there you have it, with Canaries in the Coal Mine, %B at a Critical Level, and needing a Strong Bounce starting tomorrow or this Rally is finished for now.

Best Regards, Ian.


Copyright © 2007-2010 Ian Woodward
Disclaimer: Commentaries on this Blog are not to be construed as recommendations to buy or sell the market and/or specific securites. The consumer of the information is responsible for their own investment decisions.