Reading the Tea Leaves with %B x Bandwidth
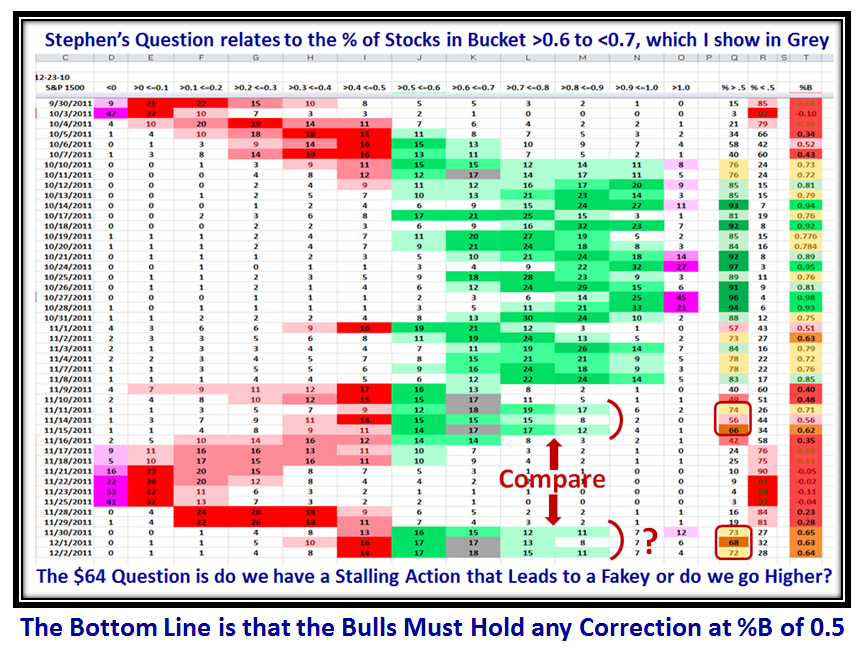
Stephen asks an astute question at a critical point in this Rally:
Ian or anyone,
We have a sea of green on the %B x %B Bandwidth chart. This is good. Is the fact that the %B chart is showing us a Sweet 16 condition a reason for concern or does the sea of green override this concern?
Stephen
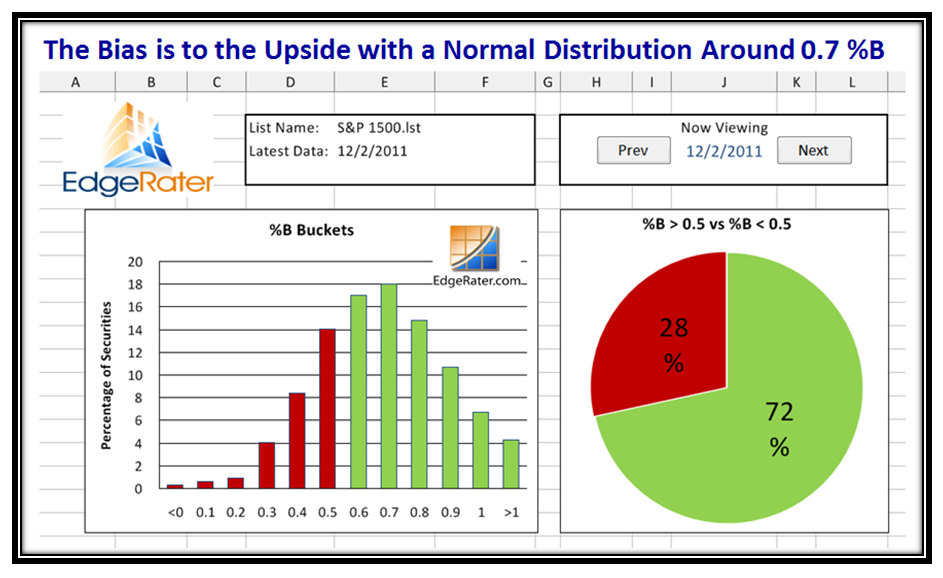
I’m watching the golf while putting this together so I hope that the pictures speak for themselves:
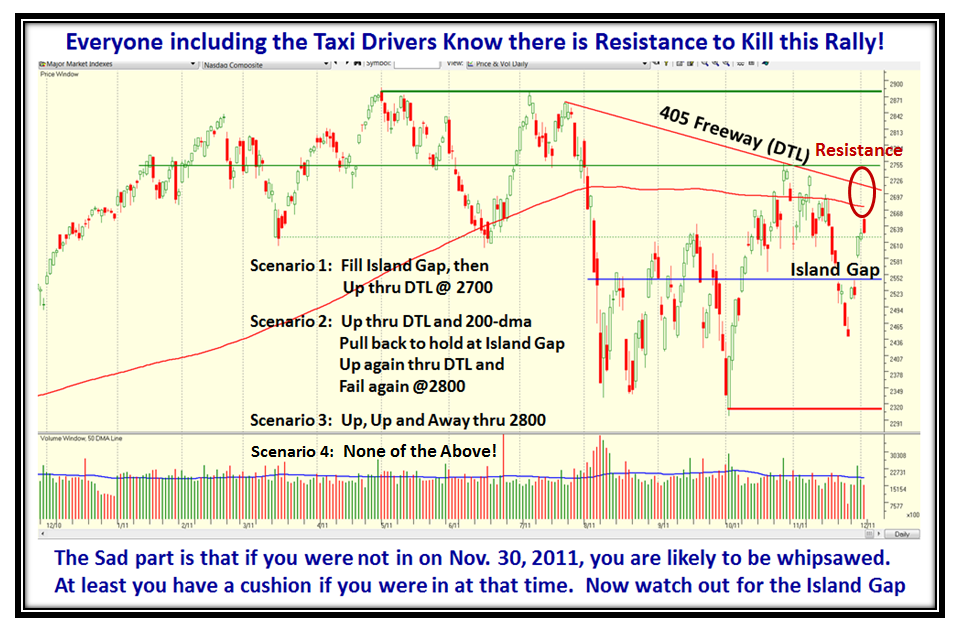
We are at that stage where we are Pausing to Refresh, sitting with an Island Gap below us which is asking to be filled. The Rally is at a vulnerable point where the promising move so far can turn out to be a Fakey or the Bulls are determined to make this a meaningful Santa Claus Rally:
Understand that it is hardly ten days ago that we were in the dumps with 53% of the S&P 1500 Stocks below the Lower BB. So this rise has been meteoric to say the least, and thereby lies the concern…too far too fast?
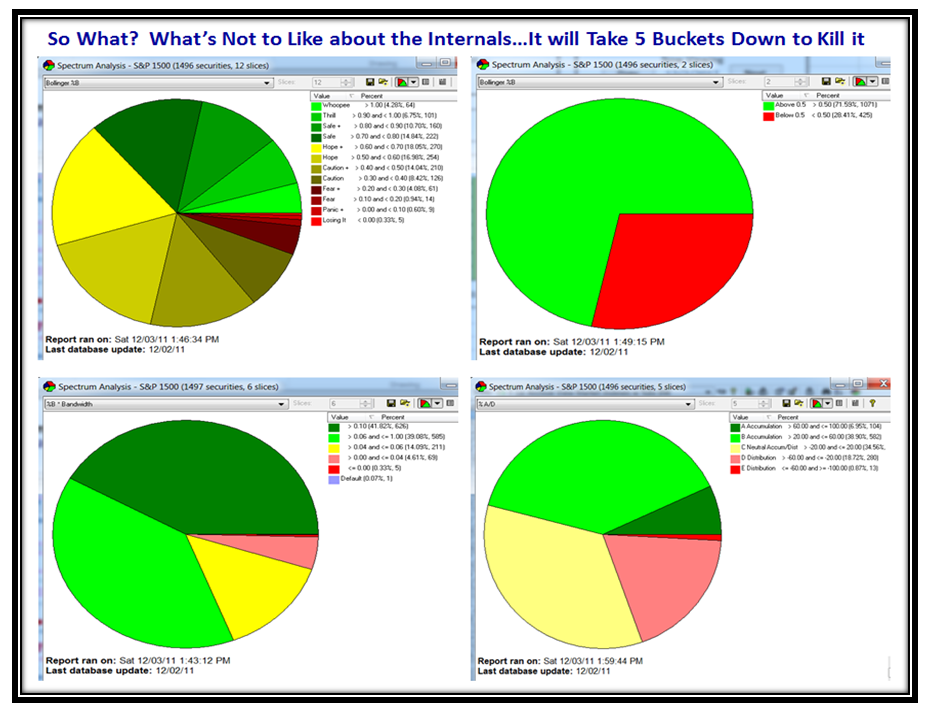
As a result, the internals are all looking rosie:
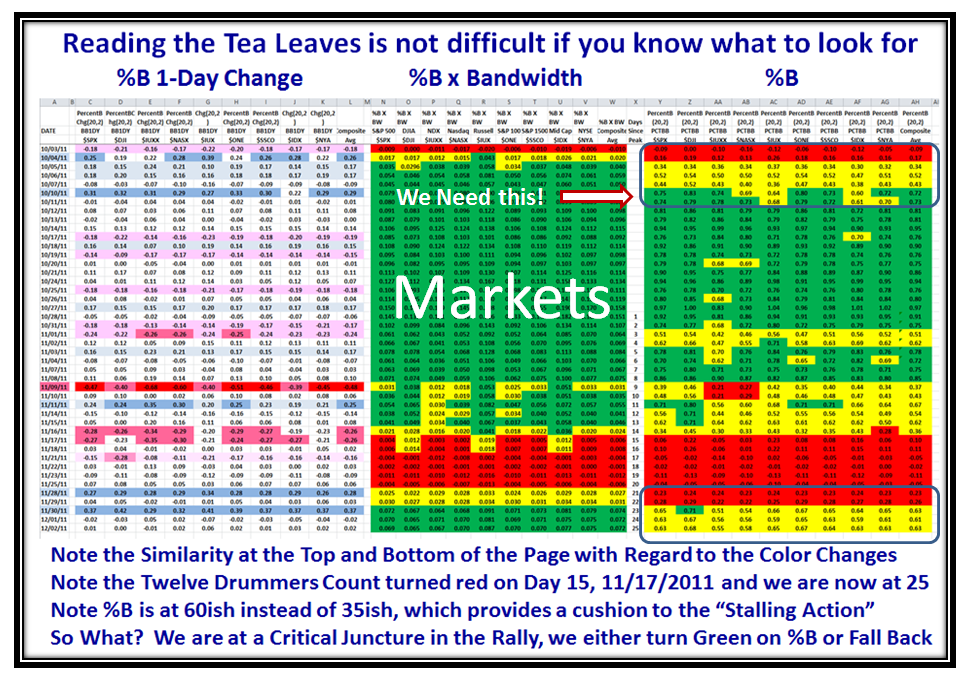
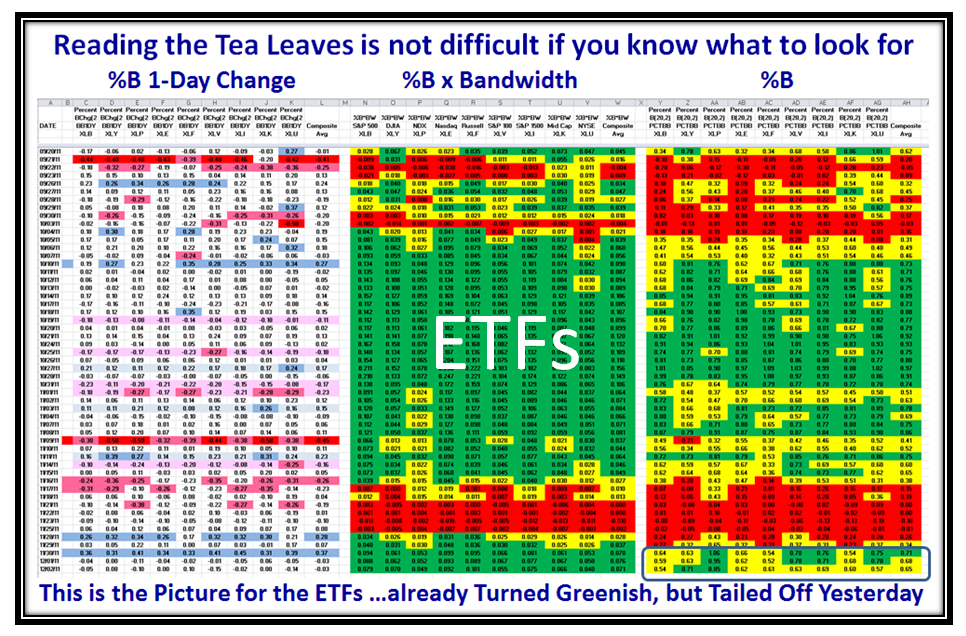
Don’t worry about reading the numbers, just look at the colors and my comments on the next two charts for Markets and ETFs:
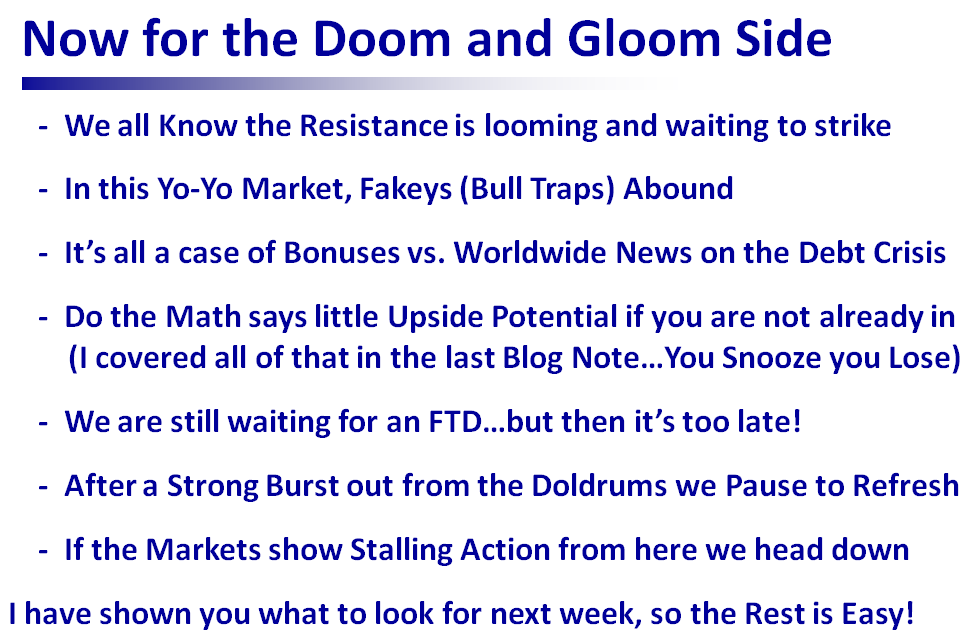
Net-net: Next week’s action is crucial to deciding whether we continue or have yet another Fakey to contend with. Now for the Dark Side of the Equation:
And Finally, Watch for the Island Gap to be filled, or we trot on up to attack the resistance at the 200-dma one more time:
Best Regards, Ian.
 Ian Woodward's Investing Blog