Ian Woodward's Investing Blog

Archive for April, 2012

Stock Market: Bounce Play on Stellar Earnings

Sunday, April 29th, 2012

The Stock Market bounced back with excellent Earnings reports from AAPL and AMZN to mention two and now we are in a quandry as to whether this is the start of something big or we fall back into the doldrums and head down once more:

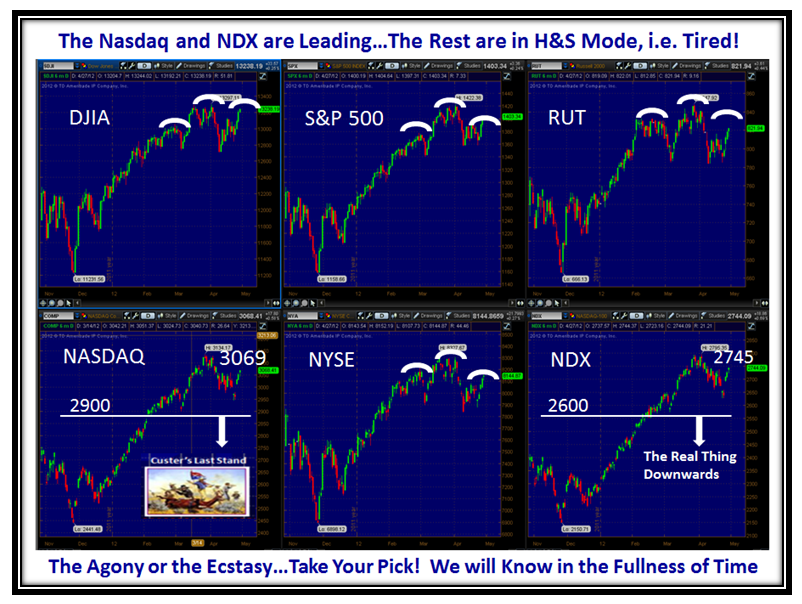
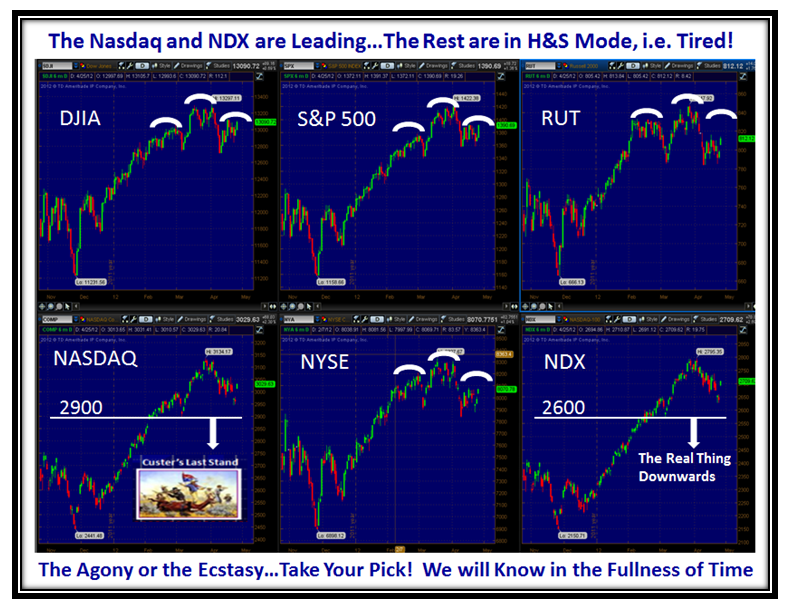
Although the Market Indexes are a stone’s throw from their recent highs, we also see ominous signs of Head and Shoulders Tops, so we shall see if the bounce of the last three days will continue or fizzle out:

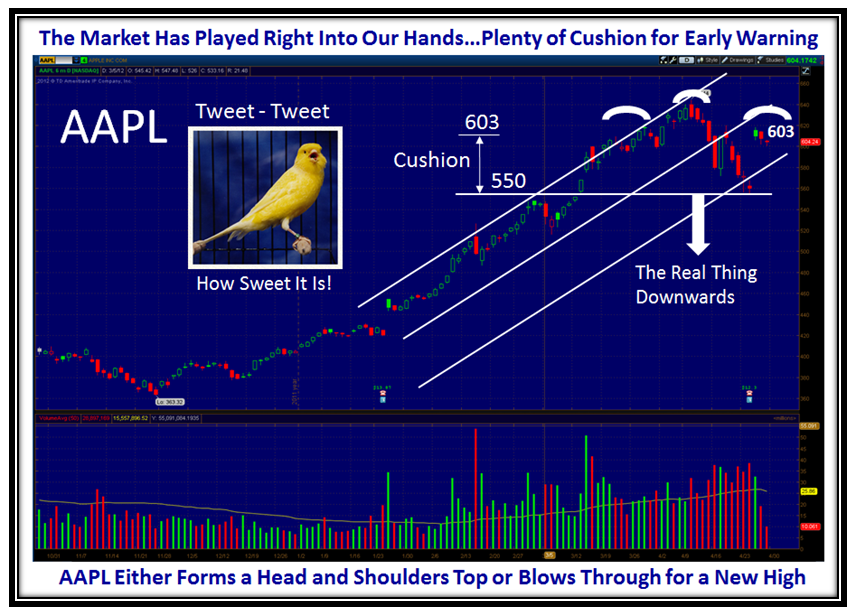
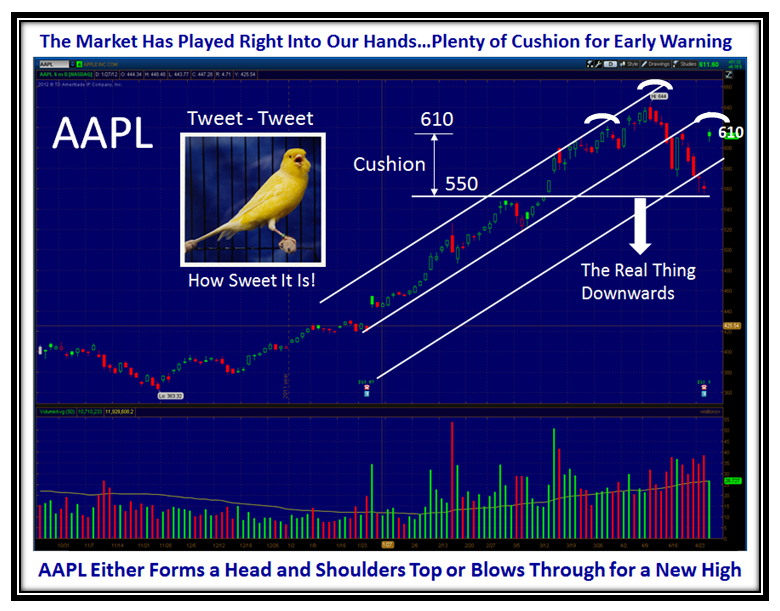
The extent of the Focus on AAPL is unprecedented, so it is a natural “Go To” for the Market direction:

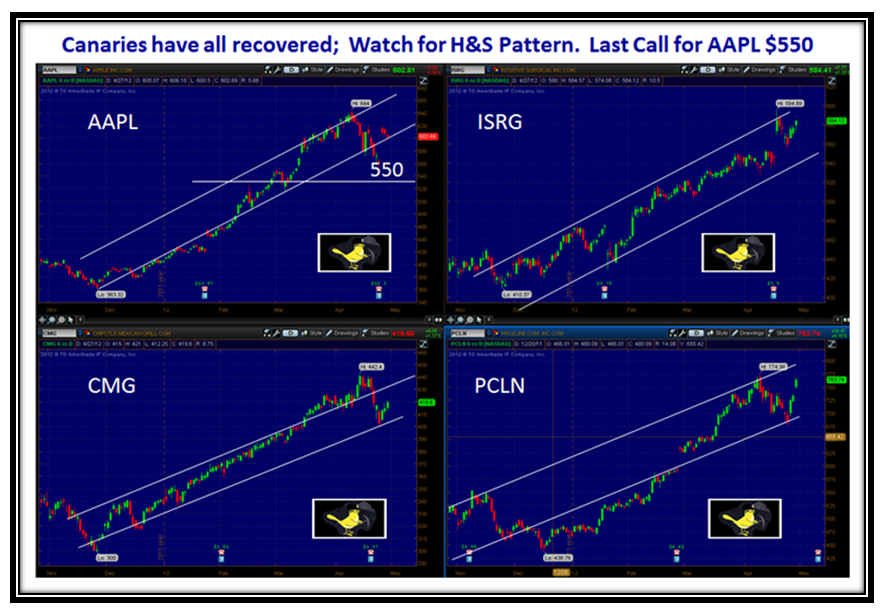
The Canaries are all chirping again, so we have another yardstick by which to judge the Market direction:

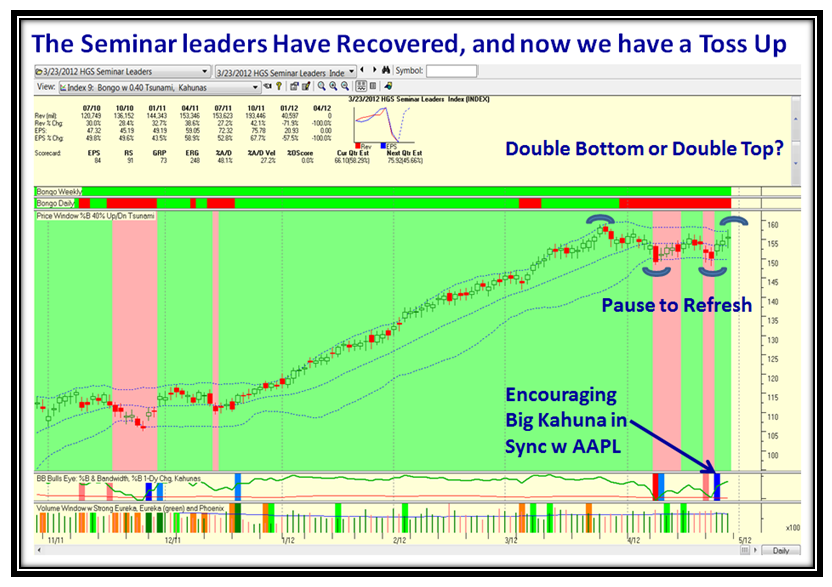
The Seminar Leaders are back in business and again we are faced with a Double Bottom or a Double Top:

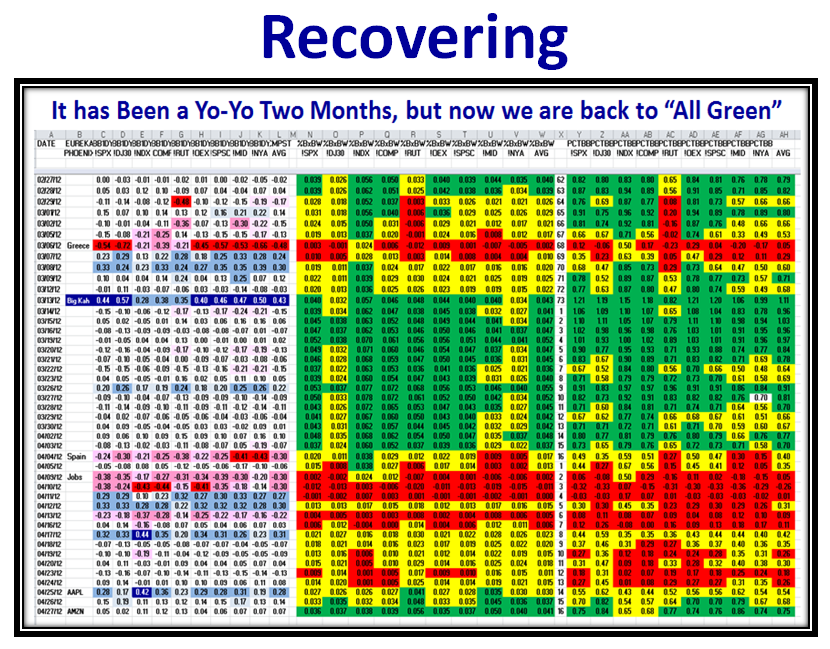
Let’s look at other signs of Recovery… Back to green on the Indexes:

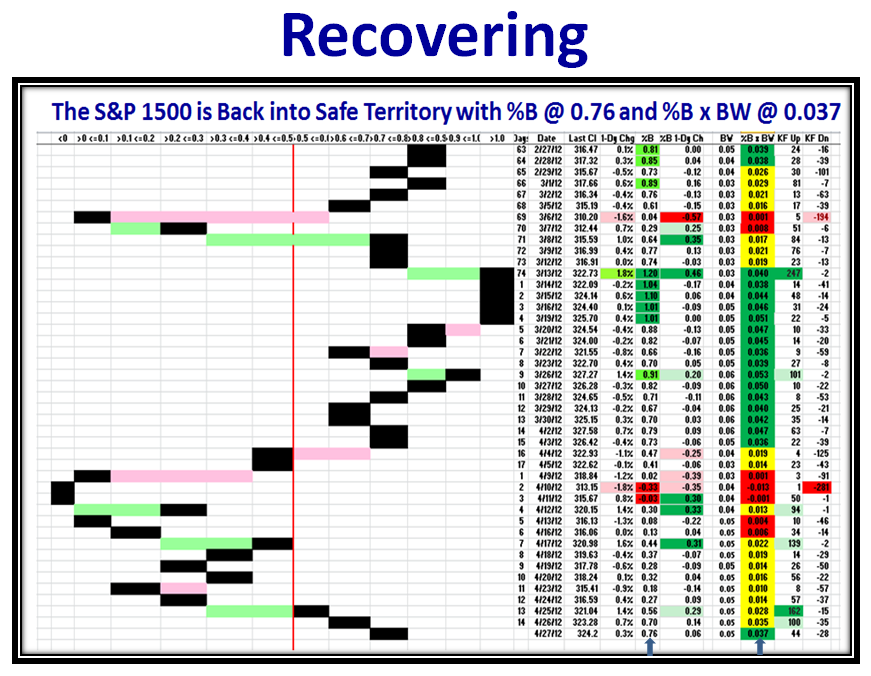
…And more of the same, Recovering:

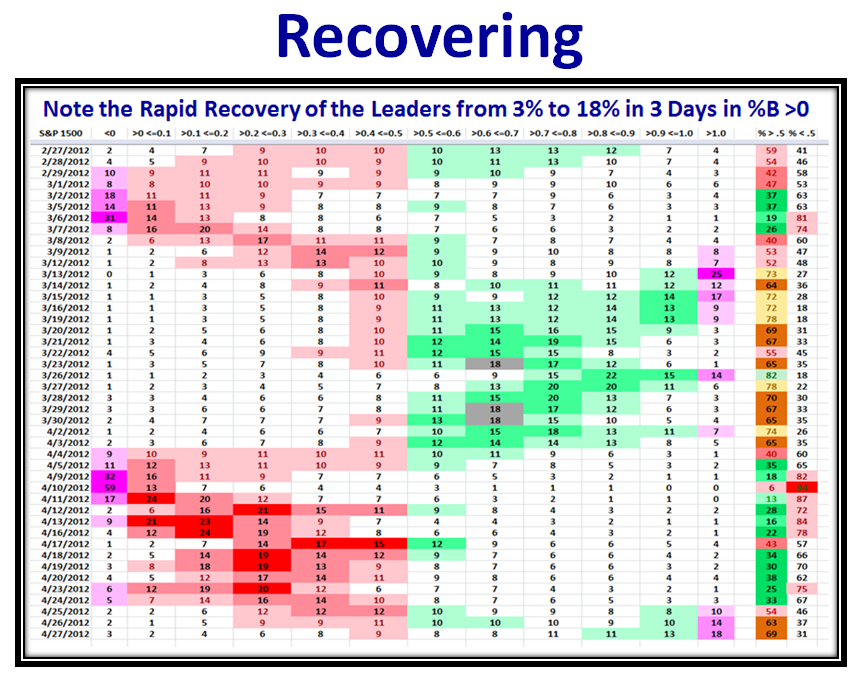
…And one more to confirm that we can stiffen our backbones:

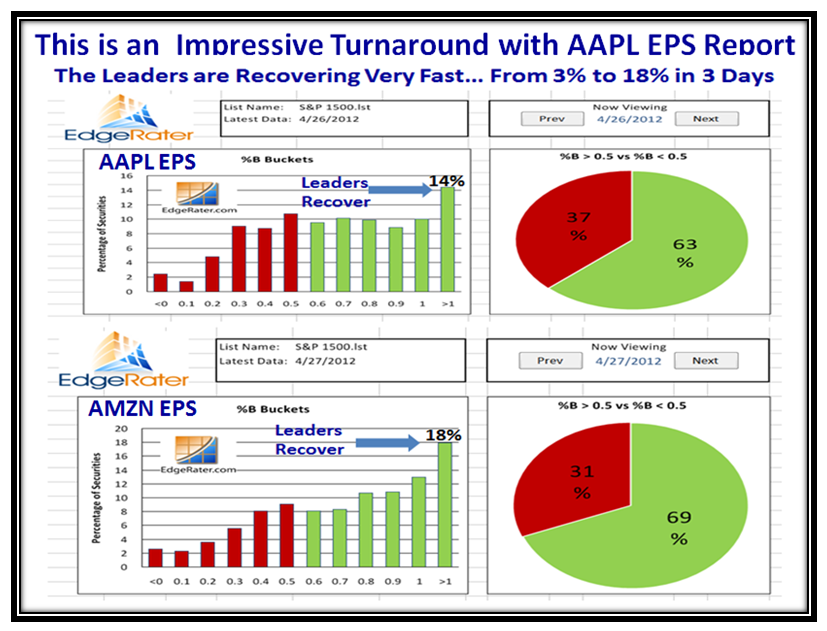
Look at the big move from 3% to 18% in %B >0 in three days as a result of the pull from AAPL & AMZN:

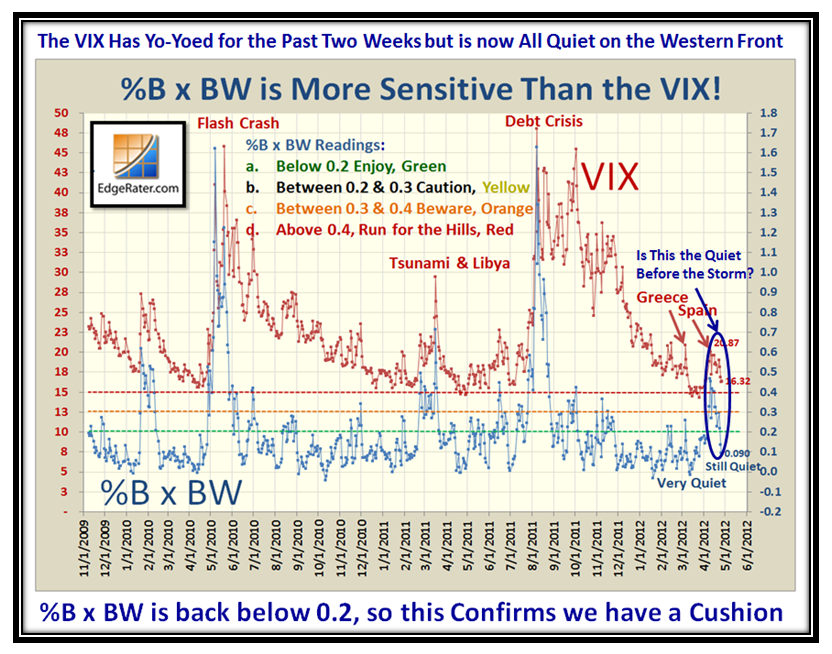
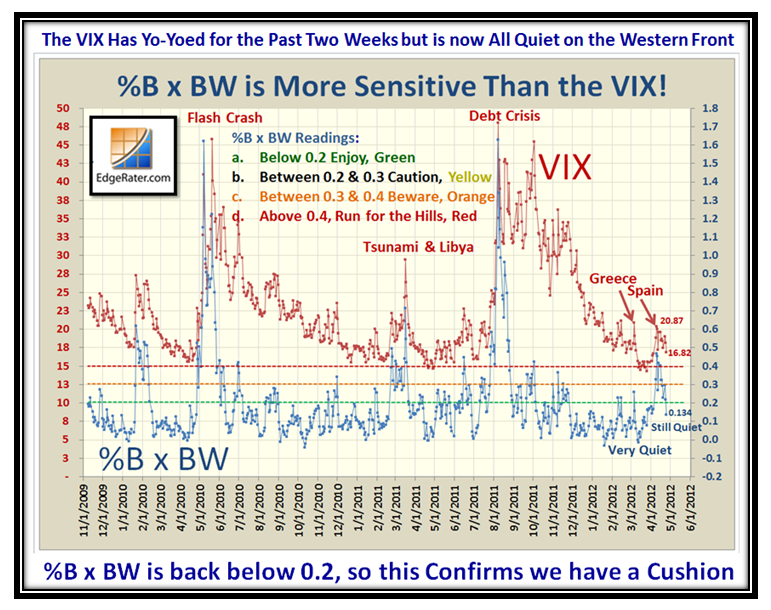
Likewise, after a couple of shots across the bow from the VIX, it is back down to “Quiet” Territory:

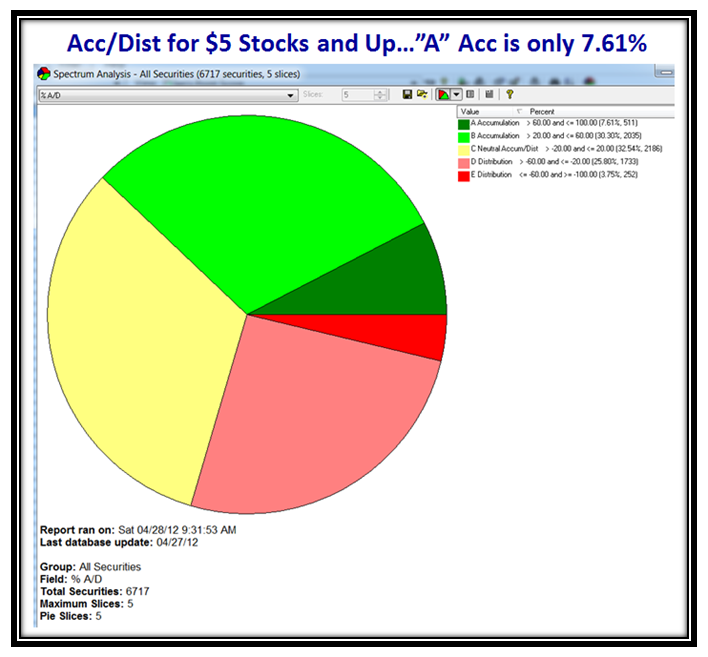
So much for the good news resulting from the positive moves in the last three days.  The $64 question is “How do we establish the INTENSITY of the Positive or Negative Move this coming week to decide whether this is the Real Thing Upwards or another ‘Fakey’, and we head down?”  At this stage of events the best clue will come from the Movement in Accumulation or Distribution of the stocks in the Database above $5.  Let’s first see where we stand as of Friday:

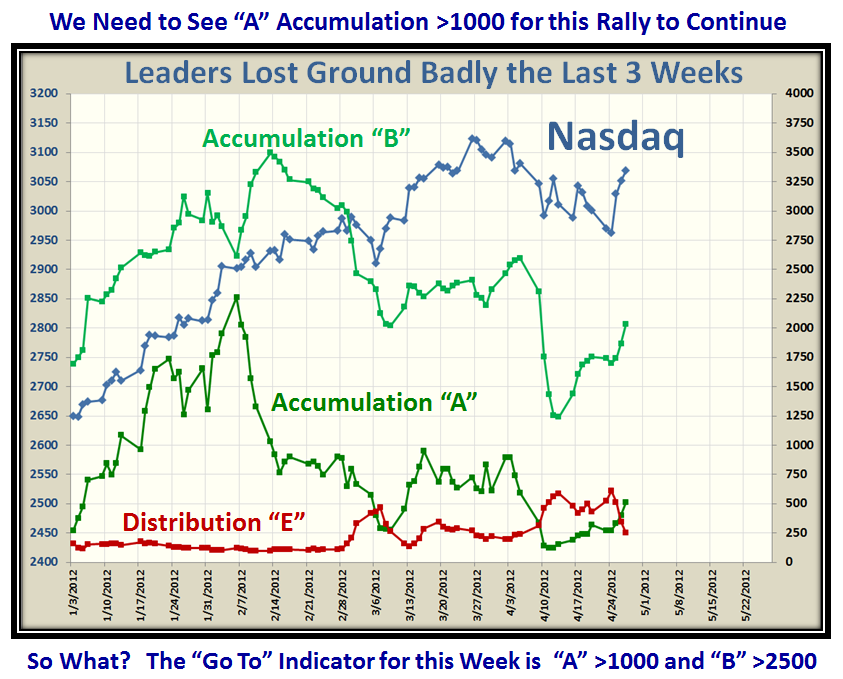
If we look at the recent History of segments “A”, “B” and “E” we can quickly arrive at targets for next week:

Let me repeat that so that it is emblazoned in your memory.  At times like these focus on one thing that will help you the most to understand which way the wind is blowing and with what Intensity.  It won’t change overnight but it better be strong to the upside this week or the market will fizzle again:

Best Regards,

Ian

Stock Market: AAPL Just What the Doctor Ordered!

Wednesday, April 25th, 2012

Now we know that the Stock Market is driven by the focus on just one stock.  We have had this situation before but not to this extent…think of IBM, MSFT, INTC, AMGN, YHOO, AAPL, GOOG, AMZN  in their Hey-Day and now AAPL again…but never to this extent.

Now we know for sure “As AAPL goes, so goes the Market.”  A whopping 2.3% rise in the Nasdaq, 2.69% in the NDX, and 8.87% in itself, together with a Big Kahuna, a humongous 5+ Buckets up in one day, and a Gap Up that took it from below the 50-dma to above the 17-dma.

But now comes the real test…Can it avoid a Head and Shoulders Top and pull the Major Market Indexes up by the bootstraps as they are showing the  same formation?

At least we have a “Cushion” all around, and especially with the VIX which after a turbulent two weeks has calmed down to the Quiet Zone again:

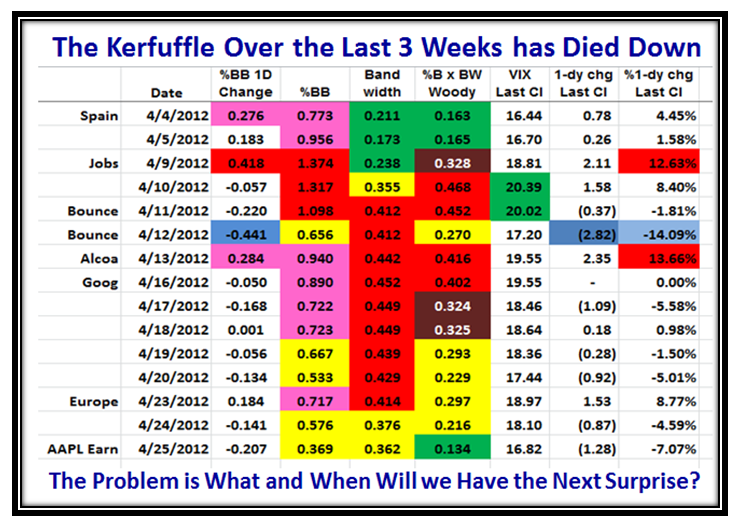
…And here is another view showing the kerfuffle over the last three weeks, but the %B x BW (Woody Indicator) is back to green territory confirming that we have a cushion:

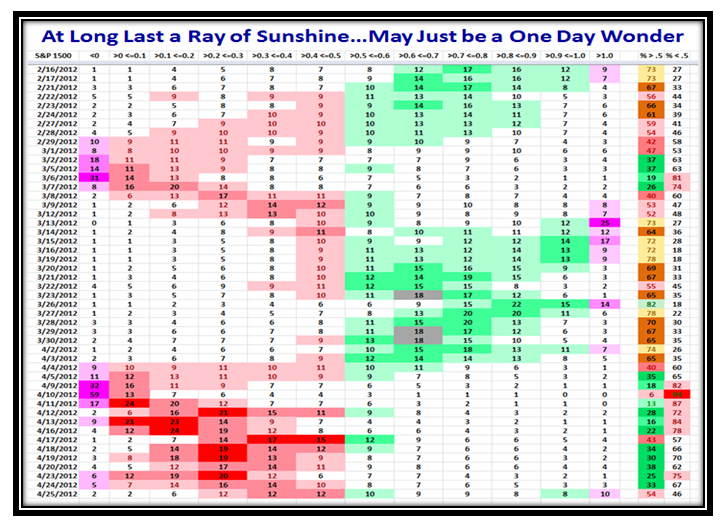
This next chart is again encouraging with the numbers improving to the right with a dash of green.  Of course there has to be a follow through with similar strength for this not to be a one day wonder.

Let’s see what the next couple of days bring, but the Bulls can be thankful for small mercies!

Best Regards,

Ian

Stock Market: Pause to Refresh or the Real Thing?

Sunday, April 22nd, 2012

The four month Rally is hanging on by a thread, but there are conflicting signals.  The general bias is down, but there are pockets of life with some stocks tight as a drum and heading up.  We have had rotation in the Leaders over the past month as I will show you, but the Leaders Index we developed at the March Seminar is showing signs of tiredness.  In all of this, hopefully the Impulse Indicators I have developed will help you determine whether we are in a Pause to Refresh or the Real Thing!  Sing along with me…AyeAyeAyeAye (iiii):

I have a lot of slides for you today, far more than usual, so I will keep the commentary short:

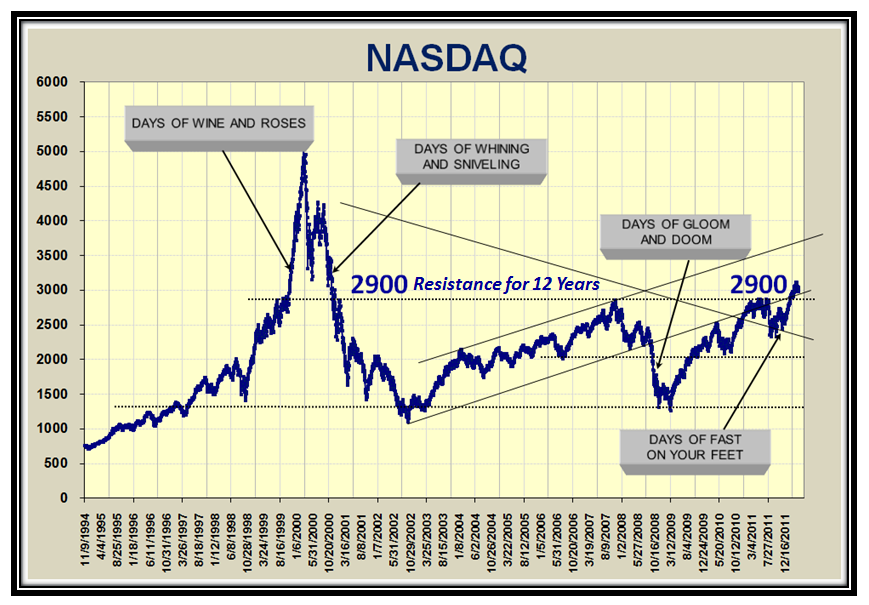
2900 on the Nasdaq has been resistance for 12 Years, and now we must hope it will hold at that level or move up:

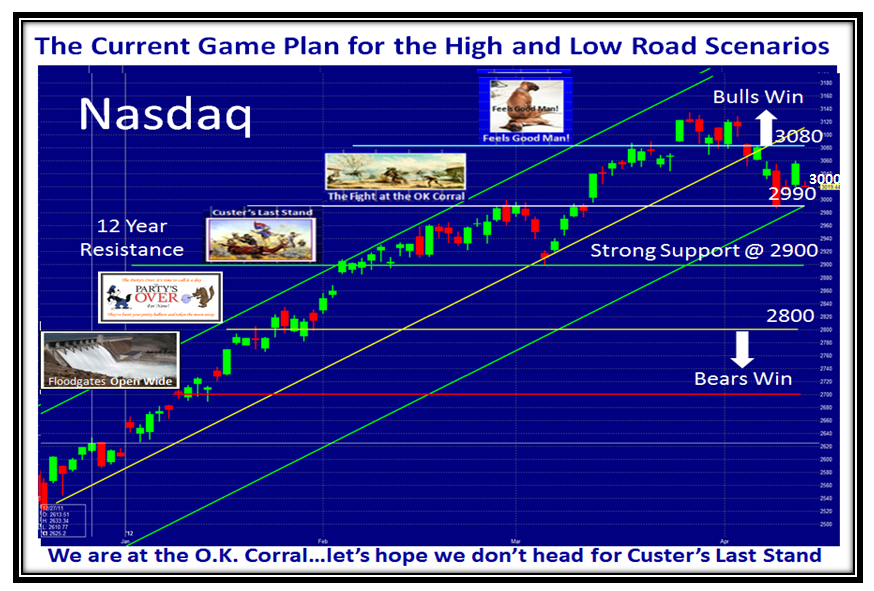
The Game Plan is simple, and I have coupled the stages with my favorite Pictures which suggest where we are:

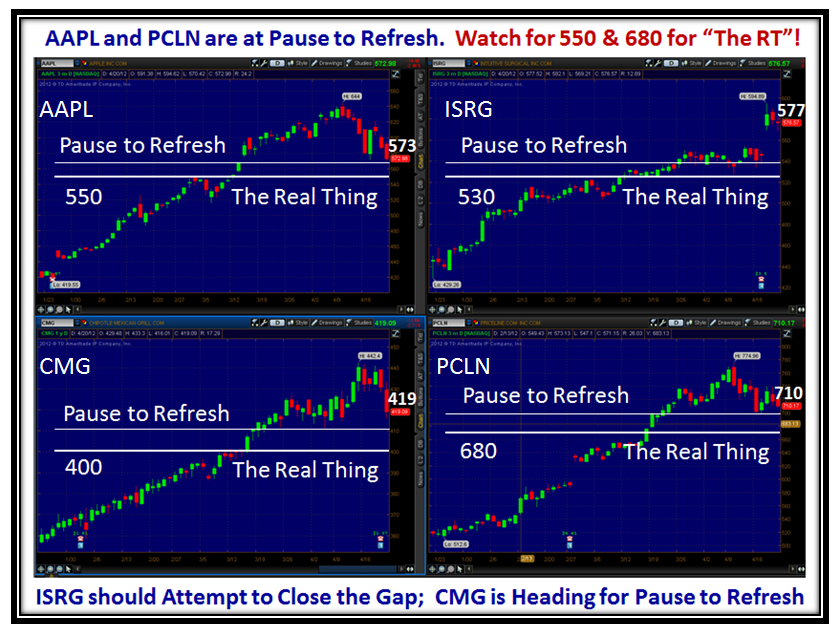
Let’s look at the Canaries;  AAPL and PCLN are at Pause to Refresh.  I show you the Real Thing Downwards:

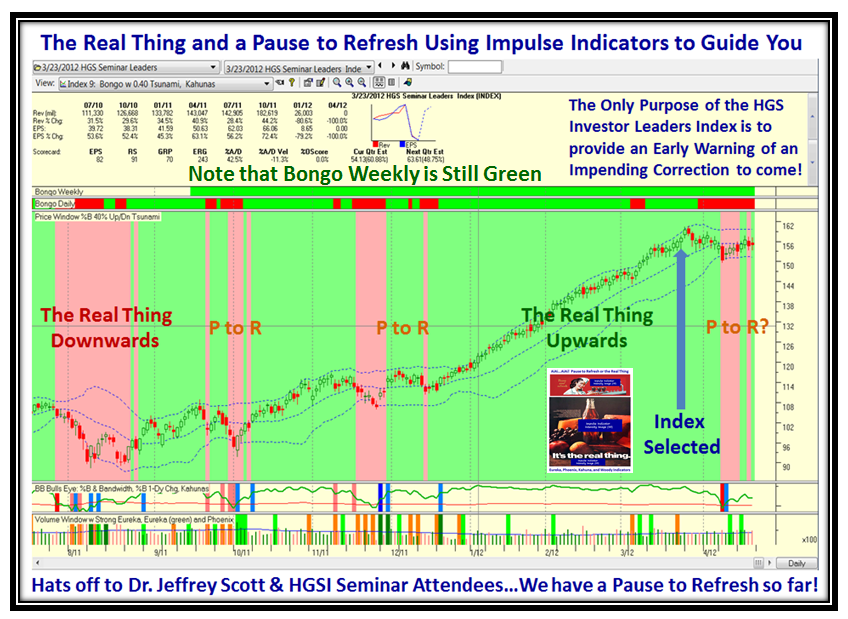
But “The Real Thing” can go either way as I show on this next chart of the Seminar Leaders, with Hats Off to Dr. Jeffrey Scott and the Seminar Attendees.   Make sure to sign up for his Webinar tonight for his latest findings.

Space is limited.  Reserve your Webinar seat now at: https://www2.gotomeeting.com/register/663790210

We are at Pause to Refresh and could go either way after a month in a churning mode:

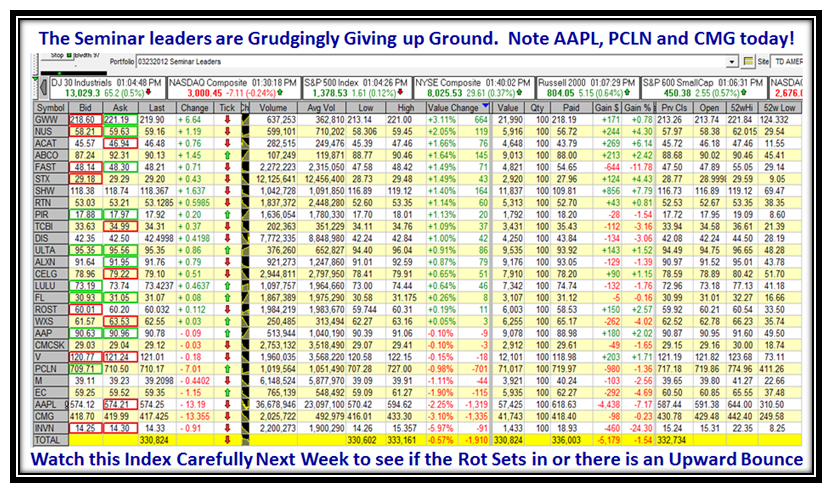
…And here is the list of those stocks and their performance over the past month:

Now let’s take a leaf out of my good friend Ron Brown’s book who has done an excellent Weekly Report on this same subject and you need to make sure to download it.  “How to find the leaders to tell which stocks are still strong in this market.”   Copy and Paste it into your Browser:

http://www.highgrowthstock.com/WeeklyReports/

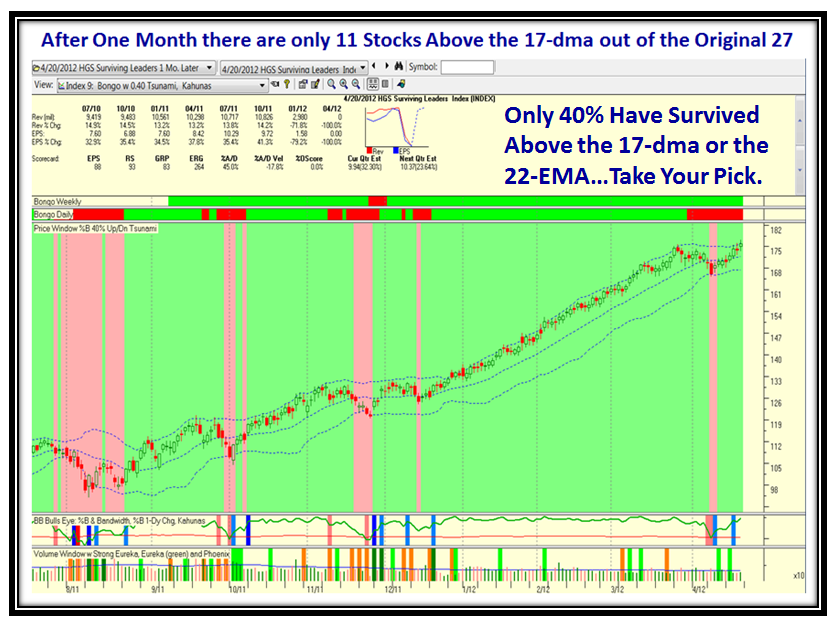
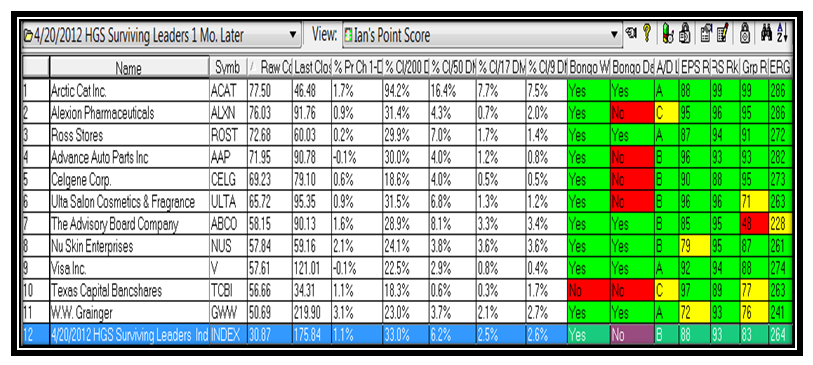
Here is the Index of the stocks that are still above the 17-dma from the list above.  We are down to just 11 Stocks:

…And here is the list:

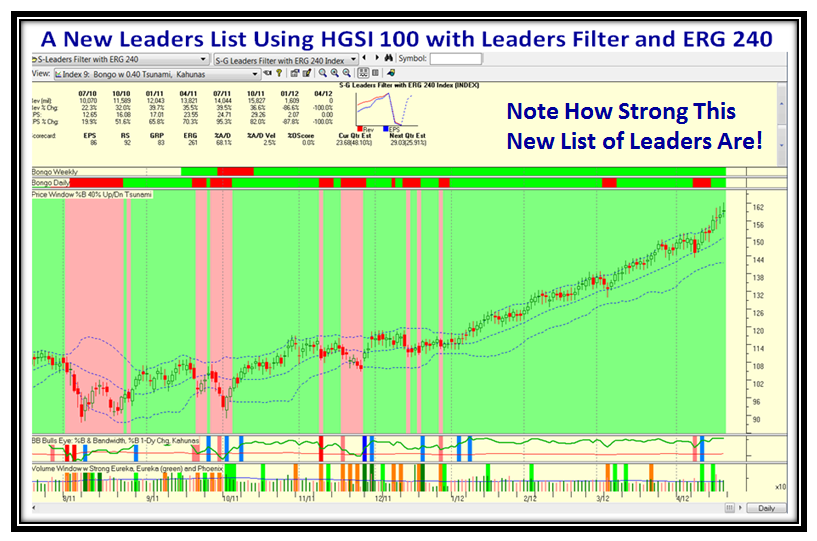
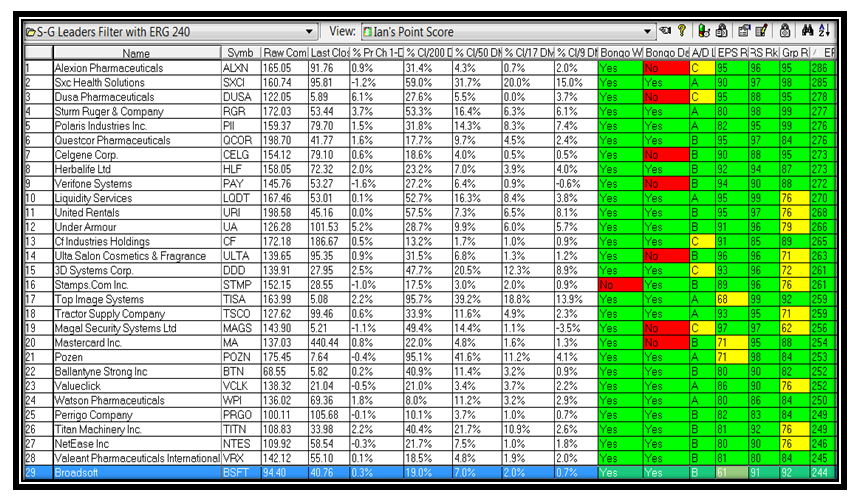
Let’s look at a New Leaders list Index using the HGS 100 as Ron discussed in his Weekly Movie:

…And here is the List:

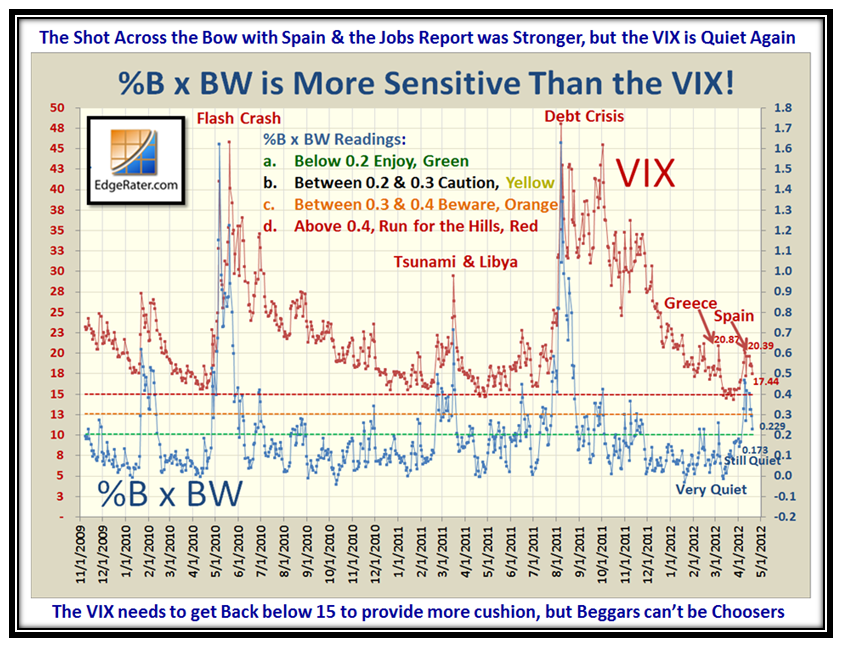
Let’s not get too excited, but the VIX went back into “Quiet Mode” after the recent stirring from Spain and Jobs:

Now for the Gloom and Doom side of the equation, so that we review both points of view:

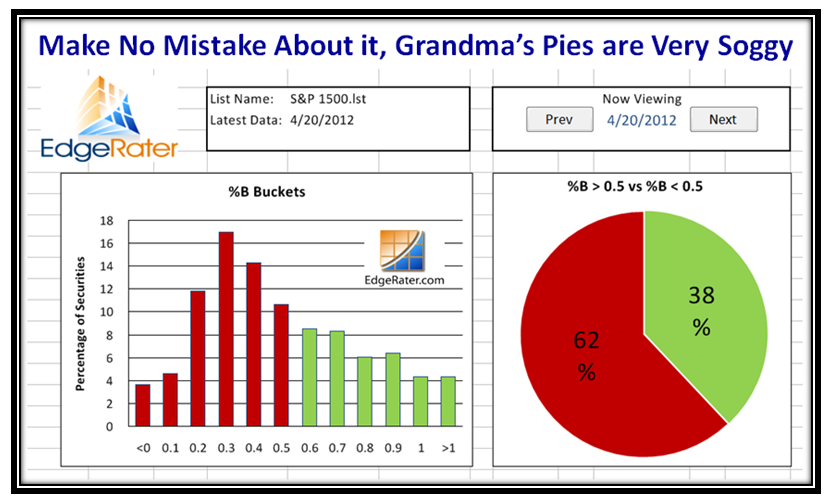
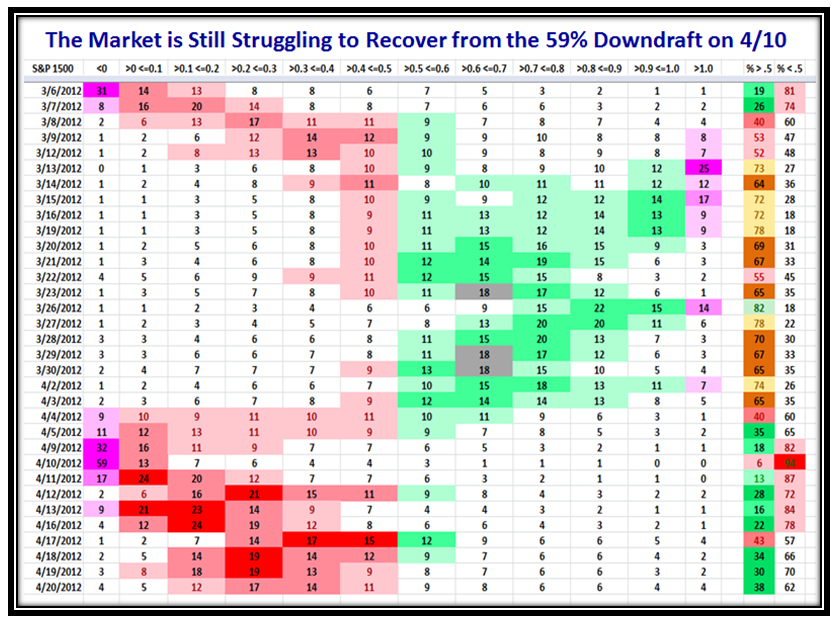
That 59% in Bucket <0 (below the lower BB) has taken its toll, and it seems we currently have “bifurcation”:

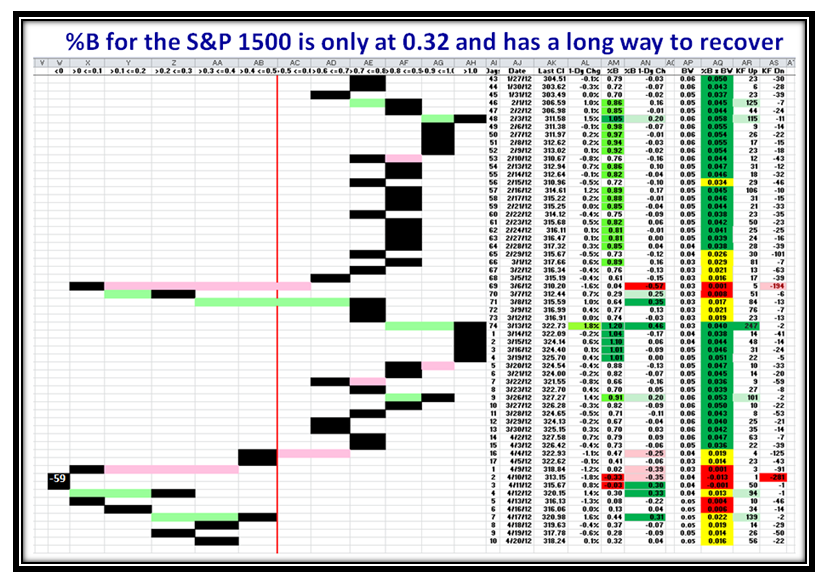
The next chart shows that we are by no means out of the woods, and there is no question the S&P 1500 is weak:

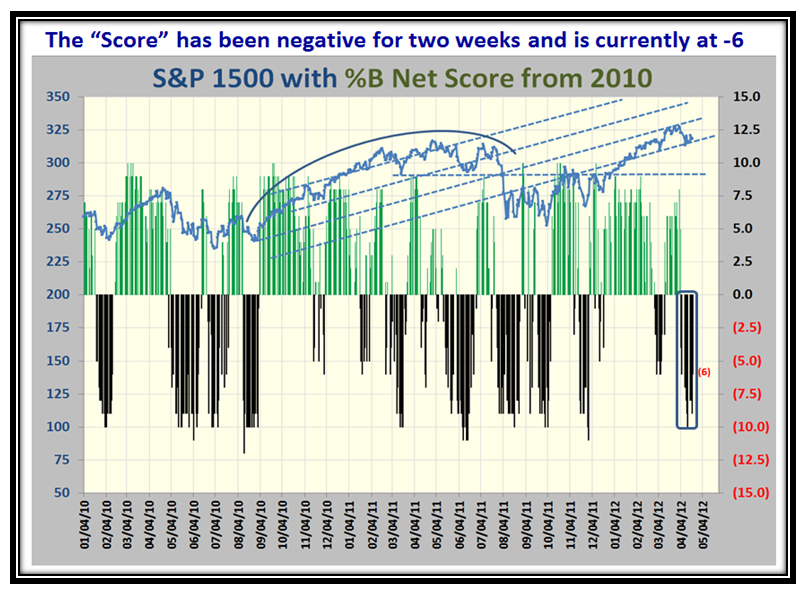
…And the overall Point Score is -6 which means we have to lift the Index a lot higher than it is now:

Each week I say that the next week is critical to getting us out of limbo and either the Market is showing that the Real Thing is either Downwards or Upwards.  My thanks to all the people around the world that support my efforts to keep you appraised of the balanced view of the Market.  Let’s hear from more of you:

Best Regards,

Ian.

Stock Market: Wonders Never Cease!

Tuesday, April 17th, 2012

Last night I wound up the blog note with “The Bottom line is that either there is a Major upward surprise thrust or we continue to drible on down to the next level of support which is certainly “Custer’s Last Stand” at 2900 for the Nasdaq.”

Well, Wonders Never Cease and we got that surge today!

So we have a reprieve from what seemed the inevitable drip-drip process when markets are reaching a peak.  As I am sure you have realized the approach I use is to establish Benchmarks through past History to bound the “What If” scenarios.  The Stakes in the Ground and Measuring Rods come from significant points in time when the Market indicates unusual 1- Day Changes defining action at Overbought and Oversold points in time depicting Fear and Greed.  Days like today come and go and fade into the distance, but by capturing these unusual Impulses as they occur we have a roadmap of the tug-o-war between Bulls and Bears.

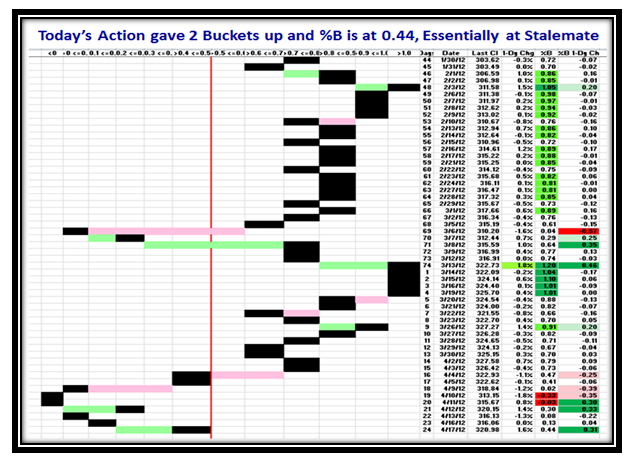
These Impulse Indicators capture the INTENSITY of the move so that we can make judgments as to the possible direction of the Market.  The likes of Eureka, Phoenix and Up and Down Kahunas have become staple diets in dicephering the probable direction especially when the preponderence of the move remains unchallenged instead of a see-saw tug-o-war which define uncertainty.  Yesterday the Bias was down, today we have a two bucket skip up and we are back in the area of Stalemate!

Any daily change of 2% or greater up or down is invariably a sign of a shot across the bow, so that I felt you would like to understand the “Sweet and Sour Spots” of the past for the last 12 Years on the Nasdaq:

The bottom line message and Rule of Thumb of the above chart is that the occasions to sit up and take notice of potential changes in market direction occur about 10% of the time based on the twelve years worth of history on the Nasdaq.  Within a week you and I will have forgotten that we had a 1.82% up day today, but the beauty of using Impulse Indicators such as the Eureka, Phoenix and Kahuna is they will invariably be triggered to give us the framework of the Market action.

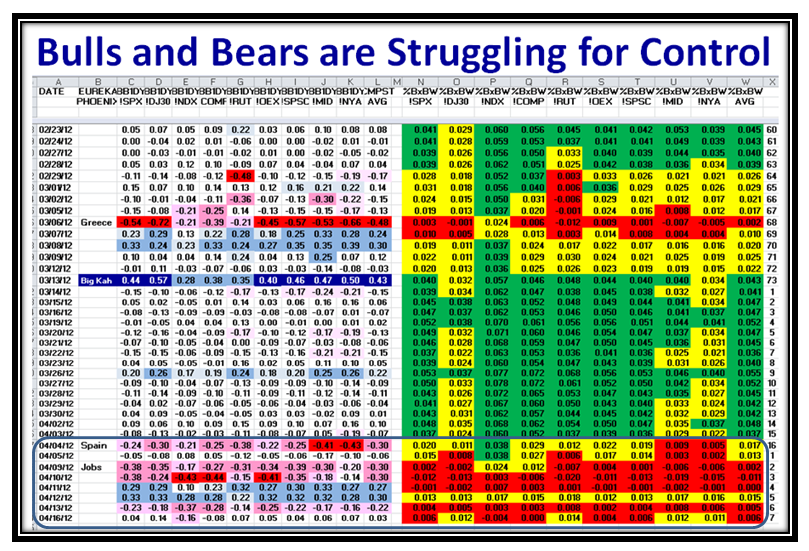
When Bulls and Bears are at Tug-o-War, one immediately understands the instabilty and therefore the caution one should apply to your Investments.  Clear sailing is when the Positive or Negative set of Impulses go unchallenged which then sets the new direction or a confirmation of the old:

Where this Market goes tomorrow is in the lap of the gods and no one is clairvoyant, but what we do know is that all good leaders rise above the 17-dma which is the green line in the above chart.  So the market has work to do to recover from the small correction of about 5% it has had to date.  That line provides the immediate resistance, so we should watch that like a hawk.  Any further new impulses shortly to the upside will provide added fuel to the move, or anything to the downside negates the bias…it is as simple as that.  We are at Stalemate:

The Large Cap Leaders of AAPL, PCLN and ISRG all had strong up days today as did the entire NDX!  Good luck.

Best Regards,

Ian.

Stock Market: On a Wing and a Prayer

Monday, April 16th, 2012

The hour is late and this will be a short and sweet update:

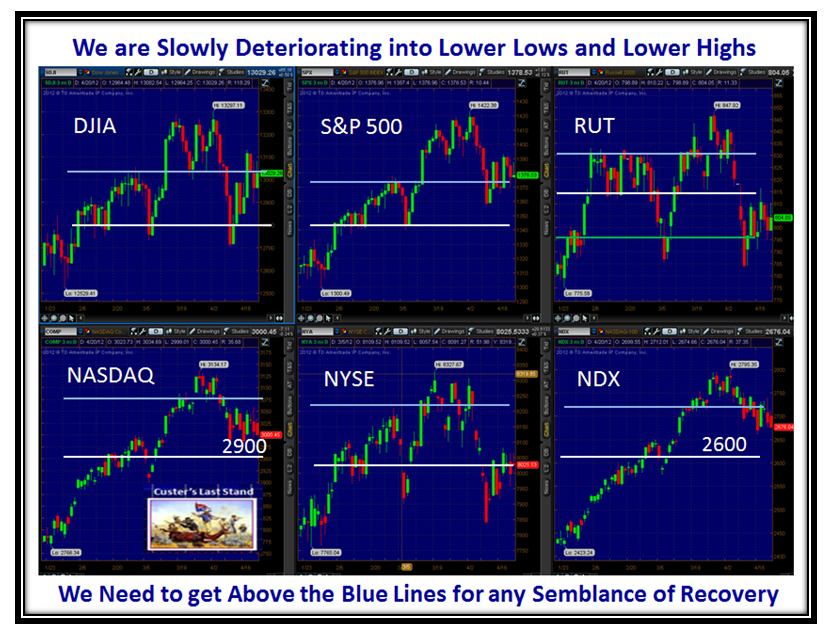
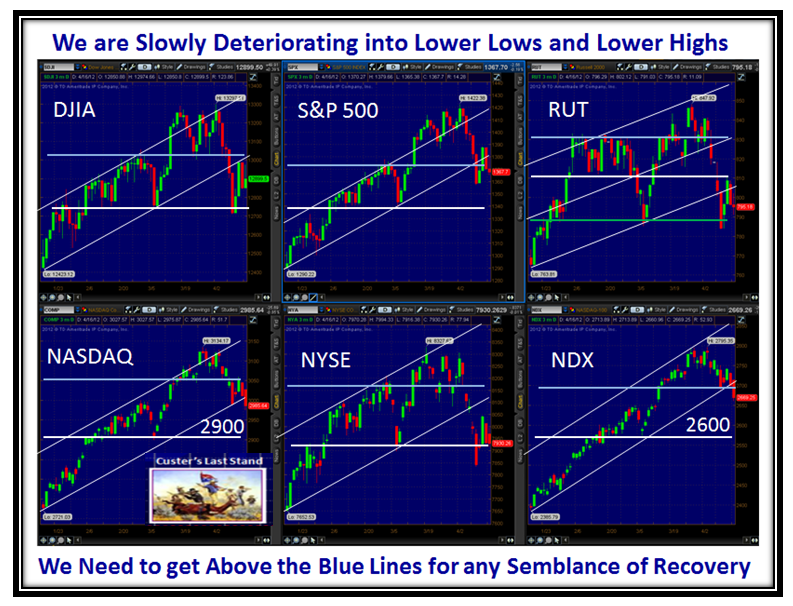
All the Major Market Indexes except the DJIA took a small hit today with the Nasdaq and NDX hit the worst:

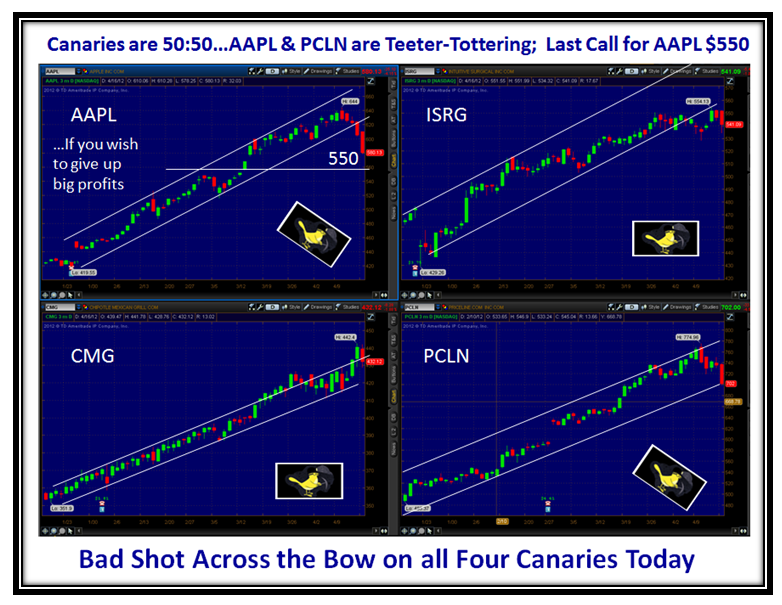
And here are the Canaries with AAPL and PCLN teeter-tottering:

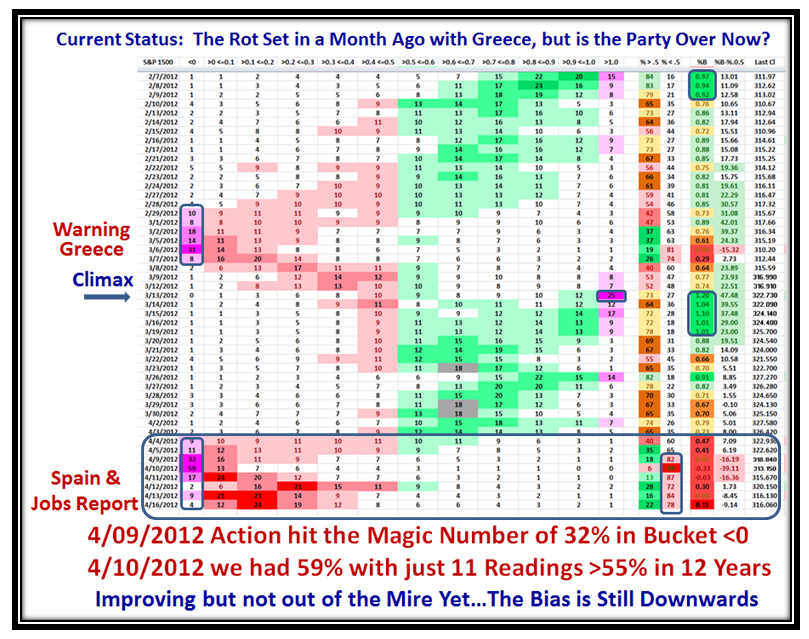
The 59% of S&P 1500 stocks below the Lower BB (<0) took the stuffing out of the Market:

…And here is the evidence that shows the Market Indexes are struggling.  The Market has been in a Correction for the past seven days:

The Bottom line is that either there is a Major upward surprise thrust or we continue to drible on down to the next level of support which is certainly “Custer’s Last Stand” at 2900 for the Nasdaq.

Best Regards,

Ian

Copyright © 2007-2010 Ian Woodward
Disclaimer: Commentaries on this Blog are not to be construed as recommendations to buy or sell the market and/or specific securites. The consumer of the information is responsible for their own investment decisions.